The following BPM tool guide is one of a series produced for ICAEW by Professor Mike Bourne of Cranfield University.
Introduction
As accountants we like things to run smoothly, but in reality they don't. We get variation, especially in the numbers reported through our performance measures and management accounts. But, how do we react to these variations? And probably more importantly, how should we react?
Statistical process control is a technique developed in the 1920s in Bell Laboratories to improve the manufacture of telephones by Dr Shewhart. The management at Bell found that the harder they tried to reduce the errors in phones being produced, the more errors they created. This was because they didn't understand the nature of variation, and more importantly, when and how to intervene in the process.
What is Statistical Process Control?
Statistical Process Control (SPC) is an approach to managing processes by looking at the data and using statistical techniques to guide your action.
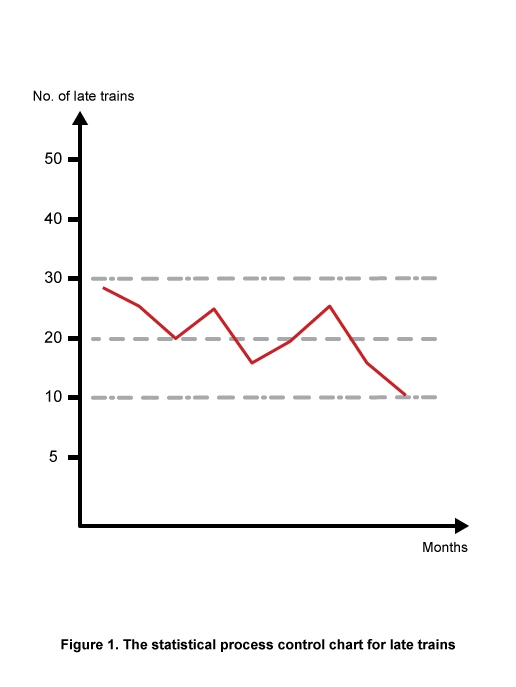
At the heart of SPC is the control chart as shown in figure 1. The chart shows a series of data points of performance achieved over time. However, the chart also has the following lines.
- The mean, this is simply the average of all the data points over the period covered by the chart. This simply enables an observer to see when performance was above and below average and the pattern around the mean.
- The Upper Control Limit (UCL) represents the upper limit of variation we would expect to see in the process if it was running normally.
- The Lower Control Limit (LCL) represents the lower limit of variation we would expect to see in the process if it was running normally.
Creating an SPC chart
There are software packages available to do this for you, and to calculate the mean together with the upper and lower control limits. If you have a significant amount of data then this is obviously the way to go. However, below, I have illustrated the calculations in a simple example.
In this table we have used the example of late trains by month. I will use this table to provide a worked example showing how to calculate the different elements of the control chart.
- Calculate the average number of late trains per month from the number of late trains in the table 250 / 10 = 25.
- Calculate the variation between each of the results. This is done for each pair in turn. The number required is the absolute variation, so all the results are positive.
- Calculate the mean of this variation. In this case the total variation is 18, which we divide by the number of variations which is 9. So 18 / 9 = 2.
- Now multiply the mean of the variation by 2.66. (The figure 2.66 is the constant used to calculate control limit. If you are a statistician it represents 3 sigma. Here 2 X 2.66 = 5.32.
- The upper control limit is calculated by adding 5.32 to the mean (25), giving 30.32
- The lower control limit is calculated by subtracting 5.32 from the mean (25), giving 19.68.
Practical implications of SPC
Firstly, performance doesn't simply improve because you measure it. That would be like trying to increase the speed of your car by putting your finger through the glass of the speedometer and forcing up the indicator. You accelerate a car by pushing on the accelerator and that sends more petrol to the engine making it turn faster. That is what makes the car accelerate. Basically, your actions physically change what is happening in the organisation and this is what has an impact on the performance. So if we measure performance over time it will go up and down. It will vary naturally but performance, within this natural variation, won't change.
Secondly, performance is predictable. If you leave the process alone and plot the output it will vary but it will follow a pattern. This can be modelled statistically using statistical process charts. These charts will show the average of what is being achieved and the normal limits of variation. Technically we call these the upper and lower control limits, and normally the process (if left alone) will continue to perform within these limits. That is predictability. The problem for most of us is that the limits are too wide apart, meaning that the variation is too large. To make the process more predictable we need to improve the process to reduce the variation. This is the first step in managing performance improvement.
Now let us turn to the question of acting. That is what management often does. It sees performance go down and thinks some action needs to be taken. But does it? Is the change simply normal variation in the process or something management can and should act upon? Let me explain what I mean by this with a simple analogy, my journey to work.
How long does it take you to drive to work? For me it is about 55 minutes. When I say about 55 minutes it does vary, but actual from my home to Cranfield it is fairly consistent. Traffic may make a difference, rain does too. Queues at the A1 roundabout have an impact and the odd tractor. Even school holidays and half term have an impact. But normally I am at Cranfield within an hour and rarely less than 50 minutes. Then very occasionally sometimes thing goes really wrong. An accident closes the road and I am diverted and delayed by half an hour. Once in 15 years we had bad snow and it took 6 hours to drive home. The question to ask is how we react to these variations?
If I need to be in by 09.00 I make sure I leave by 08.00 as normally I will be in within the hour. But if there is a major road accident and I am delayed by half an hour, what do I do the next day? Do I leave at 07.30 or do I leave at 08.00? Usually the answer is that I leave at 08.00 as I believe that the accident was a special incident and not something that I will encounter every day. But if the delay was caused by some new road works that I expected to continue, then my decision would be different. So in my mind I am distinguishing between normal variation in my journey time of 50 to 60 minutes and special events that are not normal occurrences. That is also how we should react to changes in performance at work.
Statistical process control is not a new concept, it was developed from manufacturing telephones in Bell Laboratories in the 1920s but its application is not simply confined to manufacturing or operations. It is used on anything that can be considered a process. At Bell Laboratories Dr Walter Shewhart discovered that in a process there is normal variation and special cause variation (just like my journey to work). Normal variation is the variation that is caused by all the little things that vary within the process that have an impact on the output. This is the variation that falls between the statistically calculated upper and lower control limits on a Statistical Process Control Chart. Then there are special cause variations, when something really unexpected goes wrong. This is when we get performance points falling outside the control limits.
Dr Shewhart's contribution was the distinction between normal and special cause variation, especially how we deal with it. He argued that it is not economic to try and find the cause for normal variation as the cause is lost in the noise of the process. However, it is usually possible to relatively easily identify the reasons for special causes (my accidents and heavy snow fall on the way to work). This also means that we should act very differently too. If we want to improve normal variation we don't look at every variation, we focus on the process as a whole. By working on each element of the process in turn and by refining and improving it we will reduce normal variation over time. But when something falls outside the control limits we realise we have a special cause. This is a signal that something has occurred that we can identify and we should act by establishing the special cause and then trying to ensure that the special cause can't happen again.
So, in conclusion
- Your processes are all currently predictable, but you may not be happy with the degree of variation that occurs.
- The way to reduce the level of normal variation is to work on your processes to improve how they function as a whole.
- The way to reduce special cause variation is to identify when they are special causes and then remove (if possible) the special cause
- But don't react to every change in performance. It is not economic to do so and this tampering with the process has been shown to make variation and performance worse.
Benefits of using SPC
Pitfalls of SPC
Useful links
Some vendor sites that you may find interesting:
More support on business
Read our articles, eBooks, reports and guides on Business Performance Management
BPM hubTools, templates and case studiesCan't find what you're looking for?
The ICAEW Library can give you the right information from trustworthy, professional sources that aren't freely available online. Contact us for expert help with your enquiries and research.
