
It’s a short and sweet one this month, inspired by a couple of errors I have seen in real life models over the past few days. There is nothing like being topical.
Breakeven analysis is part of an accountant’s staple diet (especially if you eat staples), but it’s an area of modelling where are things are often done badly, or worse, incorrectly. The objective of breakeven analysis is simple: for a given model, what level for a certain driver (e.g. sales) does this project have to perform in order to not make a loss?
Now, I have said loss, but in the current environment, cash flow can be equally, if not more, important. It simply concerns flexing a parameter to ensure negative consequences are avoided. Therefore, it is a type of (specialised) sensitivity analysis.
Consider the following scenario:
Against a unit selling price of $25.00, there are two types of costs:
- variable: direct costs that are incurred per toilet roll, g. materials, labour and overheads
- fixed: indirect costs that will be incurred in any case, g. manufacturing and marketing costs.
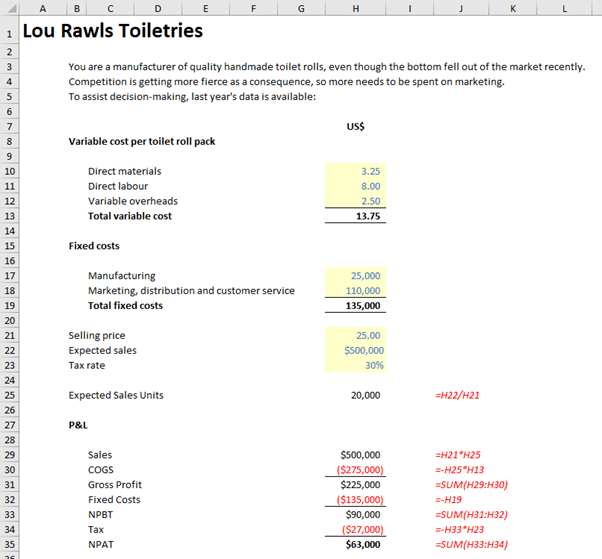
Projected profit for 20,000 sales (being the expected sales of $500,000 in cell H22 divided by the unit selling price of $25 in cell H21) is $63,000 after tax – but what would be the minimum sales amount be to avoid a loss (i.e. “break even”)? If we are risk averse, we may be more interested in this figure than the expected profit.
This could be calculated using Excel’s Goal Seek feature, which is often how modellers obtain their result. However, whenever you can, you should try to use calculations – as more information is obtained, and hence more informed decisions may be made.
Assuming tax is only paid on profits, breakeven is achieved in this instance when the net of sales less the variable costs (the contribution) equals the fixed costs:
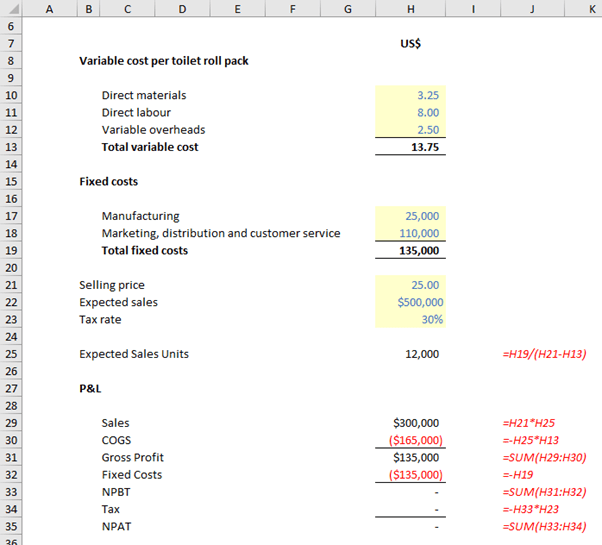
From the above image, the number of units to be sold to break even (wipe evenly?) is computed by dividing the fixed costs (cell H19) by the unit contribution (H21 – H13). This provides more insight than using Goal Seek (which would generate the same number). For example, the breakeven number of units may be reduced by:
- increasing the unit selling price
- reducing the direct costs
- reducing the fixed costs.
It should also be noted that changing the prevailing tax rate has no effect.
Care should be taken if the concept of breakeven is extended to derive the number of units to be sold for a target Net Profit After Tax (NPAT). Not that accountants ever try and do such a thing.
Consider the following:
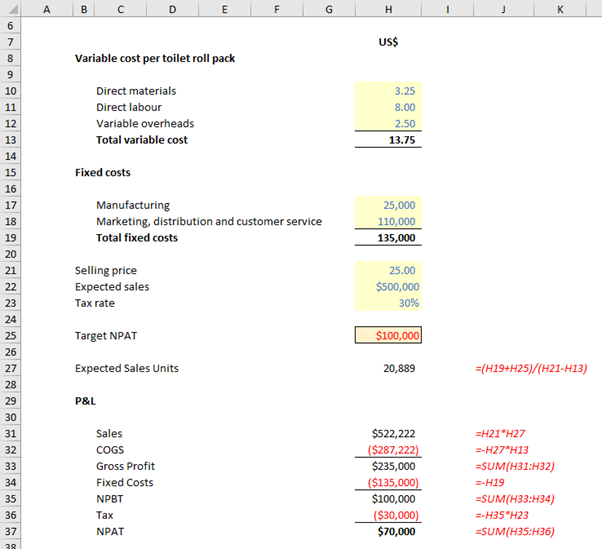
In the above illustration, I have now included a target NPAT (cell H25) of $100,000. Simply adding this figure to the fixed costs is incorrect (NPAT is $70,000). This is because we have forgotten tax: profits are derived post tax, so we need to gross up the target figure by (1 – tax rate), viz.
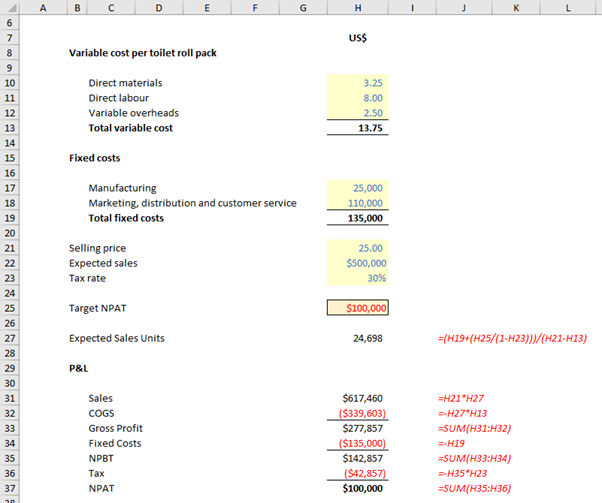
Note the formula in cell H27:
=(H19+(H25/(1-H23)))/(H21-H13)
Here, the calculation H25/(1-H23) takes the target NPAT (H25) and scales it up by the tax rate (1-H23), so that it reverts to the target amount once tax has been deducted. It’s a common mistake made in analytical models and is an error that is easily avoided. Don’t make the same mistake (keep learning and make others instead).
Excel community
This article is brought to you by the Excel Community where you can find additional extended articles and webinar recordings on a variety of Excel related topics. In addition to live training events, Excel Community members have access to a full suite of online training modules from Excel with Business.

Archive and Knowledge Base
This archive of Excel Community content from the ION platform will allow you to read the content of the articles but the functionality on the pages is limited. The ION search box, tags and navigation buttons on the archived pages will not work. Pages will load more slowly than a live website. You may be able to follow links to other articles but if this does not work, please return to the archive search. You can also search our Knowledge Base for access to all articles, new and archived, organised by topic.