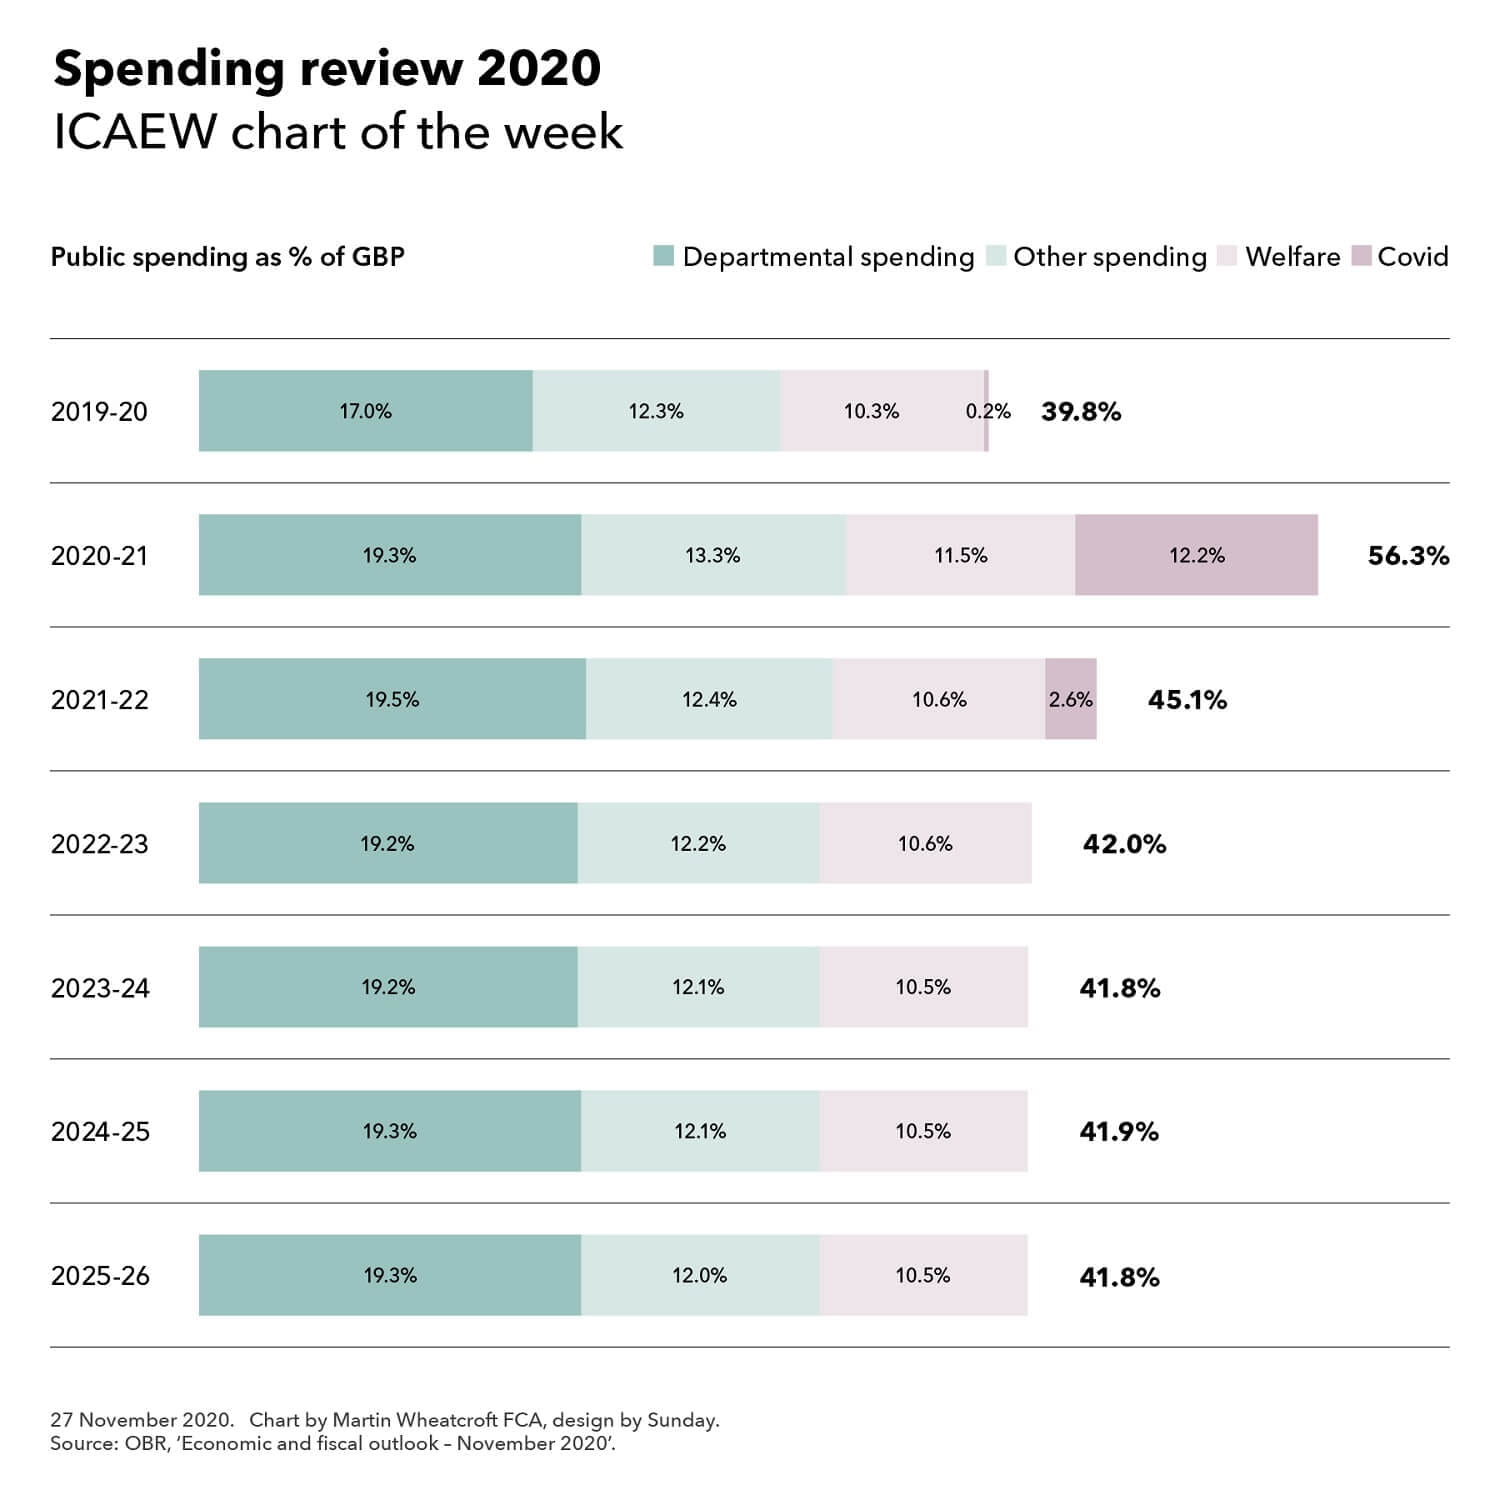
There was a lot of substance in the Spending Review 2020 announced this week, with a lot more going on under the surface with – for example – the launch of the National Infrastructure Strategy. However, we thought we would focus on the bigger picture for the #icaewchartoftheweek and to look at the scale of public spending in relation to the size of the overall economy.
Of course, the current financial year has seen a massive expansion in the amount of public spending – up from £884bn or 39.8% of GDP of £2,218bn in 2019-20 to a revised budget of £1,165bn or 56.3% of GDP of £2,069bn. The combination of higher spending and a smaller economy this year makes for an eye-watering percentage.
Next financial year will see further COVID support measures adding to public spending, but the key takeaway from the chart is that public spending is expected to persist at around 42% of GDP from 2022-23 onwards, reflecting a permanently smaller economy following the pandemic combined with slightly higher spending in real terms. This is 2% higher than the just under 40% seen in 2019-20 and 3%-4% higher than the 38%-39% longer-run average.
Around half of the increase in departmental spending seen in the chart relates to capital investment in line with the government’s infrastructure plans, while the remainder relates to operational spending with more for health, education and defence being partially offset by the reduction in development spending and the one-off public sector pay freeze.
With scope for substantial reductions in public spending seen to be limited, there are two main routes for covering this increase in costs – economic growth to boost the size of the economy or higher taxes. The government will be hoping that its increase in capital investment will help to deliver on the former, but it appears increasingly likely that tax rises will be needed over the course of the coming decade.