Each year the Office for National Statistics (ONS) publishes the ‘Blue Book’ on the national accounts, its definitive analysis of economic activity over the course of the previous year. This analysis supersedes the preliminary and revised monthly and quarterly estimates issued up until that point, based on extensive analysis by the official statisticians.
The 2023 edition of the Blue Book is scheduled to be published on 31 October 2023. It will be eagerly pored over by economists in and outside government who will be eager to understand how the UK economy performed during 2022, and how this ‘final’ version of the 2022 numbers line up with those preliminary and revised estimates, just as they did last year when looking at GDP for 2021.
However, in the world of statistics numbers are never final. On 1 September 2023, the ONS announced methodological and data improvements to last year’s Blue Book – the numbers for 2021 and earlier years. These prior-period adjustments partly reflected a methodology change in the way the three different methods of calculating GDP (output, income and expenditure) are reconciled, but much more significant were revisions to the data used to calculate some of the key statistics, causing much wailing and gnashing of teeth by some prominent economic commentators as the narrative around the UK’s emergence from the pandemic changed.
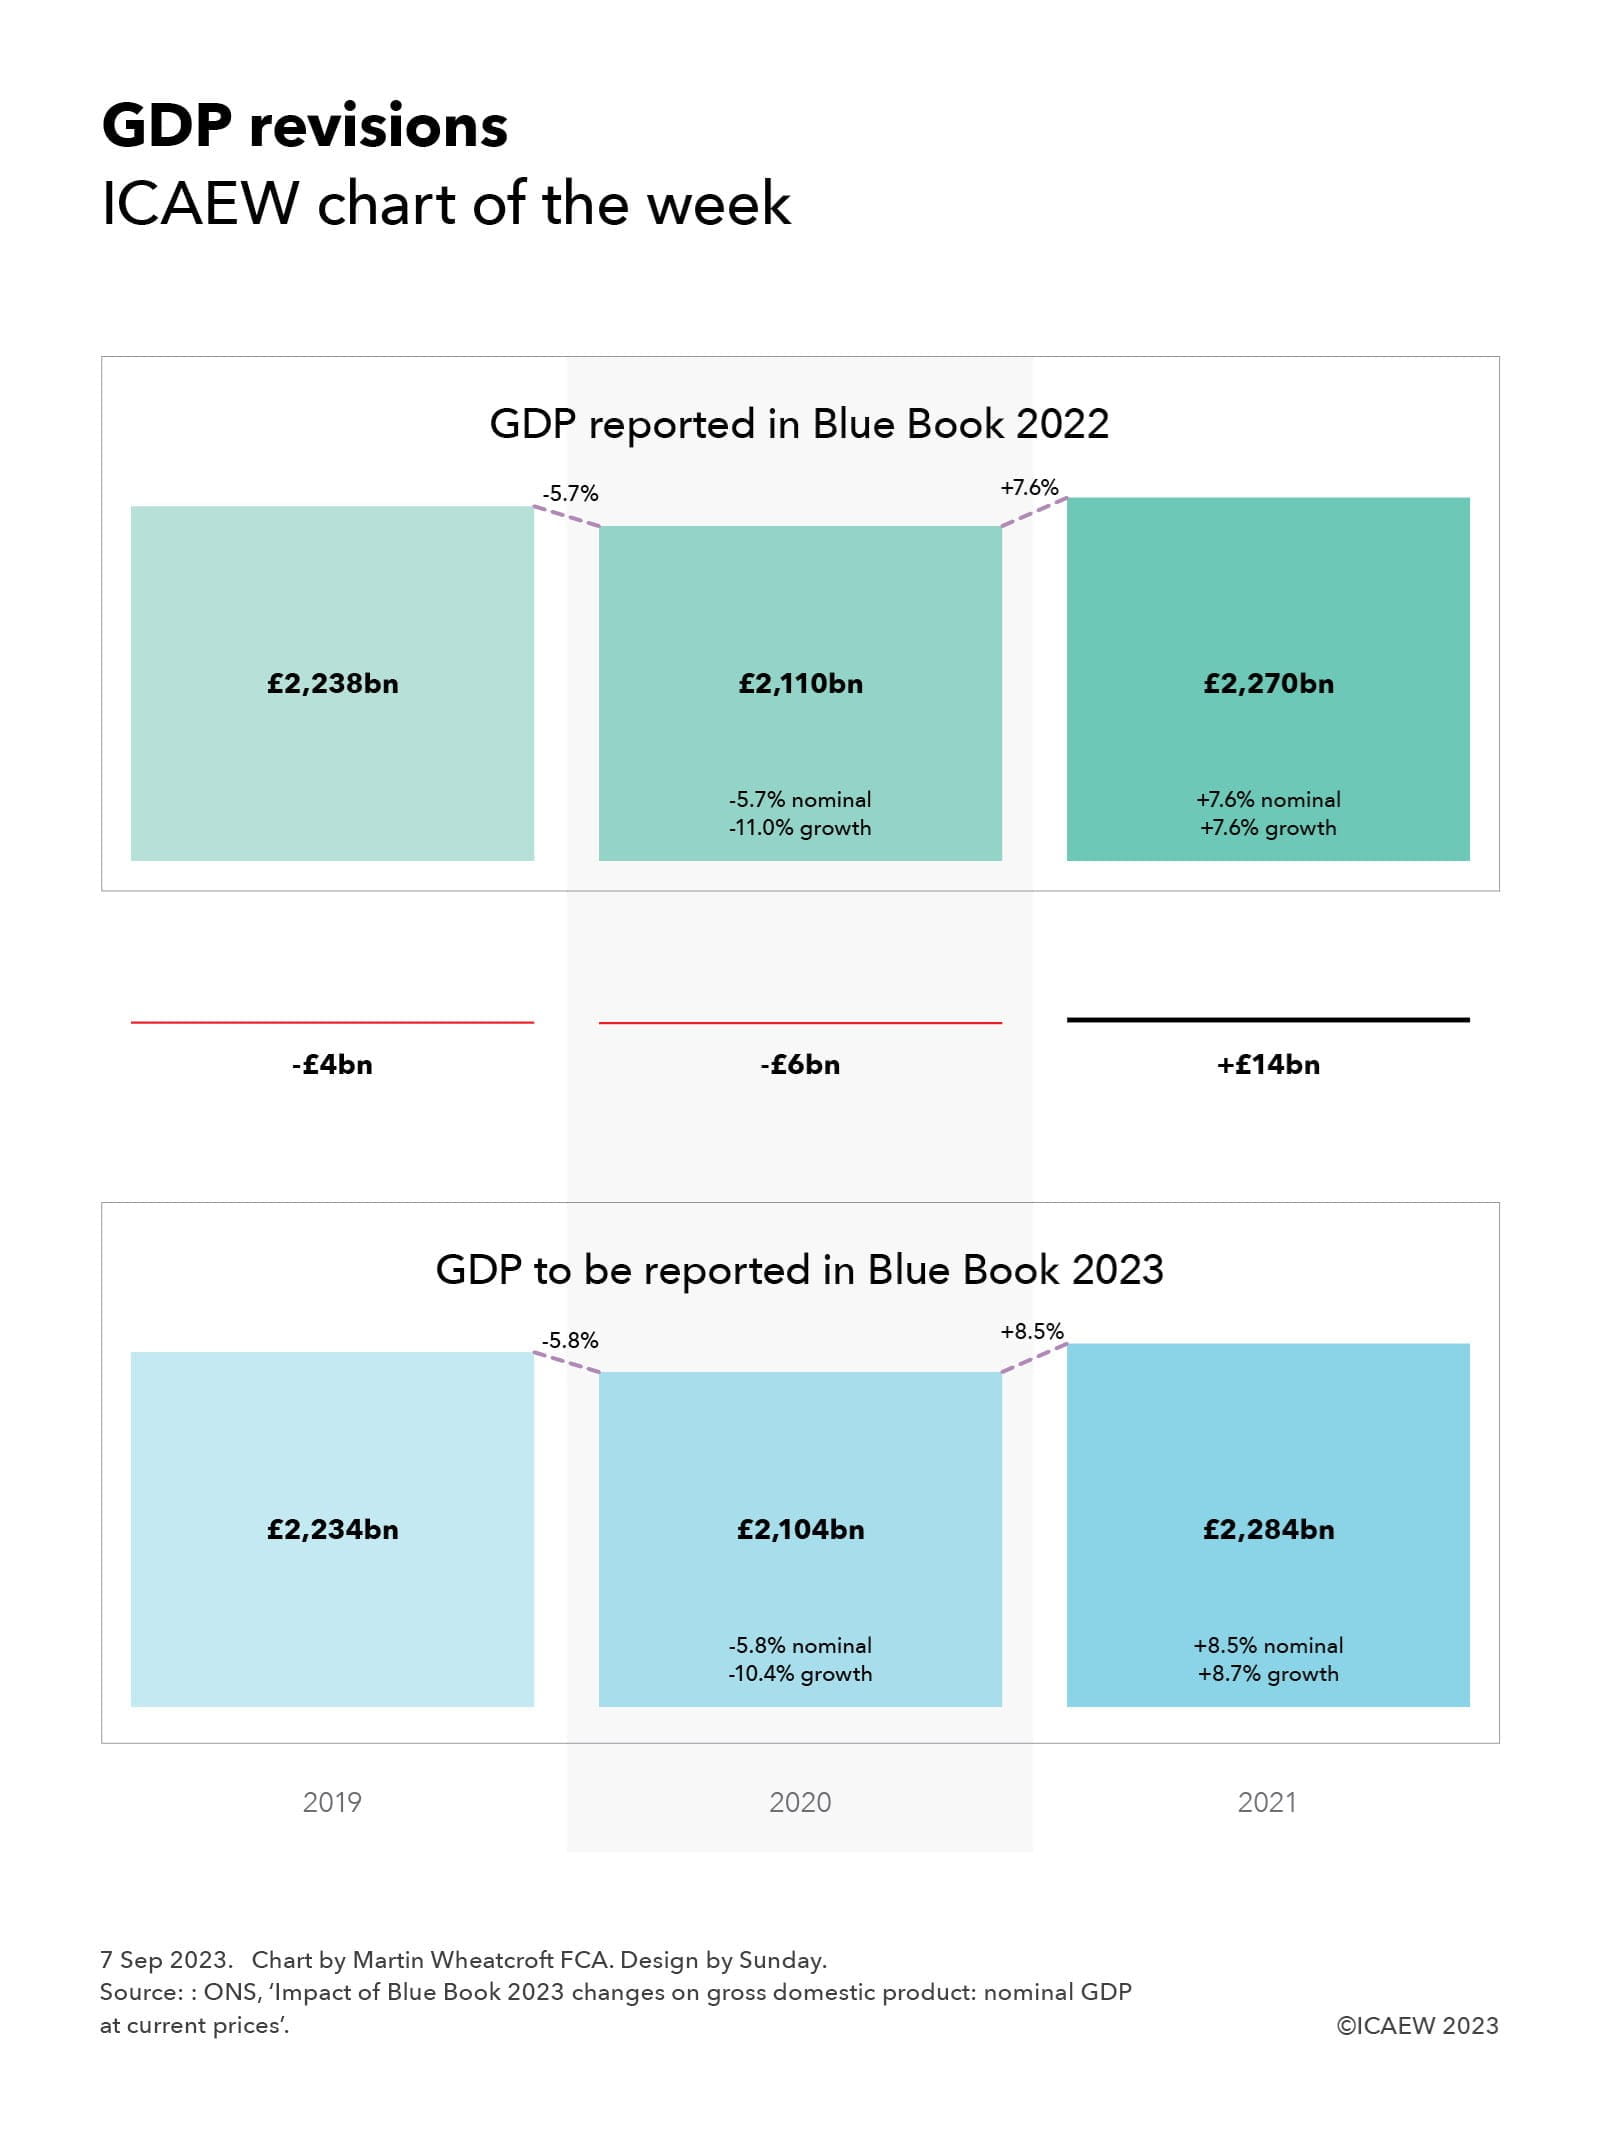
As our chart this week illustrates, the revisions to GDP do not at first sight appear to be that significant. GDP for 2019 has been revised down by £4bn from the previously reported £2,238bn to a new official number of £2,234bn; GDP for 2020 is £6bn down from £2,110bn to £2,104bn; and GDP for 2021 has been revised up by £14bn from £2,270bn to £2,284bn. These seem relatively small changes when looking at trillions of pounds of economic activity.
Where the change really has an impact is in looking at the trends, especially after adjusting for inflation. On a nominal basis, a 5.7% nominal decrease in 2020 followed by a 7.6% increase in 2021 has changed to a 5.8% decrease and an 8.5% increase, but in real terms the previously reported economic contraction of 11.0% in 2020 followed by a 7.6% recovery has changed to a smaller contraction of 10.4% followed by a stronger recovery of 8.7%.
Of course, the devil is in the detail and some of the revisions at an industry level have been much more dramatic, with wholesalers and retailers now believed to have grown more strongly than previously believed, while the iron and steel industry changed from growth to contraction.
Many economic commentators have focused on the change in quarterly GDP (not shown in the chart) where the arithmetical changes have been more pronounced. The movement from the fourth quarter of 2019 (previously £568bn, now £566bn) and the fourth quarter for 2021 (previously £593bn, now £597bn) has gone from a 4.4% increase over two years to a 5.5% increase; in real terms from a 1.2% contraction in the economy to growth of 0.7%. Still anaemic, but at least in positive territory.
Despite this small improvement in the economic story portrayed by the GDP statistics, we should not get too carried away. Economic growth remains well below the pre-financial crisis levels and the public finances are in a significantly worse state than they were back in 2008.
In the meantime, the Office for Statistics Regulation has commenced a review into how these small revisions with big implications for our understanding of the economy were not identified at the time.
Further reading
Latest charts
Recommended content
ICAEW Community

Public Sector Community
The go-to place for guidance on issues affecting finance professionals working in and with the public sector. With a range of dynamic services, ICAEW provides valuable tools, resources and support tailored to the public sector.
Resource

More economic insight
ICAEW works with Oxford Economics to provide useful insight and timely intelligence for finance professionals and their clients.
Read moreResource

Energy crisis hub
Analysis of how supply difficulties, rising electricity prices and sanctions against Russia are contributing to turmoil in energy markets. Find out what business can do to lessen the impact.
Find out more