
Errors in data
Many spreadsheets include one or more tables of data. These tables often provide the raw data that the rest of the spreadsheet relies on for its calculations and reports. Obviously, the accuracy of the underlying data will be crucial to the reliability of the spreadsheet’s results. Accordingly, as part of any review process, it will be essential to ensure the integrity of these tables of data.
Particularly since the introduction of Dynamic Arrays, it is possible to build checks and exception reports using standard Excel formulas, but it is also worth considering the use of Power Query as an easier and simpler option.
Column quality in a single click
As we have just mentioned, one of the advantages of using Power Query is simplicity. To build formulas to check all of the columns in a table for missing values or inconsistent data would involve a reasonable amount of both effort and expertise. Something similar can be achieved using Power Query with a single click.
Here we have an Excel Table containing data that we are going to use as the basis for our spreadsheet calculations. With any cell in our Table selected, we can click on the From Table/Range command in the Get & Transform Data group of the Data Ribbon tab to open our data in the Power Query editor. A small bar at the top of each column provides some basic information about the data in the column, showing empty items in black and errors in red:
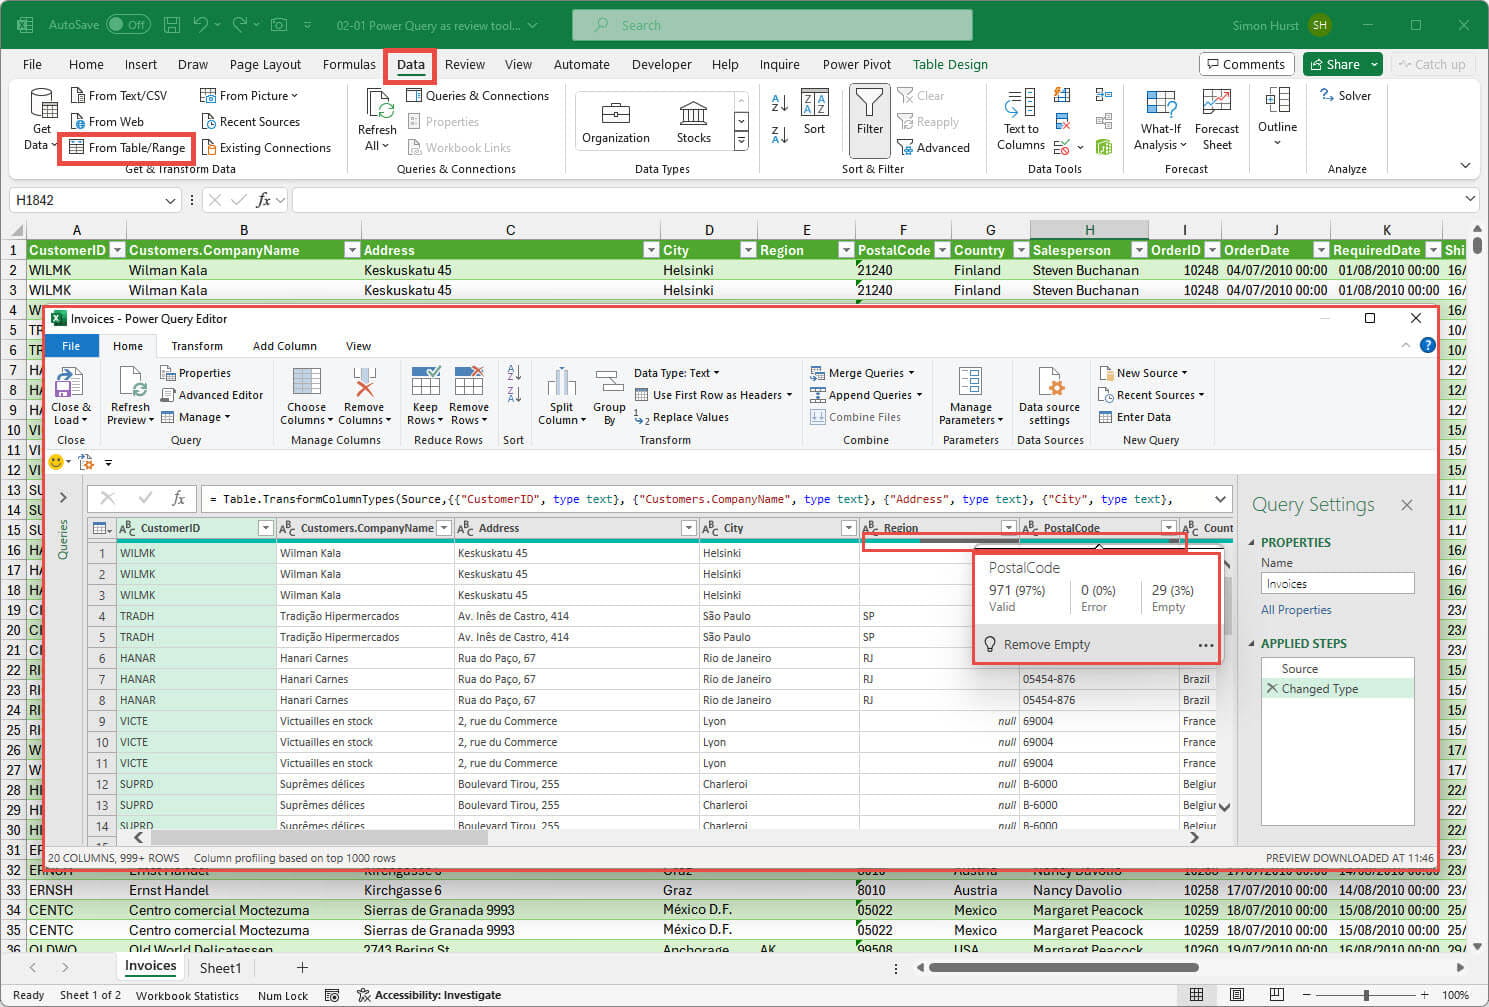
In this example, we can see that a significant number of our Region values are empty which might not be a problem, but there are also several missing Postcodes which might be more of an issue. We can hover the cursor over the bar itself to see more information about the column values’ This shows that, in this case, there are 29 rows with empty postcodes.
Beware 1
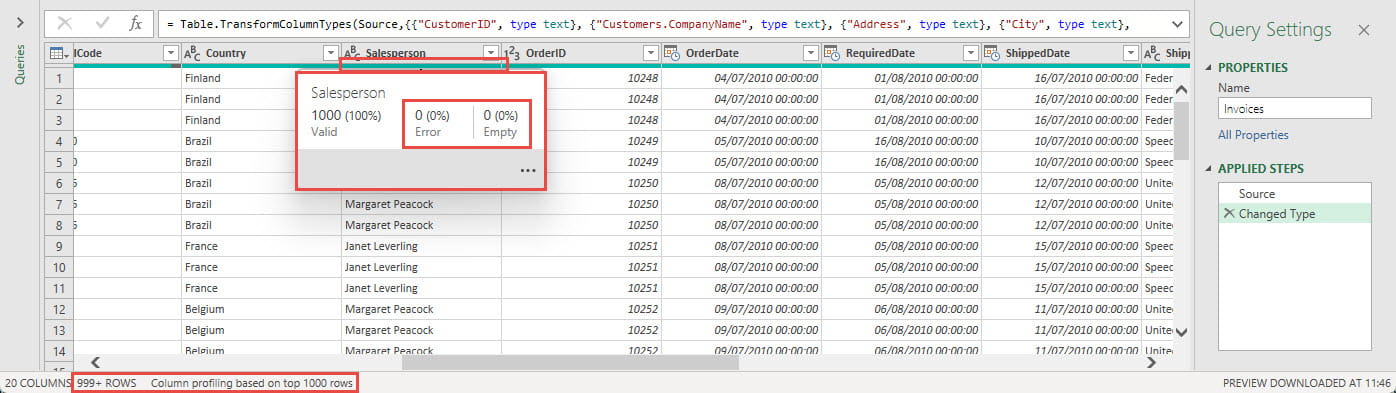
Here, we are looking a bit more closely at the Salesperson column. It appears that there are no errors or empty values. However, if we look at the Status bar at the bottom of the editor screen, we can see that it states that there are more than 999 rows in the data and that ‘Column profiling [is] based on top 1000 rows’:
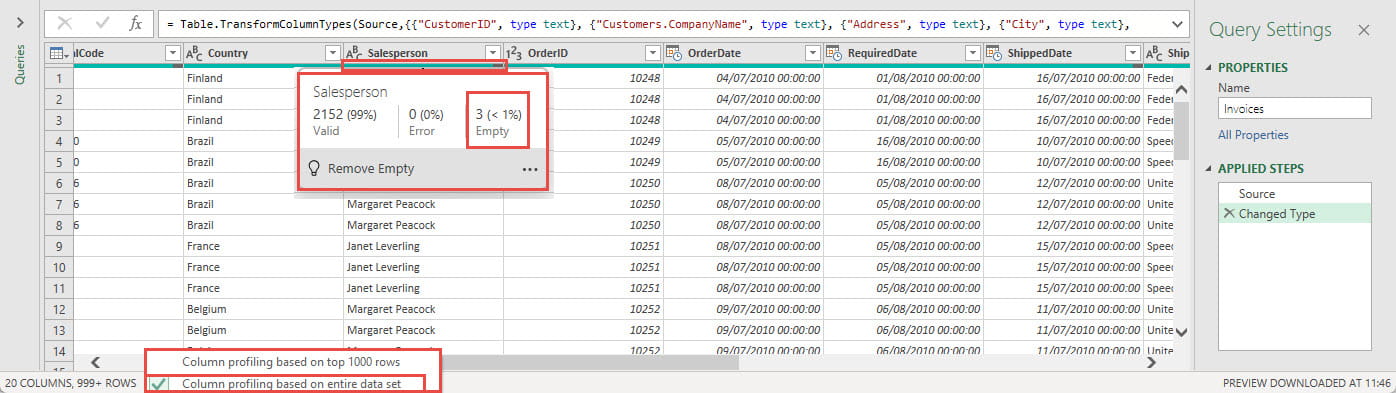
It is possible to click on the warning itself to change this to ensure that: ‘Column profiling [is] based on entire data set’. The column bar now shows a small black area and hovering over the bar shows that 3 rows contain empty values for Salesperson.
Additional column statistics
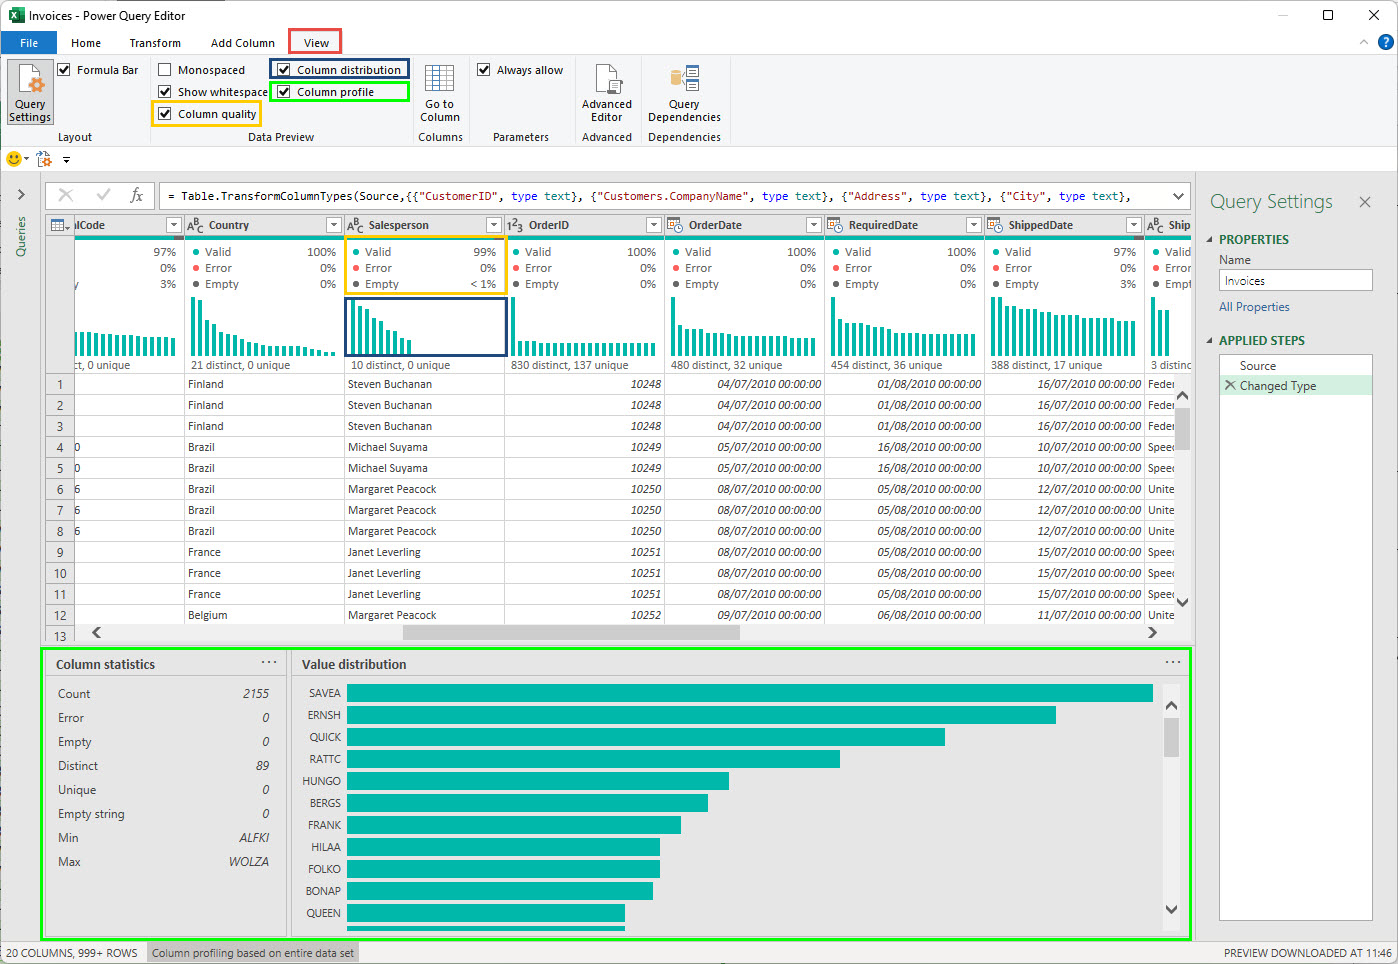
Useful as the column bar might be, it is a relatively subtle indication that is easy to miss. It is possible to make the existing warning more obvious, and to show additional information, by selecting further options in the View Ribbon tab, Data Preview group:
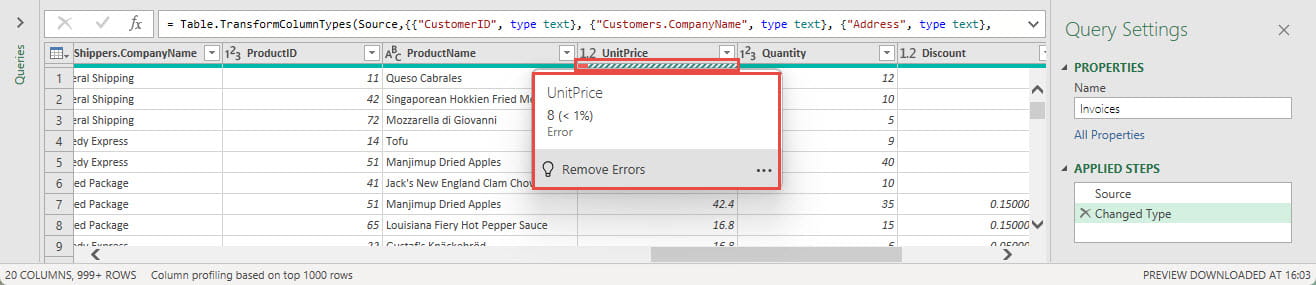
Useful as these techniques can be, you do need to be careful when using Power Query as a check on invalid data within a column. By default, Power Query will automatically scan the contents of a column and decide on its data type, it will then create an automatic ‘Changed Type’ step that will convert the column data to the chosen data type.
Here, we see some errors in our UnitPrice column because eight values have been entered as text, so cannot be converted to numbers in the Changed Type step:
Beware 2
Useful as these techniques can be, you do need to be careful when using Power Query as a check on invalid data within a column. By default, Power Query will automatically scan the contents of a column and decide on its data type, it will then create an automatic ‘Changed Type’ step that will convert the column data to the chosen data type.
Here, we see some errors in our UnitPrice column because eight values have been entered as text, so cannot be converted to numbers in the Changed Type step:
This can be very useful to quickly identify inconsistent data in a large table, but it does depend on the nature of the inconsistency. The Power Query conversion attempt will not necessarily give the same result as an Excel formula would. For example, if some of our UnitPrice values had been entered, not just as text, but as numbers that used a comma, rather than a full stop, to indicate the decimal point, Excel would ignore them or generate a #VALUE! error if used in a calculation. In contrast, the Power Query ‘Changed Type’ step would recognise them and convert them to an integer value, ignoring the comma, rather than displaying any errors.
Conclusion
In the next part of the series, we will look in more detail at the tools we have considered so far, including methods that will help with the identification of issues with data types.
You can explore many of the various techniques we have covered here, and a great deal more, in the ICAEW archive.
Archive and Knowledge Base
This archive of Excel Community content from the ION platform will allow you to read the content of the articles but the functionality on the pages is limited. The ION search box, tags and navigation buttons on the archived pages will not work. Pages will load more slowly than a live website. You may be able to follow links to other articles but if this does not work, please return to the archive search. You can also search our Knowledge Base for access to all articles, new and archived, organised by topic.
