
Errors in data
We started last time by using Power Query to quickly reveal some key information about the contents of columns in a table of data. After initially just using the simple bar at the top of each column displayed in the Power Query editor to check for missing values and potential errors, we moved on to displaying a more detailed analysis of column contents using the Column quality, Column distribution and Column profile options in the Power Query Editor, View Ribbon tab, Data Preview group.
Useful as these displays are, there would be advantages in being able to create a more permanent record of some, or all, of this information. A simple Power Query function helps us to do so.
It’s easier than it looks
Before we start, if you are new to using Power Query, the method we are about to set out might seem quite complicated. However, it’s worth bearing in mind that, apart from having to type in the Table.Profile function and its single argument, most of what follows can be accomplished with just a few clicks in the user interface. Also, once you have created the query that produces the profiles table for one table, you can very easily copy it and apply it to any other tables that you want to report on.
Table.Profile
The Table.Profile function takes any Power Query table name as an argument and creates a table of summary information about each column within that table. In order to make use of Table.Profile to create our report, we need to create a new blank query and then use the Table.Profile function as its source.
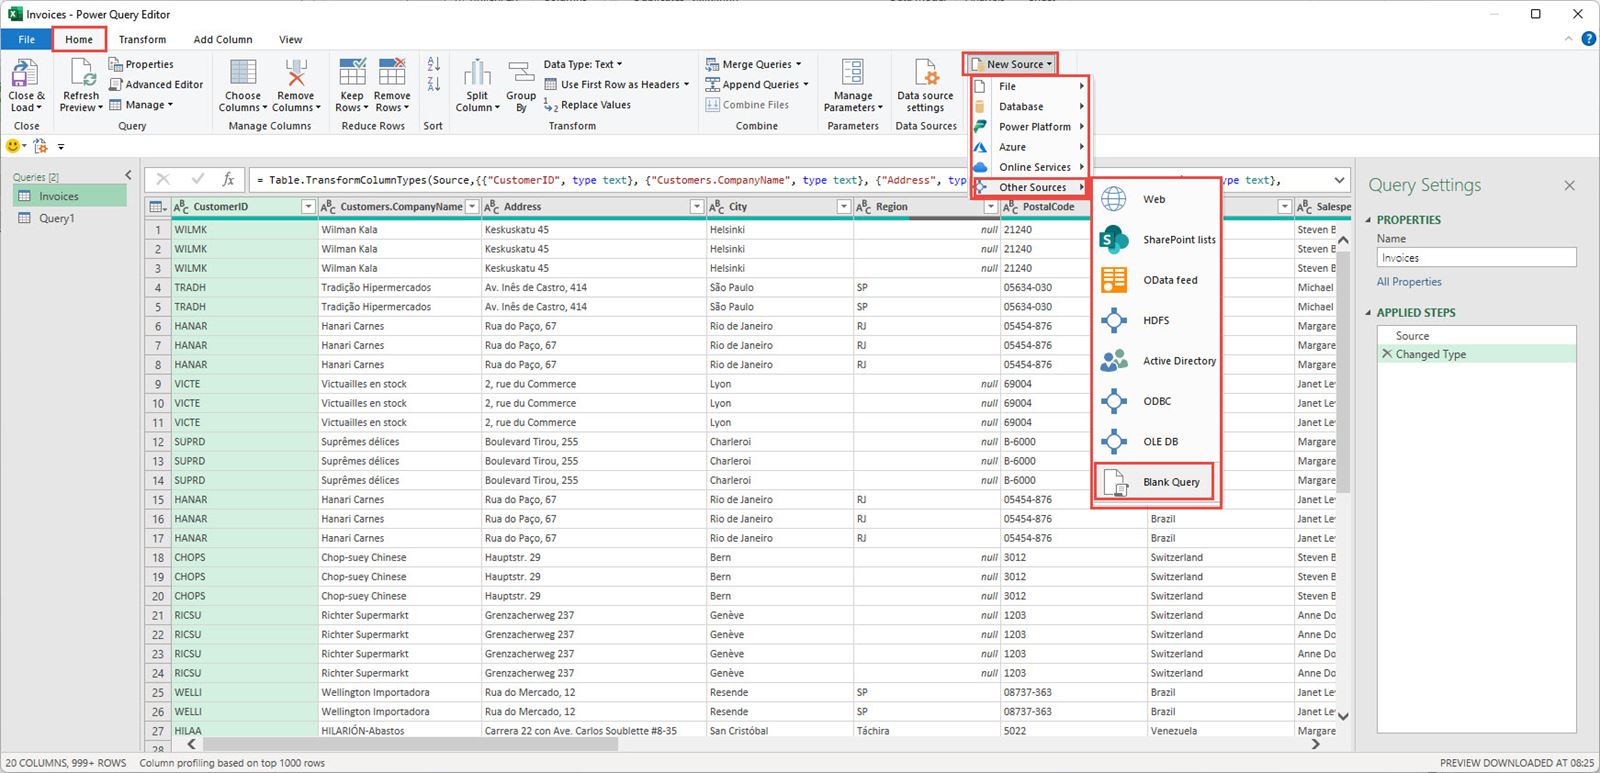
We start by creating the blank query. We can do this by using Home Ribbon tab, New Query group, New Source dropdown, Other Sources, Blank Query:
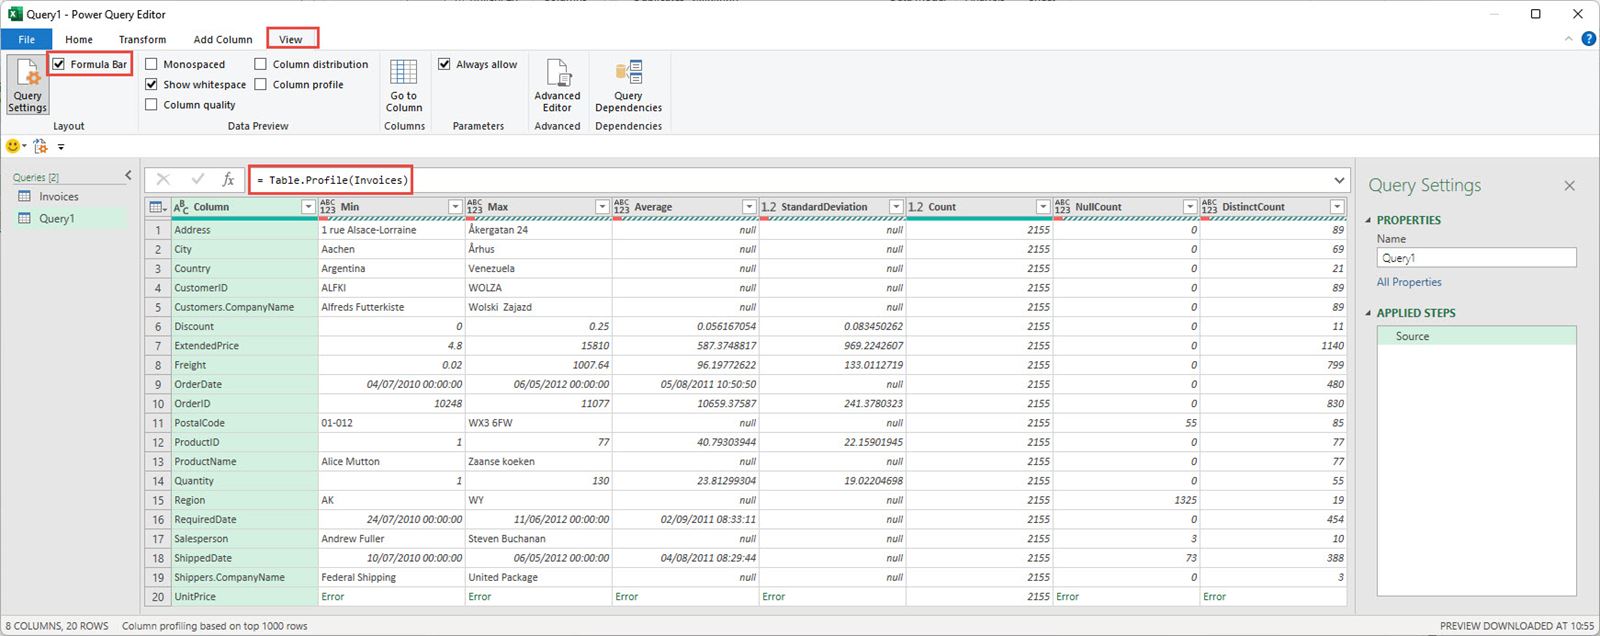
Our empty query is created for us, ready to type our function into the Formula bar. If this bar is not displayed, it can be turned on using the option in the View Ribbon tab, Layout group. We just type our function name followed by the table name in brackets:
=Table.Profile(Invoices)
As we start typing in the function name, the Power Query editor will prompt with names of matching functions. As long as we haven’t typed in more than the work ‘Table’ we can scroll through to select Table.Profile from the AutoComplete list. However, once the full stop after Table has been entered, choosing the function name from this list will duplicate the word Table:
TableTable.Profile
Similarly, once we start typing in the name of the table to use as our argument, the AutoComplete list will include matching tables:
Note that Power Query requires the use of correct text case, so entering table.profile rather than Table.Profile, or even Table.Profile(invoices), rather than Table.Profile(Invoices), would generate an error.
Once entered correctly, our single formula will display a summary of each column of our table showing as separate columns the Minimum, Maximum, Average and Standard Deviation aggregations as well as the Count of items, the Count of null items and the DistinctCount showing the number of different items in the column. As mentioned before, it would be very quick and easy to right-click on the query in the left-hand side Queries pane, choose to Duplicate it, and then just change the argument to the name of any other table that we wanted to create a report for in this way.
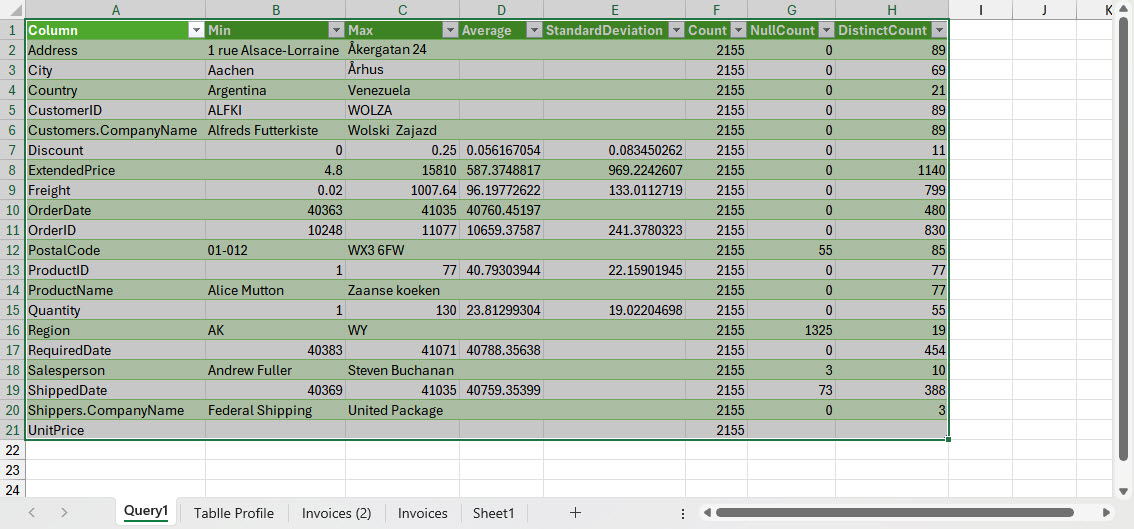
Once we have created our query based on the Table.Profile function, we can use the Home Ribbon tab, Close & Load command to load this into our workbook as a permanent record that can be refreshed as required to cope with updated data in the relevant table:
Conclusion
As useful as the summary report might be, it would make it easier to check and review the details if it were to be rearranged into columns and positioned above the original Table of data. In the next part of this series, we will look at how this could be achieved.
You can explore many of the various techniques we have covered here, and a great deal more, in the ICAEW archive
Archive and Knowledge Base
This archive of Excel Community content from the ION platform will allow you to read the content of the articles but the functionality on the pages is limited. The ION search box, tags and navigation buttons on the archived pages will not work. Pages will load more slowly than a live website. You may be able to follow links to other articles but if this does not work, please return to the archive search. You can also search our Knowledge Base for access to all articles, new and archived, organised by topic.
