
Welcome back to Excel Tips and Tricks! This time, we have a Basic level post exploring some simple tips and tricks for formatting your data to maximise its impact.
Even the most seasoned Excel user can sometimes forget that spreadsheets are a tool for communicating information, and that can be done most effectively by giving a little thought to presenting and formatting data. In this article we outline 3 simple tips that can help you present your data in a way that is clear and easily understandable.
Tip 1 - Put a title on your spreadsheet
This may sound blindingly obvious, but it is very easy to launch straight into a spreadsheet and start plugging numbers in without any title or description.
Here is an example of some tabular data that has been hastily exported into a spreadsheet.
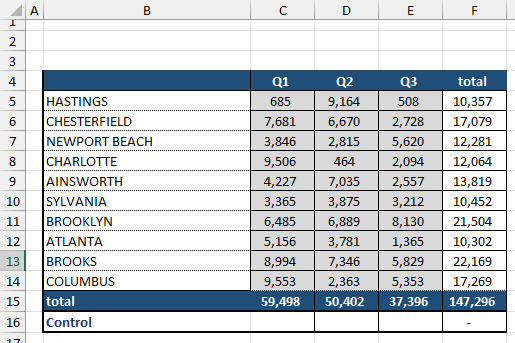
We could probably take a guess as to what these numbers represent. But let’s be professional and add a title before we do anything else!
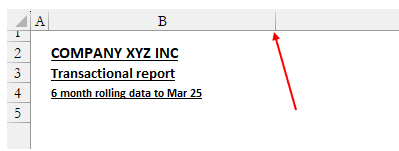
Bonus Tip: consider spreading the title over multiple lines in decreasing order of generality. For example:
First line – the overall project this relates to
Second line – the type of data being considered
Third line – specific parameters e.g. date range
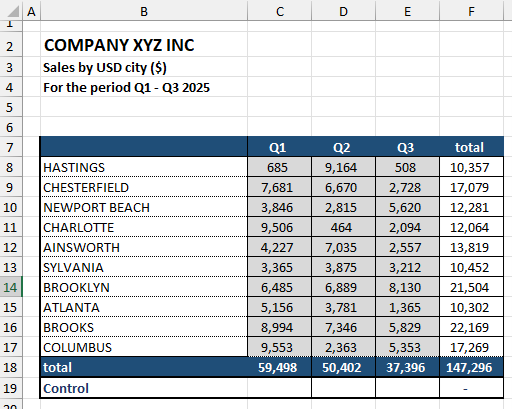
Not only does this look more professional, but we have removed the potential for confusion later when we need to refer to this data.
Tip 2 - Use blank spaces and colours
Visual techniques such as using blank spaces between sections and applying colours can help quickly train the eye to the overall layout of the spreadsheet.
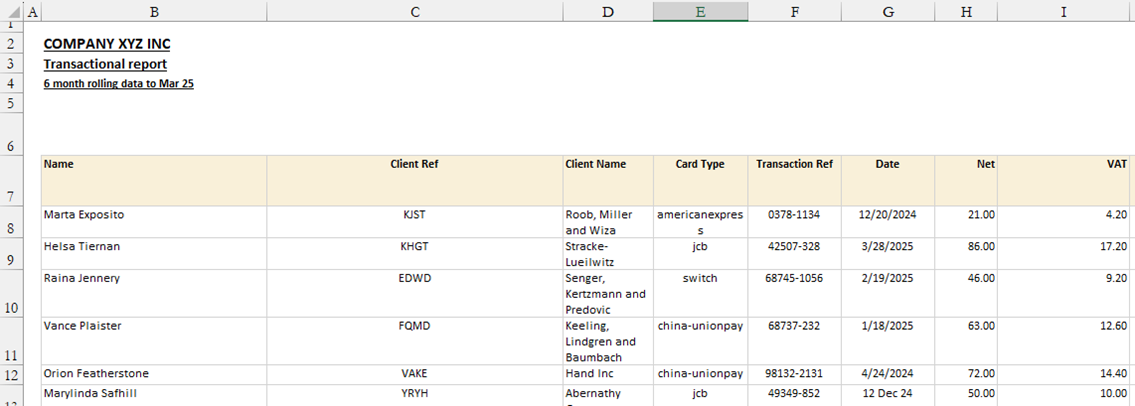
Here is a report showing a summary of data reported on an Excel sheet.
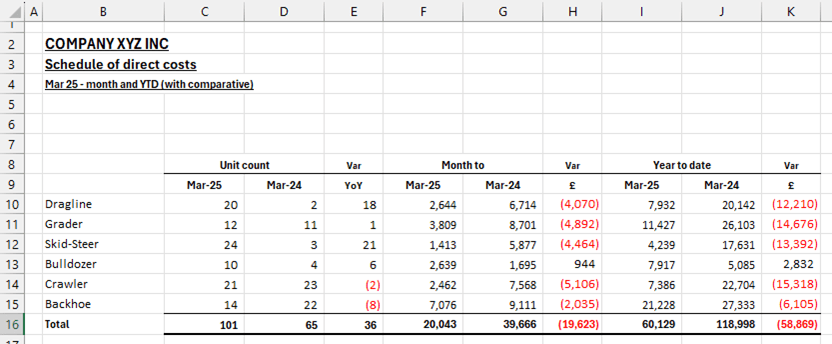
Let’s put some blank rows and columns between the sections and apply some colour formatting.
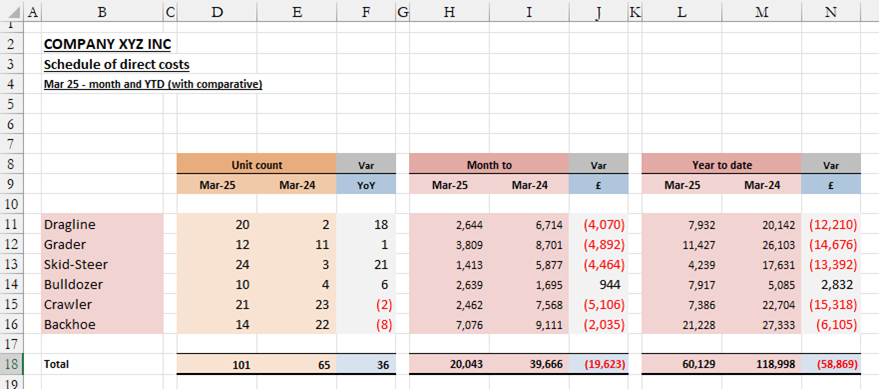
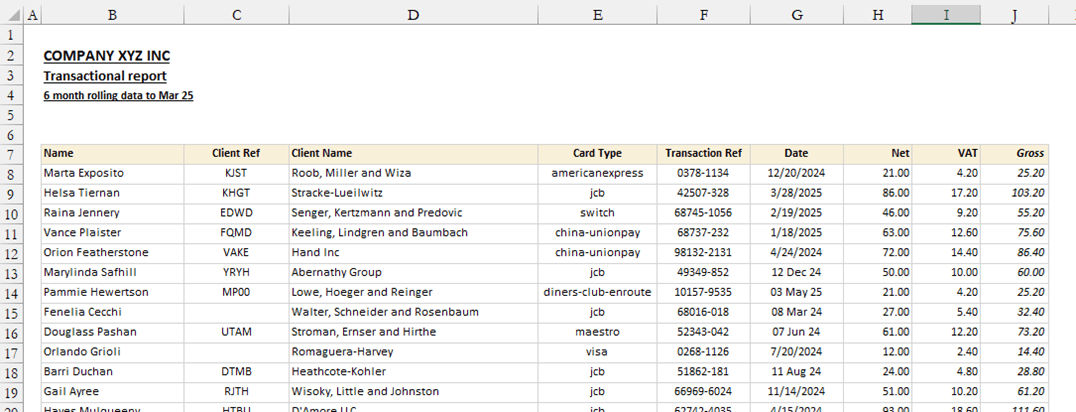
Now the different sections immediately snap into focus. It is far less work to interpret the overall shape and layout of the data, and this saved mental effort can go into interpreting and understanding the data!
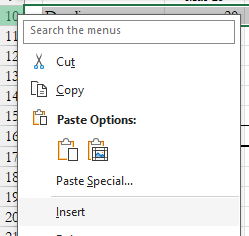
Reminder: blank rows can be inserted by right clicking the row number below where you want to insert the new row and clicking insert (a similar process works for inserting new columns).
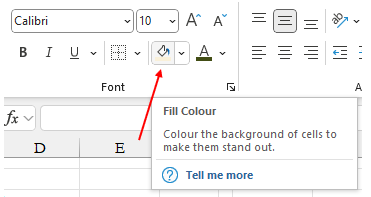
Cell background colours can be changed by selecting the Fill Colour icon from the Font section on the Excel Ribbon.
Tip 3 – Resize rows and columns
Row heights and column widths create a huge impact on the readability of data.
Here is some tabular data that has been exported into Excel.
With a few quick adjustments we now have data that sits comfortably in the grid. The information is now in a format that is much easier to read, and with a consistent format we can more easily spot any outliers or anomalies in the data.
Reminder: column widths can be adjusted by hovering the mouse pointer over the divider between column letters and dragging to the desired width.
Bonus tip: have one (and only one!) calculation, schedule, report, table or thing in each worksheet. Whatever it is, fix your row heights and columns widths to allow you to best present that one thing. Anything else needs to go in another sheet!
Beautiful spreadsheets have more impact
Don’t underestimate the power of a few simple formatting tricks to aid understandability when preparing data in Excel. The tips above can help ensure that your data is communicated clearly and others can quickly obtain and understand the information they need from your spreadsheet.
Archive and Knowledge Base
This archive of Excel Community content from the ION platform will allow you to read the content of the articles but the functionality on the pages is limited. The ION search box, tags and navigation buttons on the archived pages will not work. Pages will load more slowly than a live website. You may be able to follow links to other articles but if this does not work, please return to the archive search. You can also search our Knowledge Base for access to all articles, new and archived, organised by topic.
