
When working with data from text files it is often necessary to split a single column into multiple columns, or even rows. For example, an account code might encompass several components such as account type, department and detailed analysis and, to allow the data to be summarised by each of these components, it will be necessary to separate each of them into their own columns.
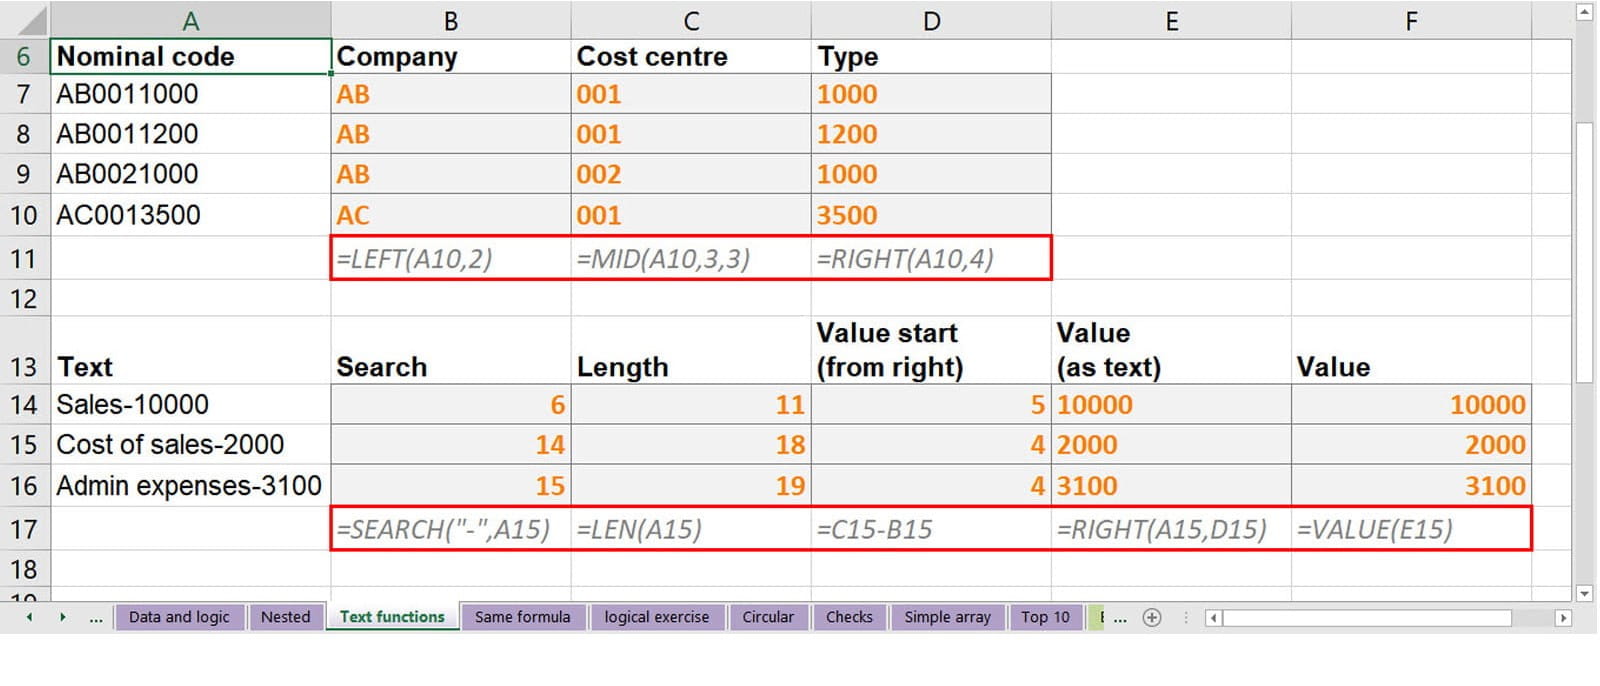
Excel has features and functions that can help with this. The LEFT(), MID() and RIGHT() text functions can extract a number of characters from the start, middle and end of a text string. Where the number of characters in each item in the column is consistent, then these functions can separate the components on their own. Where the number of characters is inconsistent, there will usually be one or more characters that operate as delimiters, showing where each element of the text ends and the next begins. In this case, the text functions above will need to be combined with FIND() or SEARCH(). Both of these functions locate the position of a specified character in the text string. FIND() is case-sensitive and SEARCH() is not. The resulting position is then used as one of the arguments of LEFT(), RIGHT() or MID() to extract the characters before or after the specified delimiter:
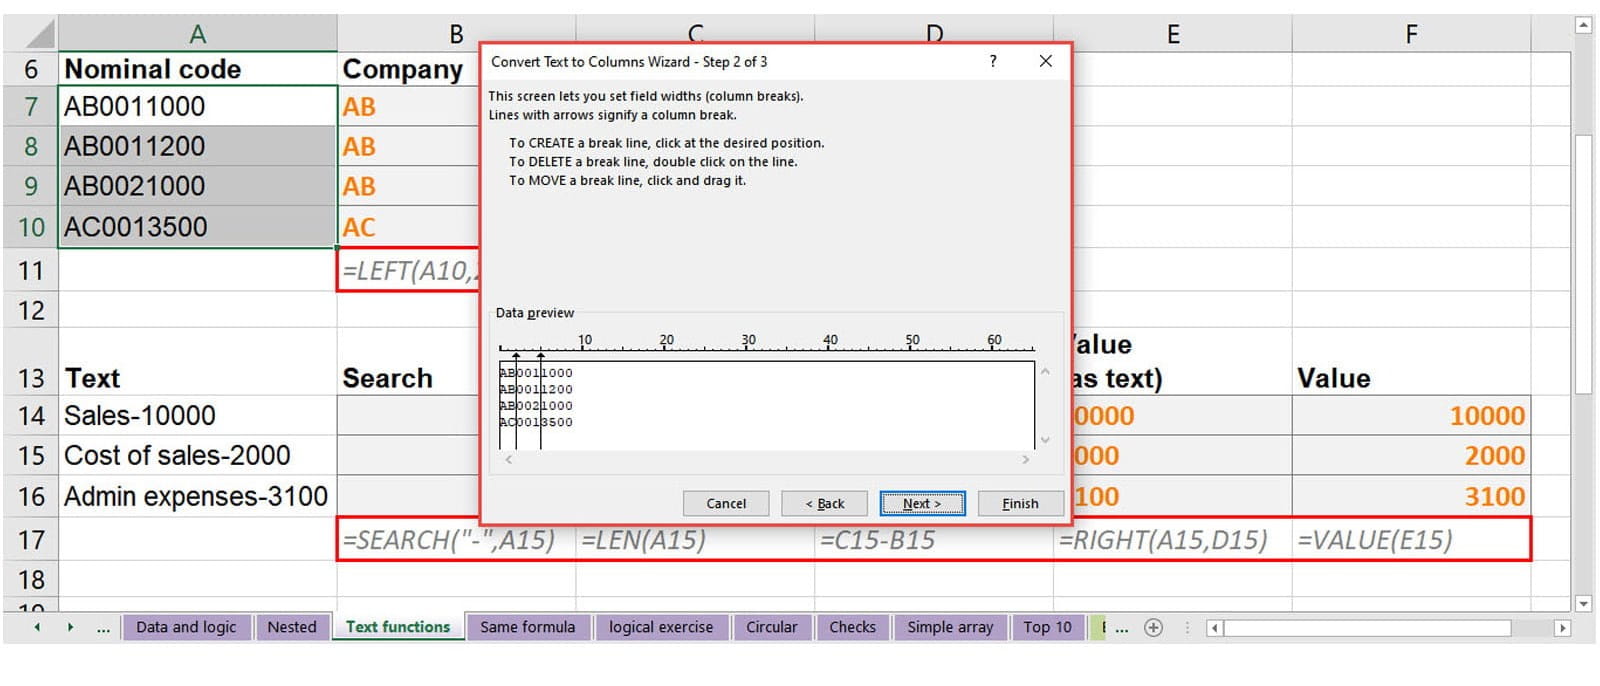
Where the requirement to split the column is a one-off, then, instead of using functions, it is possible to use the 'Convert Text to Columns Wizard'. The wizard is launched using the Text to Columns command in the Data Tools group of the Data Ribbon tab and works on the contents of the cells selected. Like the functions already described, it can cope with splitting text by position (Fixed width) or by Delimiter, with step 2 of the wizard providing detailed choices for each option:
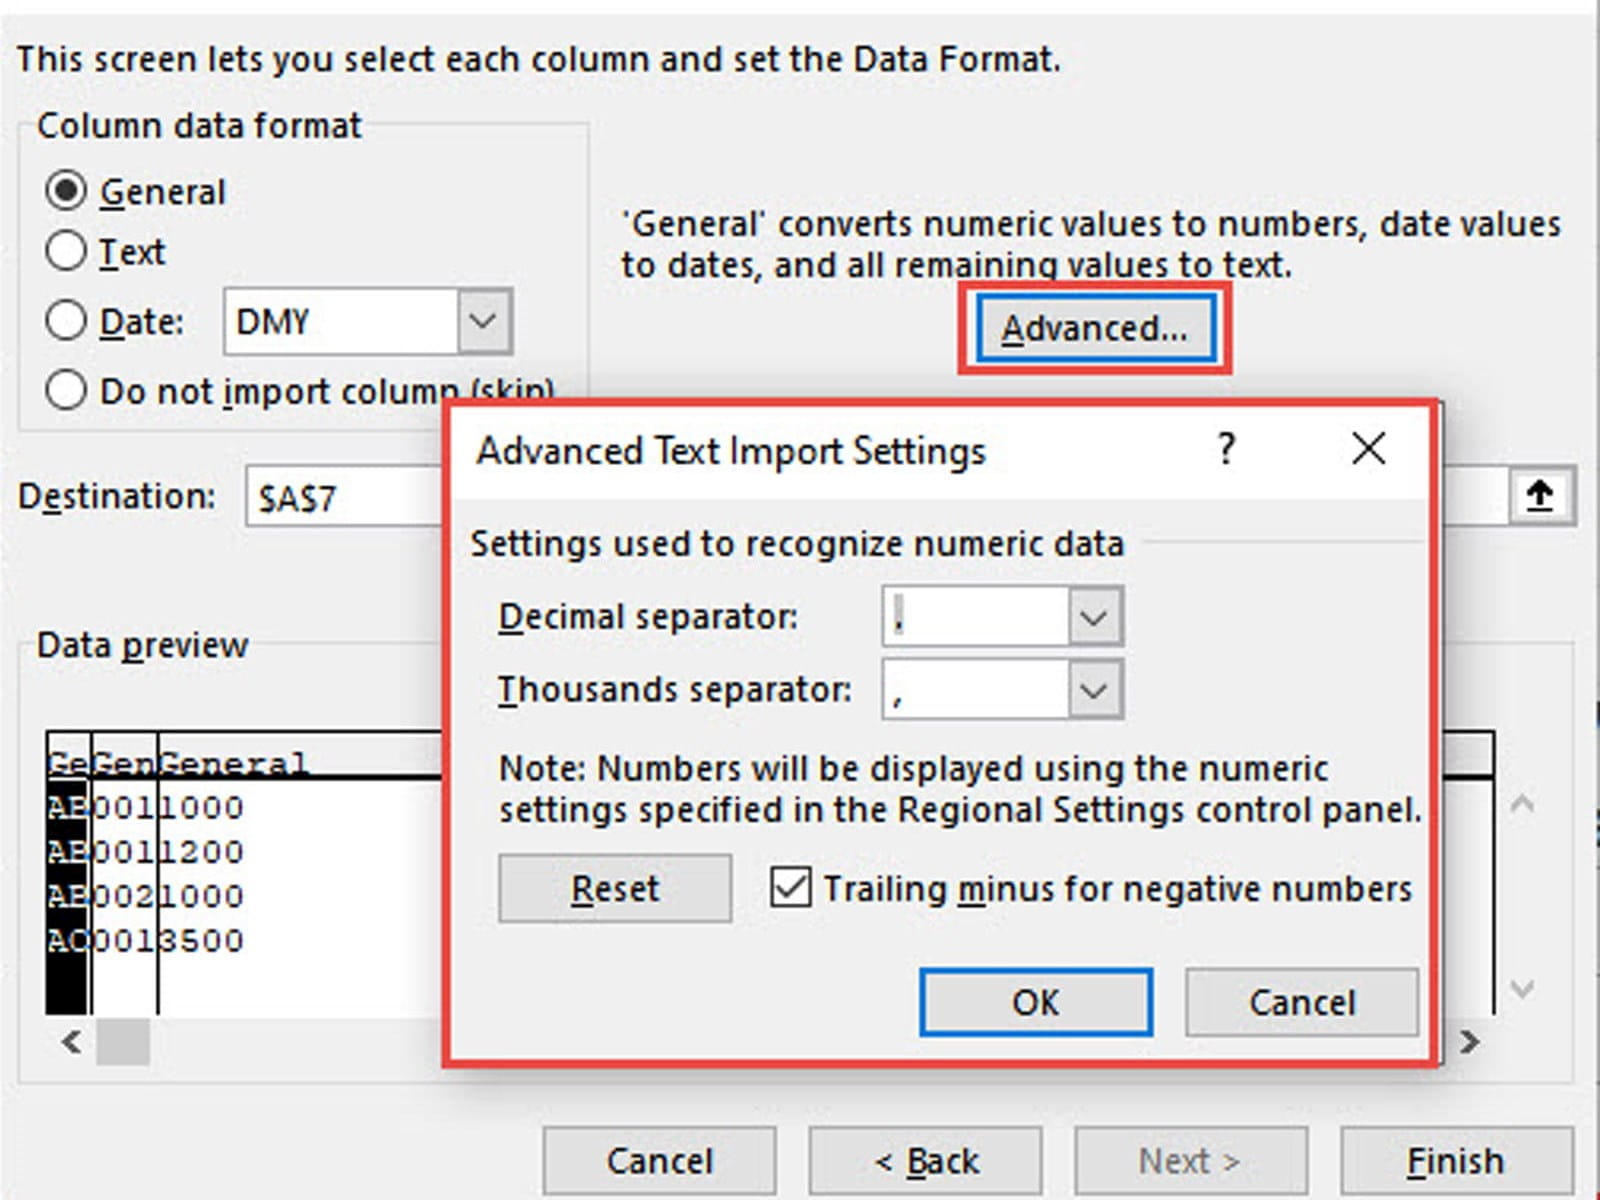
The third and final step of the wizard allows you to specify the type of data for each column, including advanced options for recognising numeric and date data:
It's worth noting that one of the most frequent uses of this wizard is not to split content into multiple columns at all, but instead to take a column of values that are being treated as text rather than numbers, and convert them to valid numbers in the same column.
As mentioned initially, the real drawback to Text to Columns is that it is a one-off operation that would need to be repeated whenever the data is changed or items are added.
The alternative to the use of these Excel functions and features is to use Power Query, which will not only make the process more automatic, but also cope with much more complicated requirements.
In the Power Query editor, the Split Column command in the Transform group of the Home Ribbon tab has the same overall options to split by position or delimiter as our Excel wizard, but also has additional operations available that will use the case of the characters, or the transition between text characters and digits as triggers for the split.
Not only are there additional top-level options but, for the main delimiter/position operations, advanced options extend the capabilities beyond those available in the Excel wizard. The delimiter can be set as a string of multiple characters, rather than just an individual character. It is also possible to specify how the presence of multiple delimiters should be dealt with: allowing a choice between using the leftmost, rightmost or each of the delimiters present.
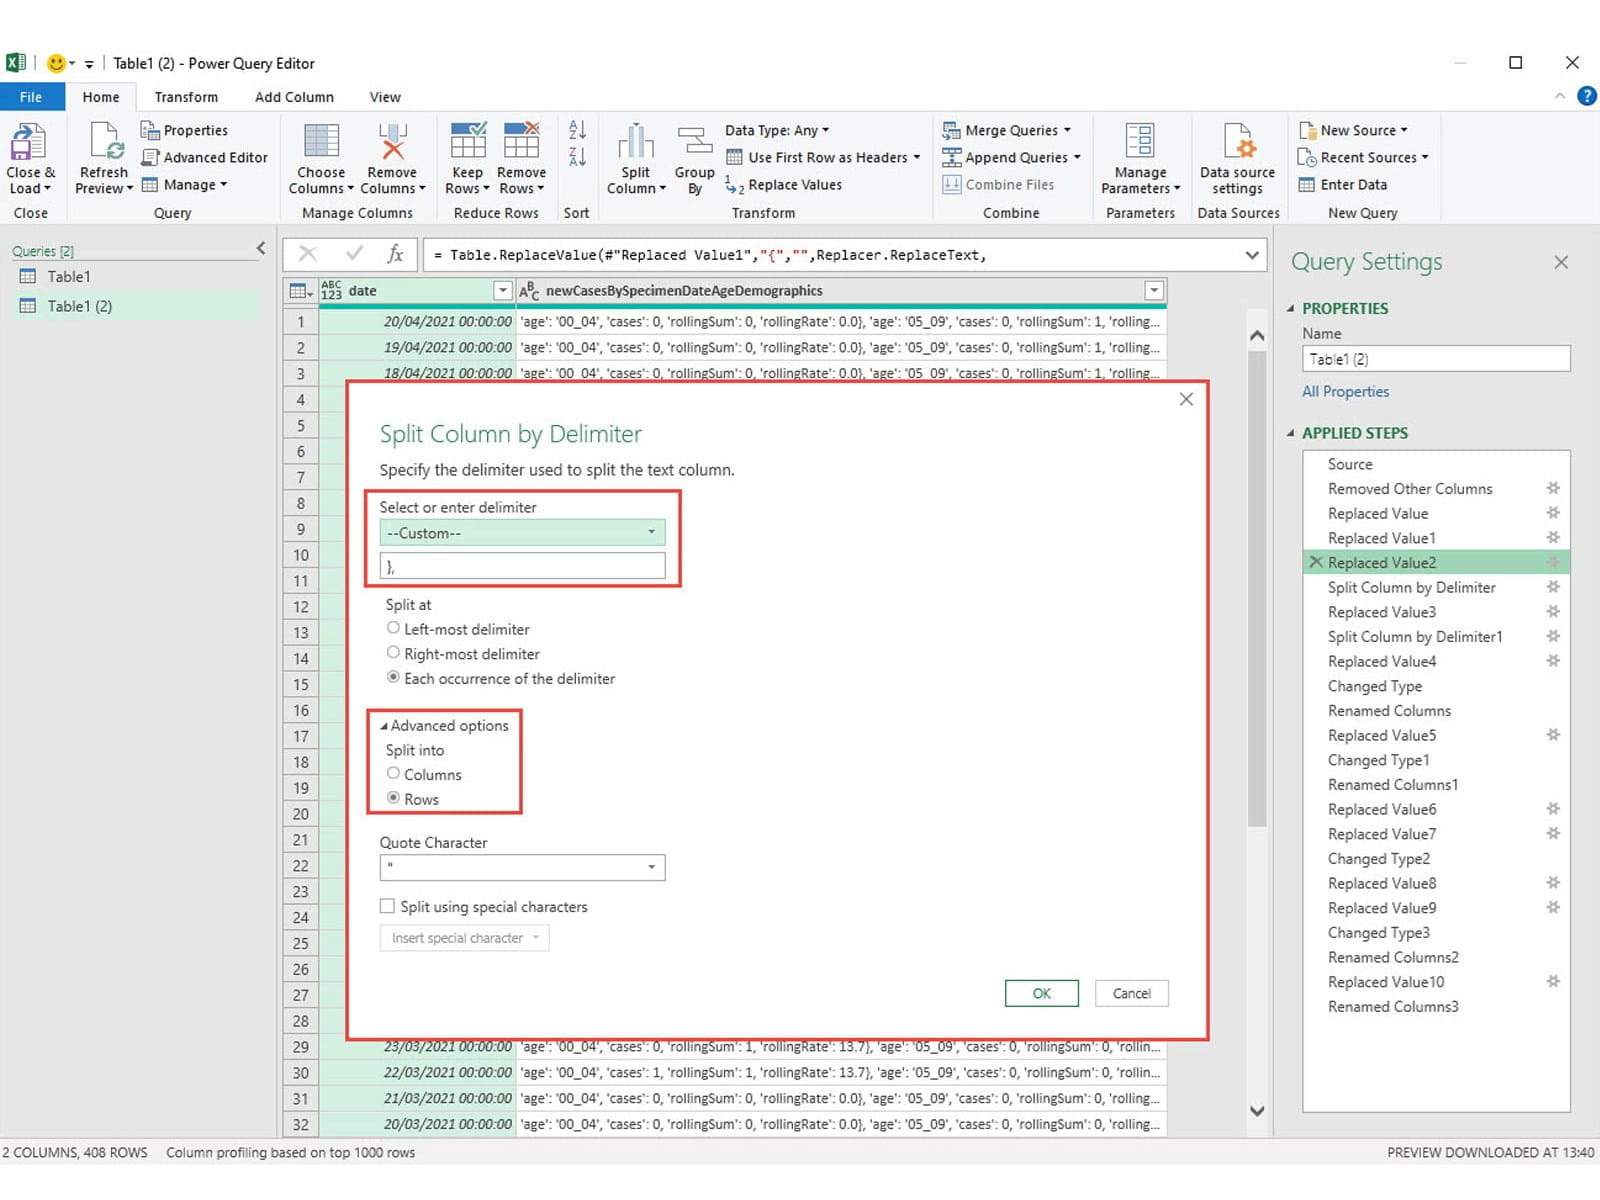
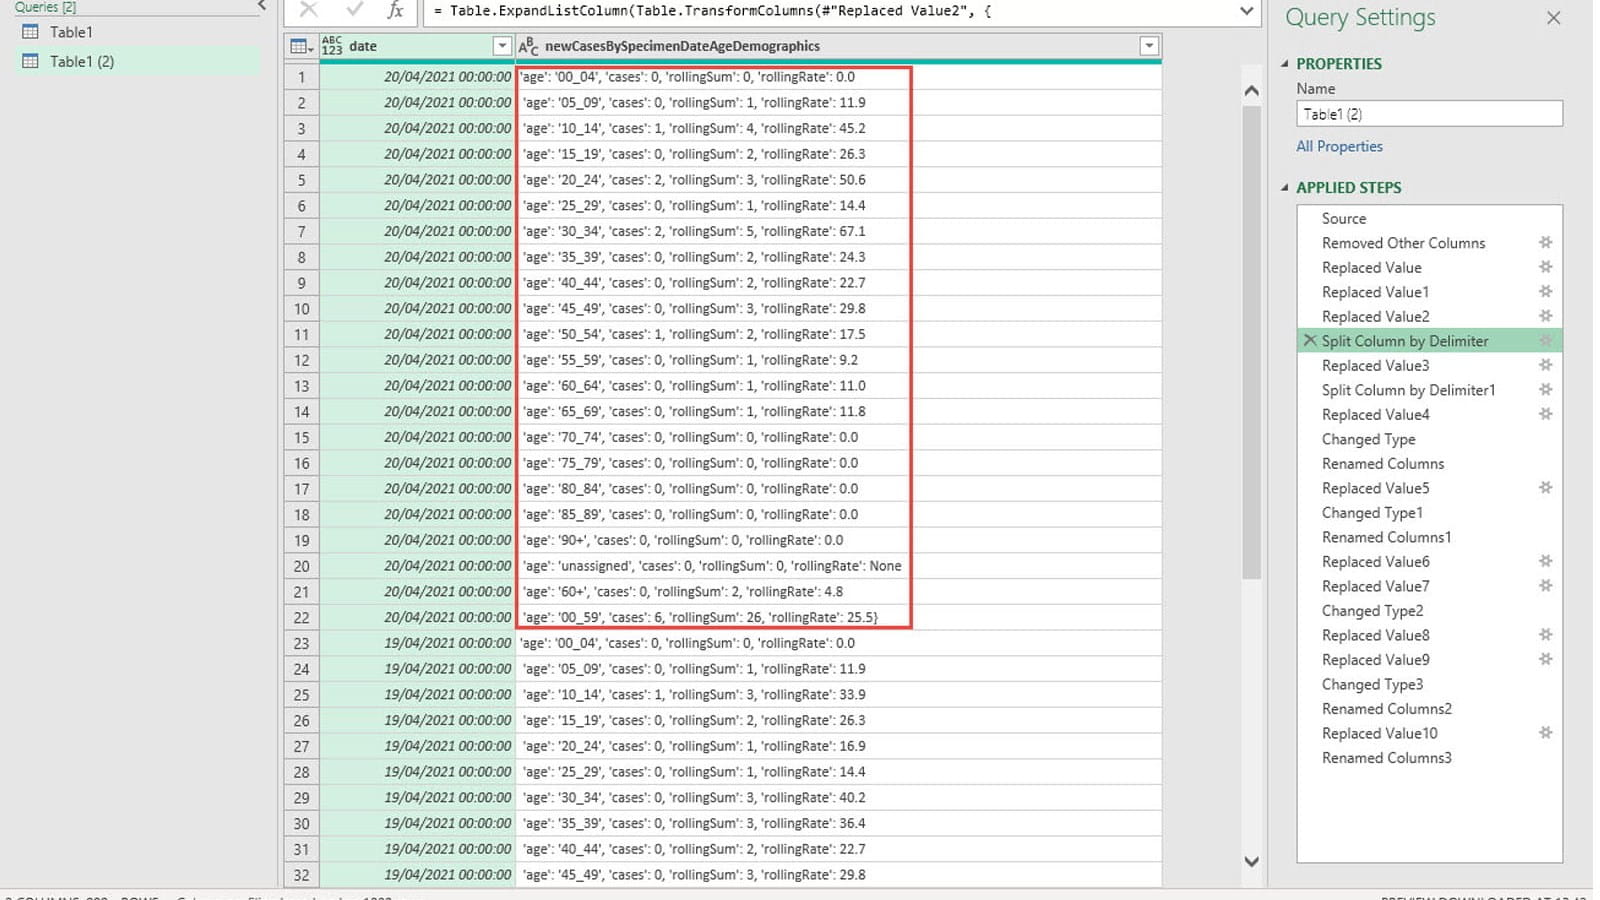
Perhaps one of the most significant advanced options is the ability to split to rows as well as to columns. Some text files can include groups of records on each row. Potentially, each of these groups could contain different numbers of items. This example comes from the UK government's coronavirus data pages and is one of the downloadable CSV files. This file shows the number of cases by age group for a chosen location:
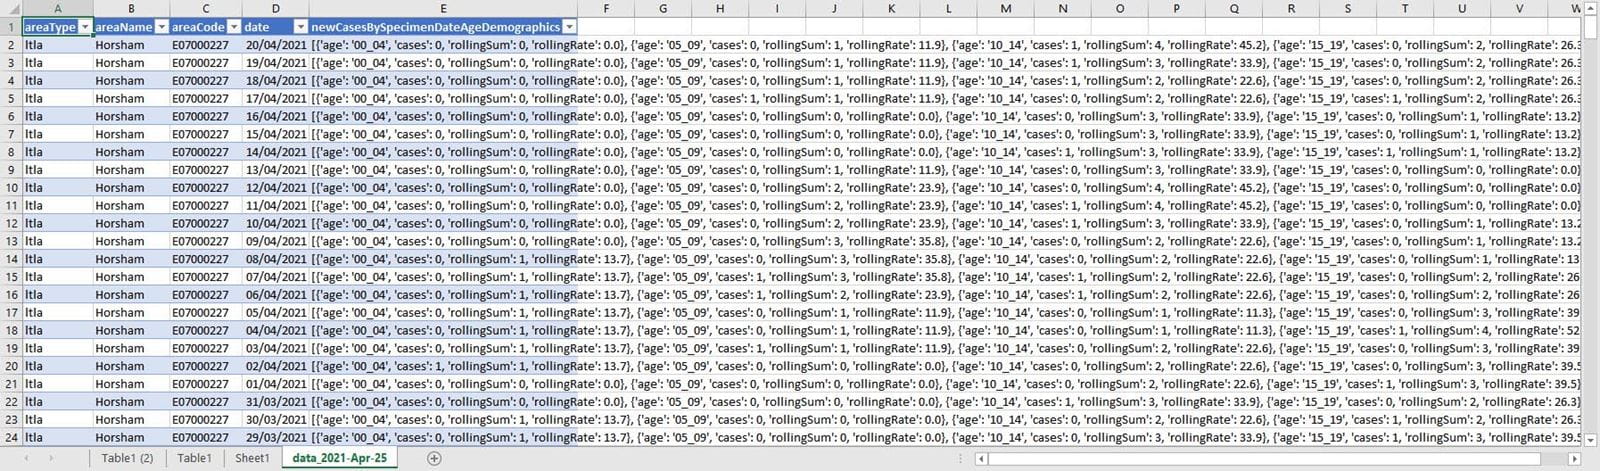
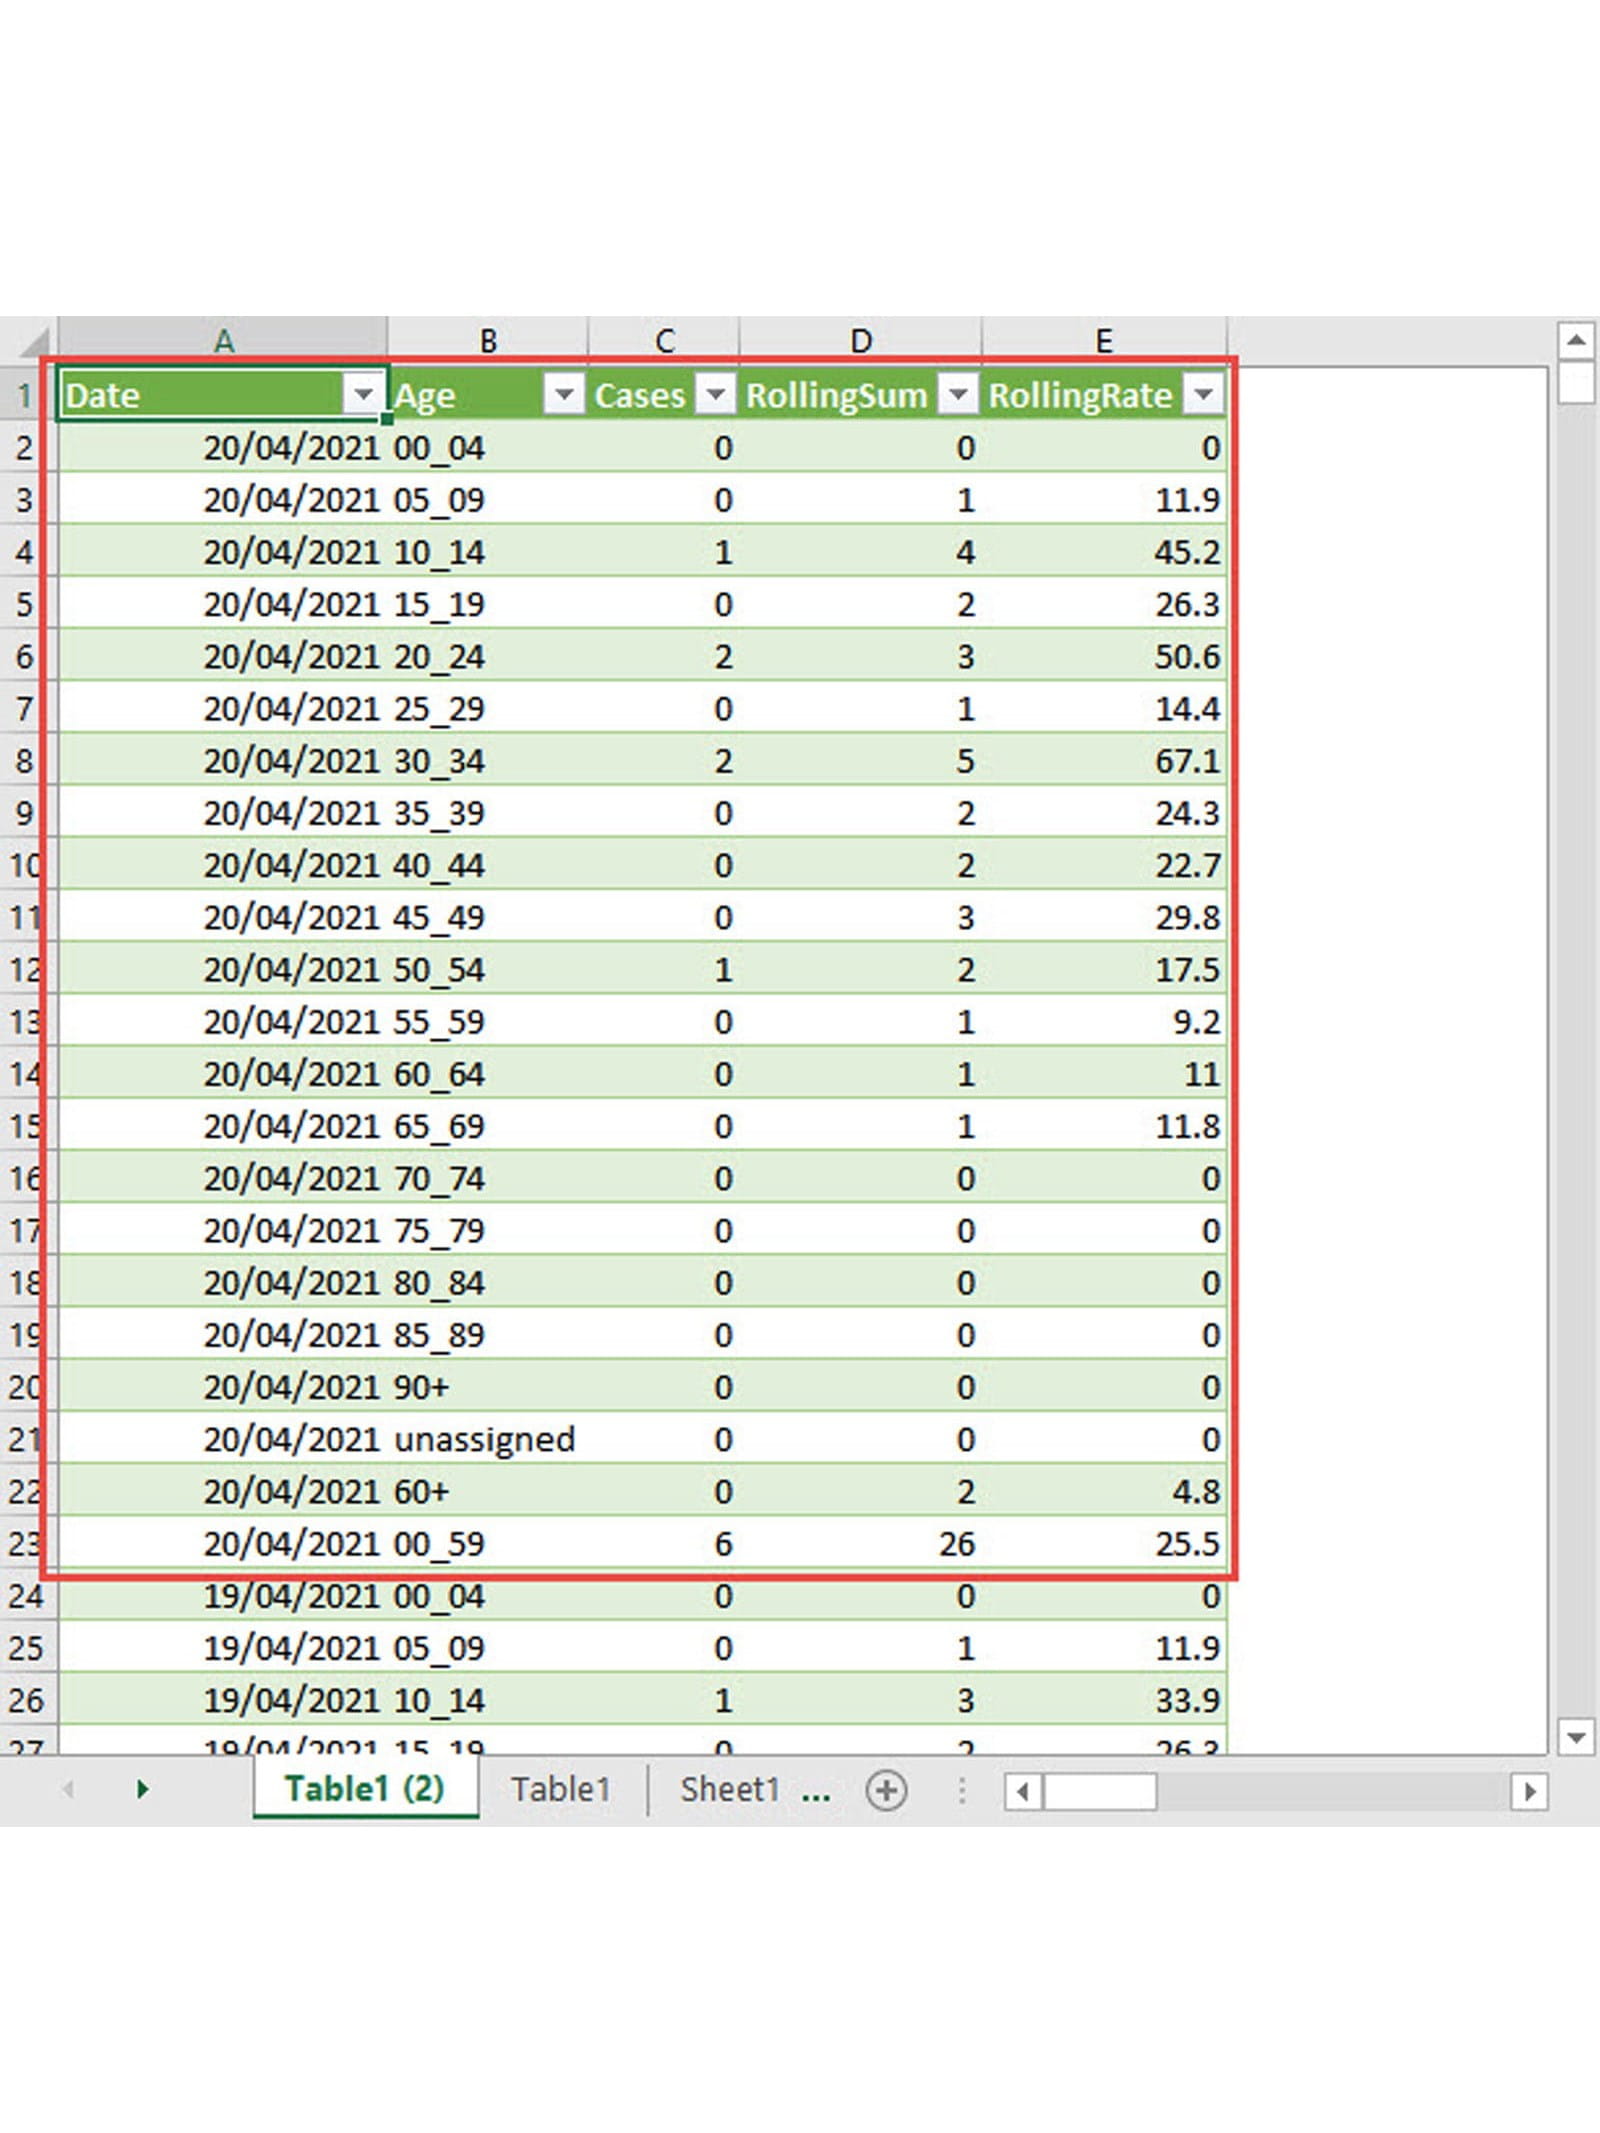
Columns A to D are straightforward, but column E contains a group of 4 values for each of 22 age bands. In order to be able to summarise the data using a PivotTable for example, you would need to transform the single column E into four separate columns for the age range label, the number of cases, the rolling sum and the rolling rate. You would also need to create 22 rows for each existing row to contain the records for each age band.
There are quite a few steps involved, mainly to delete characters that are not required, but the key step uses the ability to split the column not into other columns, but into rows. Each of our sets of 4 values ends with } followed by a comma, so we can set our delimiter as the two character string '},' and use the Advanced options to Split into Rows:
This achieves our objective of creating a row for each of our 22 age ranges, for each original row in our data:
We can then use the more usual approach of splitting our column to multiple columns to create our required data table. As well as the Split to Column operation, several other steps are needed to remove unwanted characters, change our column data types and rename our columns before loading the end result back to an Excel Table:
Incidentally, if you really wanted to carry out this operation using the Gov.uk data, it would be much better to choose the JSON data format than the CSV format – even if you know nothing about JSON. Not only is this format much easier to process as it is already organised as lists with tables, but you can link Power Query directly to the source file making it much easier to refresh as the data is updated.
On a similar subject to this post, on June 22nd a webinar will address how to use Power Query to address 10 everyday Excel problems:
Archive and Knowledge Base
This archive of Excel Community content from the ION platform will allow you to read the content of the articles but the functionality on the pages is limited. The ION search box, tags and navigation buttons on the archived pages will not work. Pages will load more slowly than a live website. You may be able to follow links to other articles but if this does not work, please return to the archive search. You can also search our Knowledge Base for access to all articles, new and archived, organised by topic.
