
For details of what this project is all about and how to develop your own version, please look at the Excel archive file article listed below:
The story so far:
Part 1 – from web page to Excel Table
Part 2 – from Excel Table to web page
Part 4 - charts and interactions
Part 5 – interactions between charts
Part 6 - additional visualisations
Spreadsheet Knowledge Base launches
Custom interactions
In part 6, we looked at the addition of two Word Cloud visualisations. Useful as they are, on smaller screens all but the most popular words can be difficult to see and even more difficult to select. To help address this issue and to complete our series, we have added a separate page our report to include just the Keyword Word Cloud and the Table of post titles and links.
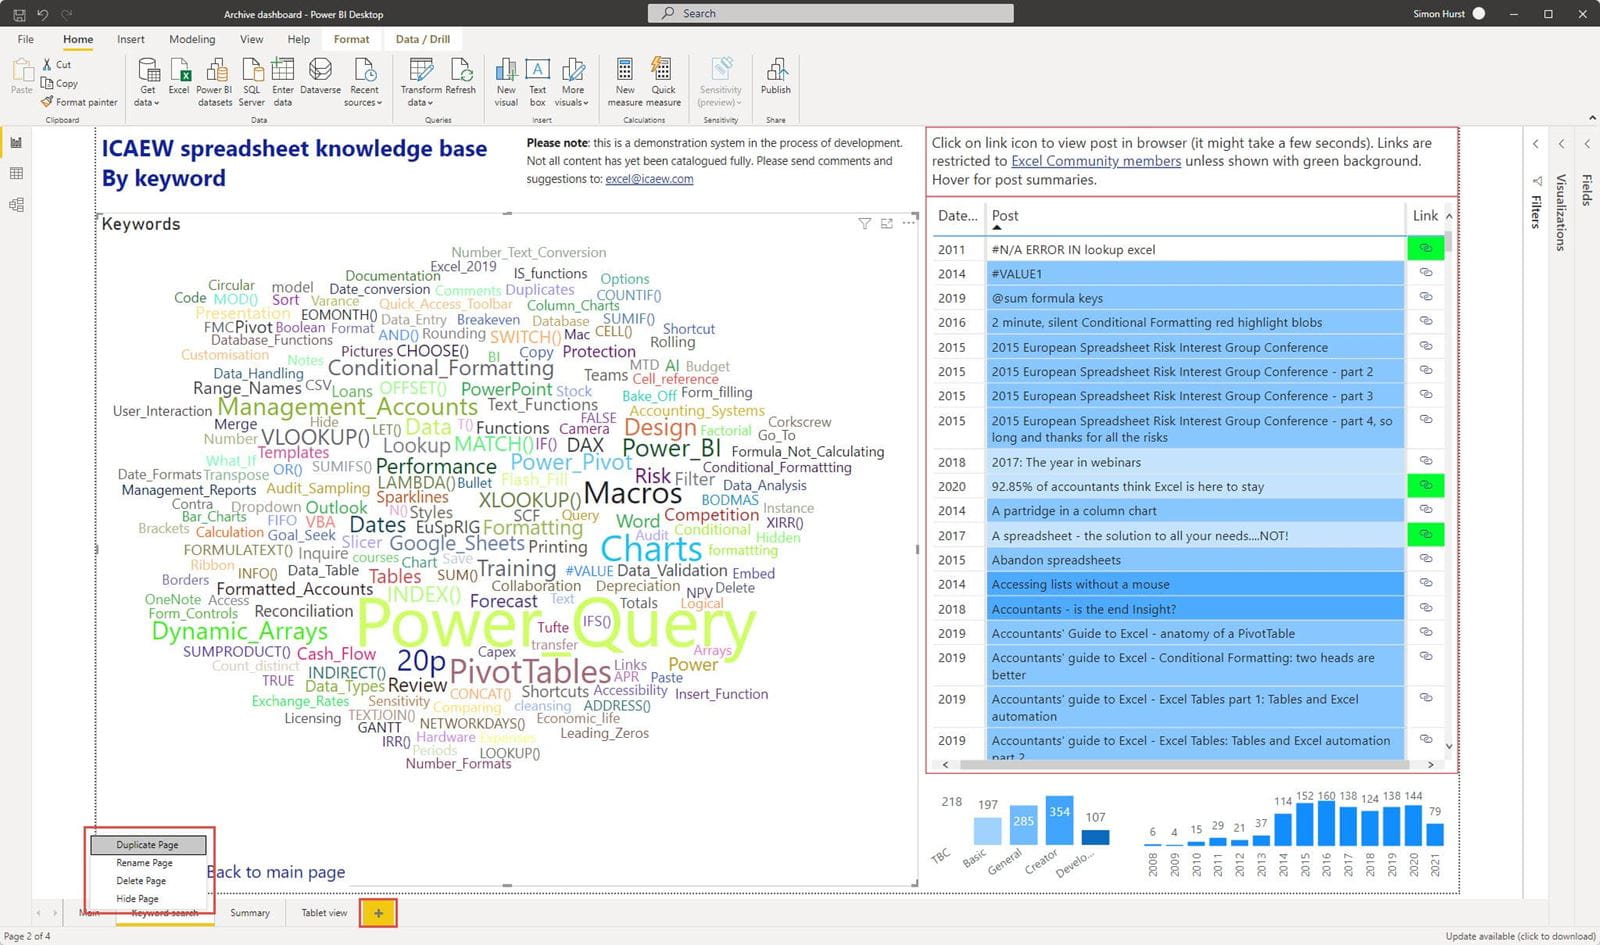
New pages can be created in a similar way to adding a new worksheet to an Excel workbook. Clicking the plus sign at the right of the existing list of pages will add a new page. However, in this case, our Keyword search page contains a subset of the visualisations included on our Main page. Accordingly, we will right-click on our Main page tab and choose Duplicate Page. This adds a copy of our Main page that we can rename and then edit.
To create the Keyword search page, we have deleted the visualisations that we don't need and then expanded the size of the Keyword Word Cloud:
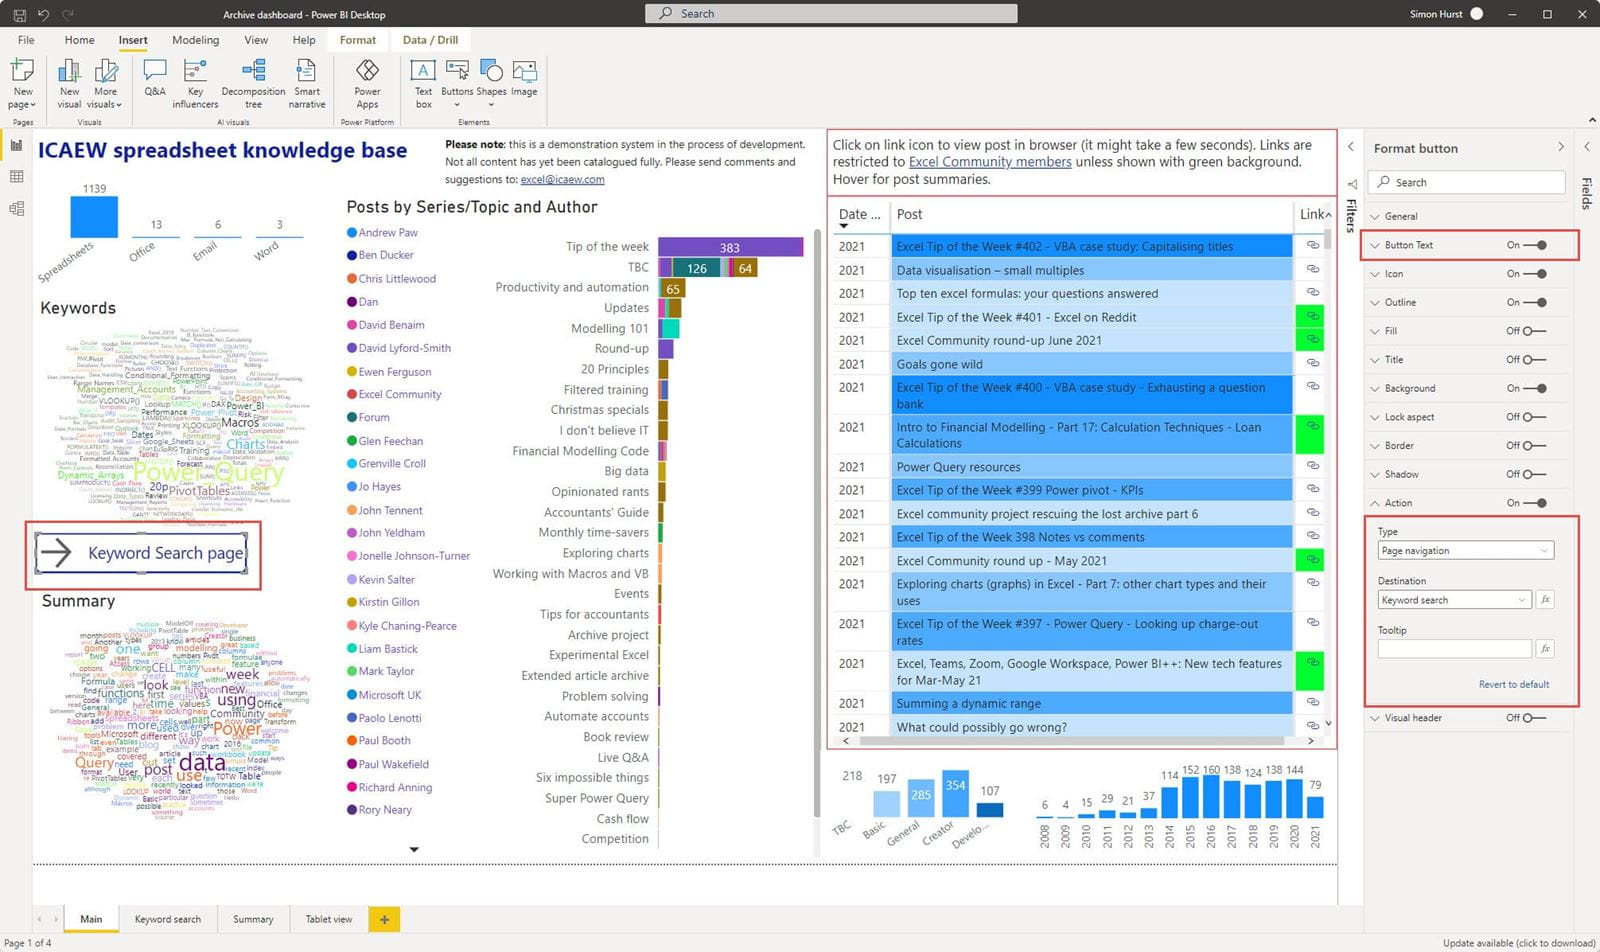
To make it more obvious that our Keyword search page exists, and to make it easier to navigate to and from the page, we have used the Insert Ribbon tab, Elements group, Buttons dropdown to add a button to our Main page to take us to the Keyword search page, and then a Back button on the Keyword search page to take us back.
With a button selected, the Visualizations pane changes to the Format button pane, and we can edit the appropriate sections. In this case, we have turned the Button Text on and entered the text as 'Keyword search page'. In the Action section we have chosen Page navigation from the Type dropdown and then entered the name of our page:
For the Back button on the Keyword search page itself, we choose the Type 'Back' and enter our text in the same way as for the button on our Main page.
Users can now navigate between the pages using these buttons as well as by using the Pages pane in the browser.
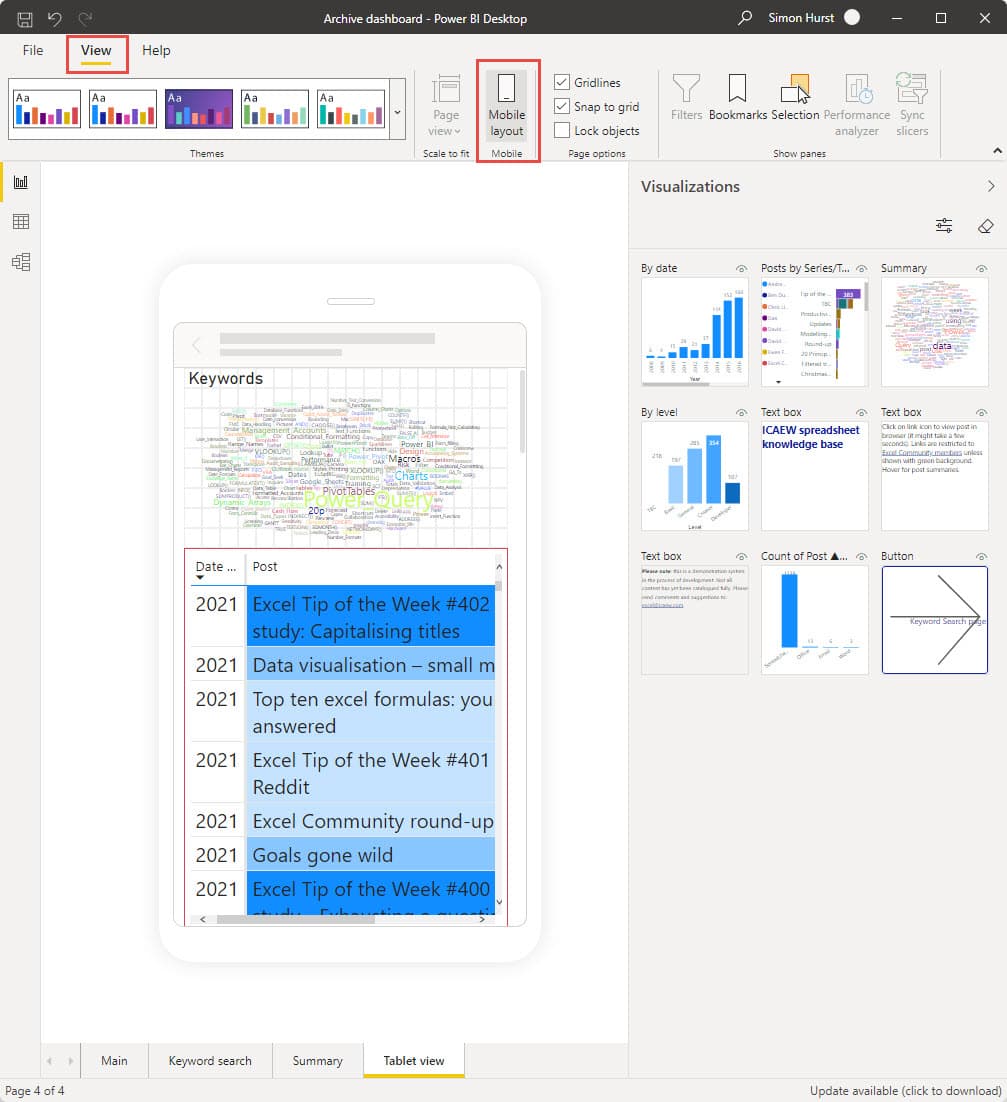
Mobile Layout
An alternative way to deal with the small screen issue is to use the View Ribbon tab, Mobile group, Mobile Layout button to create a page layout specifically designed to work on a mobile device:
Conclusion
Hopefully, you will have found this series useful in demonstrating some of the things that Power BI can be used to achieve. As a bonus, in so doing, we have created an interactive portal to the wealth of articles available to Tech Faculty and Excel Community members.
Resources and feedback
We have embedded the current stage of project development below:
The 'Open in full-screen mode' icon in the bottom right-hand corner of the embedded report should show the contents at a more readable size with the Escape key returning you to the post.
Further comments on useful ways in which we could provide access to the community content would still be very welcome:
Excel community
This article is brought to you by the Excel Community where you can find additional extended articles and webinar recordings on a variety of Excel related topics. In addition to live training events, Excel Community members have access to a full suite of online training modules from Excel with Business.

Archive and Knowledge Base
This archive of Excel Community content from the ION platform will allow you to read the content of the articles but the functionality on the pages is limited. The ION search box, tags and navigation buttons on the archived pages will not work. Pages will load more slowly than a live website. You may be able to follow links to other articles but if this does not work, please return to the archive search. You can also search our Knowledge Base for access to all articles, new and archived, organised by topic.
