Ever felt your business decisions are based on irrelevant or incomplete information? Jean Cunningham uses three case studies to illustrate how lean accounting can improve your decisions, whatever your industry.
A study reported several years ago in the Harvard Business Review concluded that 50% of executive decisions are made on intuition. Surely that is cause for alarm. Is business decision-making necessarily that much of an art? Are executives not well trained in the use of decision-making tools? Or is it that executives sense that their information and data is skewed for some reason, and so go on gut feel in order to arrive at a comfortable decision?
The following are three true stories to show how using lean accounting, rather than standard cost accounting, can lead to better decisions.
Case A: A ‘margin’ misjudgement
Manufacturing company A had purchased a large, new press. Its existing product base would use only 10% of the capacity of the new machine, so the sales force was asked to approach new customers to capture business that would utilise this press. After diligent efforts, the sales people returned to the corporate office with several new opportunities that would be manufactured using the new press. However, they were soon told the orders would not be accepted. What happened?
Company A, like most others, used standard cost accounting. So the orders were submitted to the accounting department to be ‘costed’ for evaluation of the profit potential of the orders.
The gross margin percentage for the orders based on standard cost accounting was only 16% – less than A’s target margin of 25%. So the controller decided to reject the orders. The sales force was deflated. Something did not seem right and its intuition was buzzing. After all, the equipment was available and while the staff might have to be increased, the decision still didn’t seem to make sense.
Standard cost accounting treats all manufacturing costs as variable. So in order to develop the potential cost for these products, the accounting group looked at each of the routings required to manufacture the product and estimated the amount of time required at each routing. They then applied the costing rate for each routing to those hours to get the estimated labour and overhead cost. Then, they added the actual materials required, based on the bill of materials. When adding these together, the total manufacturing cost was identified.
What types of costs were put in the cost per hour for each routing? They included labour, supervision, utilities, supplies, equipment depreciation, material handling, maintenance, etc. These are all the costs that GAAP indicates are manufacturing costs.
However, the reality of any new orders to utilise the new press was that the only resulting cost increases would be for materials plus one additional direct labour employee (if, indeed, one needed to be hired at all).
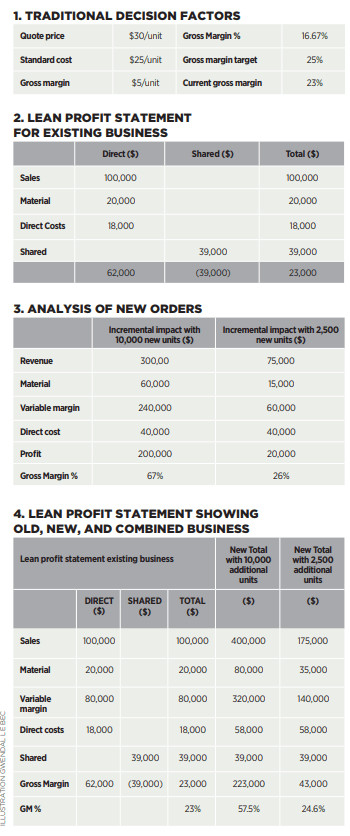
A lean analysis of the impact of the new orders is shown in the tables below, outlining:
- The ‘traditional’ decision factors for decision-making in this business.
- The lean analysis of existing business.
- The lean analysis of the new business – whether 10,000 units or 2,500 units.
- The lean analysis of the combined ‘old’ and ‘new’ business.
Should the sales team’s orders be pursued, the key considerations would be:
- one additional employee needed:
- a 50% probability of 10,000 new units ordered: and
- a 95% probability of 2,500 new units ordered.
And the lean analysis for the new orders would be as shown in Table 3.
Faulty assumptions
As shown in Table 4 the overall gross margin percentage on the new business increased well beyond the 25% threshold when only the actual costs (incremental revenue, material, labour) were added to the existing book of business.
After the controller had made the ‘thumbs down’ decision, the sales force sought outside help to uncover what impact these orders would really have. Then they were able to get a meeting with the president and the controller to present a different picture – the analysis shown in the tables.
When the controller was faced with this ‘actual increase’ analysis, he nevertheless remained unconvinced. He was concerned about what would happen if ALL the business came in at this lower gross margin percentage? What if the press reached capacity and a second machine was required?
This, even though the time to reach capacity on this machine – even with these new orders (and others) – was expected to be years in the future. The controller was holding so tightly to standard cost thinking that he was willing to forego near-term incremental profit and cashflow to avoid what ‘might’ happen in the distant future.
This kind of thinking occurs because of the way traditional financial analytical information is presented which drives decision making on faulty assumptions about manufacturing a product. And, in this particular case, once a decision maker announces a decision, it is often hard, emotionally, to reverse the decision even when faced with evidence to the contrary.
It would have been much easier to pick out the relevant costs and revenues for decision making if only:
- the financial statement had been displayed with the expense types clearly listed;
- and the accounting adjustments for GAAP inventory valuation had been displayed separately
A statement arranged like this is called a ‘plain English’ or ‘lean’ financial statement. (Below is how a lean financial statement might look.)
The lean statement continues to follow GAAP with manufacturing costs gathered in the cost of sale section, and inventory valuation includes labour and overheads. It is just presented differently.
The lean financial statement can take many different forms. But the one shown here demonstrates some of the key elements they have in common, namely:
- The costs that truly vary with sales volume are separated from those that either vary indirectly with sales volume or not at all. Each type of cost is reported rather than merged into ‘standard cost and variances’.
- The accounting treatment of changes in labour and overhead in inventory is captured on a separate line. This treatment is especially critical when the inventory levels are decreasing (as happens in the early stages of a lean manufacturing transformation).
If A’s controller had been used to seeing lean financial analysis, he almost certainly would have approved the new orders. The advantages in profit and margin would have been obvious, and the need to apply intuition would have been minimised – at least, relative to financial impact.
| LINE ITEMS ON A TYPICAL LEAN STATEMENT |
|---|
If A’s controller had been used to seeing lean financial analysis, he would have approved the new orders
Result - A bad decision averted
Luckily, the president of company A was not part of the initial negative decision, and only saw the lean analysis. In the end he decided to override the controller and the new orders were taken.
Case B: Shop floor gains buried by traditional reporting
A private equity firm B acquired several companies in related industries that collectively comprised over 50 manufacturing plants in the US. This merging resulted in duplication and excess capacity across the plants as a whole. Simultaneously, management began to adopt lean concepts in one third of the plants. At the end of the first year, the plants that had adopted lean concepts were seeing significant decreases in work in process (WIP) and finished goods – as is to be expected from the initial stages of a successful lean transformation.
As part of the original purchase plan, the private equity firm was planning to close a few of the plants. It was now time for management to decide which plants to close.
Two of the plants selected for evaluation made the same products in the same area of the country. One had started a lean transformation and the other continued using traditional manufacturing techniques.
A decision was about to be made to close the plant undergoing the lean transformation because its gross margin for the past twelve months was the lower of the two, and its production per employee was less. But operations staff were concerned that this was the wrong choice.
During the preceding year all the plant’s employees had been trained in lean concepts and had deployed them in small teams to make improvements to the equipment set up, placement, and maintenance.
They had reduced overtime. They had reduced batch size – resulting in lower finished goods levels and faster lead times. They had eliminated large amounts of WIP and finished goods.
As a result, the lean plant had achieved some reduced spending and significant improvement in cashflow. Yet the income statement showed a lower gross margin percentage and productivity per employee was down. Why?
The lower margin and productivity figures were a result of the traditional income statement being used, and the non-lean-centric information presented by standard cost accounting.
Lean manufacturing is based on customer orders (pull), and not on building up inventory (push). Even though revenue remained strong, the plant was not replacing the inventory being eliminated (a good thing).
Because of this, the current costs – that had actually decreased (another good thing) – were not being moved off the income statement to the balance sheet.
Therefore, there were unfavourable variances with labour and overhead was not being ‘absorbed’ to the balance sheet.
Also, because the productivity metric was based on units produced instead of units shipped, the productivity metric trended negative – because the only way to reduce inventory in times of level revenue is to reduce the number of units produced.
So, even though the workers and supervisors of the plant were hugely successful in retaining cash, reducing spending, reducing lead times, and engaging all the employees in lean learning, they were all about to lose their jobs, and they all knew intuitively that ‘management’ was crazy or worse.
If the plant had used lean financial analysis and statements, the operations staff would have seen the actual costs becoming favourable. Also, the very positive reasons for the unfavourable gross margin would have shown in the accounting-based inventory valuation line. Instead the reasons were buried behind variance and standards.
The lean plant had reduced spending and improved cashflow
Result - The wrong choice for value creation
In the end, the lean plant was closed. The choice was made by corporate-level decision makers based on traditional GAAP numbers only.
This is a perfect example of dramatic improvement gains on the shop floor being buried in traditional reporting framework. From a value creation vantage point, it looks like a mistake.
Case C: More meaningful data for service companies
For service related companies including legal, medical, consulting etc, the issues related to manufacturing costs don’t exist, but lean accounting can still help provide more meaningful information. Just like in the manufacturing environment, some of the cost and revenue is truly variable, others are direct to a specific product line, and yet others are general overhead to provide support to the product lines.
As an example, consulting services company C traditionally reported its financial statement based on the type of cost: travel, salaries, benefits, office rent, etc.
Faced with significant shifts in volume it was not sure if it should decrease staff in some areas, or add staff in other ones. Traditionally it would just have done a cost reduction across the board, or increased spending related to shifts in overall revenue, ie ‘If sales are up 8%, every department budget is up 8%.’
This time the company decided to:
- realign some financial line items to show two types of revenue for product lines: repetitive sales versus one-time sales and any variable costs (commissions, bonus, travel, advertising) associated with each;
- next, look at the more fixed costs that were direct to a specific product line which included employees salaries and related benefits; and
- finally, separate the remaining cost between office cost, marketing, and owner costs.
Now they could see the relationships between these elements and manage them accordingly, based on the purpose of each cost.
Result - Faster profit growth
The improved categorisation, presentation, and understanding of the nature of costs resulted in profits growing much faster than revenue, leading to improved margins.
Ask yourself some key questions
These are difficult times where companies more than ever need to make the best decision every time. As a decision maker basing decisions on financial analysis to support your company’s growth and success, I think it is important to ask yourself the following set of key questions.
When faced with similar situations to those described would you:
- Have the information and numbers that are truly relevant to product or structural decisions?
- Be prepared to put in the additional time and effort it takes to overcome the misleading financial indicators?
- Make the correct decision?
Well, would you?
Download pdf article
- The lean vs standard cost accounting conundrum
Finance & Management Magazine, Issue 200, June 2012
About the author
Jean Cunningham is founder of Jean Cunningham Consulting: ‘Building LEAN Beyond Manufacturing’
More support on business
Read our articles, eBooks, reports and guides on finance transformation
Finance transformation hubFinancial management eBooksCan't find what you're looking for?
The ICAEW Library can give you the right information from trustworthy, professional sources that aren't freely available online. Contact us for expert help with your enquiries and research.
