
Hello and welcome to the continuing series from the Excel Community's Financial Modelling committee, in which we will work through the chapters of our Financial Modelling Code and explain how each element translates into practice.
In this instalment of the blog series, I will be examining the “Use consistent placement” principles, as covered in page 9 of the Improve your financial modelling practiceFinancial Modelling Code.
The previous article explained the importance of consistency in formula blocks. Here we consider the need for consistent structure in models, specifically timelines.
The value of Consistency
For the end-user: Intuitive design and comparability
Then looking at a financial model, most users expect all information on a sheet to have the same consistent periodicity and to be in chronological order. Typically, having a single column representing values related to the same period is also intuitive.
An inconsistent timeframe can easily lead to confusion and frustration, leading to a lack of trust in the model and its construction.
For instance, it would be very confusing if column D reflected 3 months, column E reflected 1 month, and then column F reflected 3 months again. As soon as the user has to think about periodicity, they are not thinking about what the cells are trying to tell them.
For the builder: Efficiency and cost savings
Consistently structured worksheets help to achieve consistent formula and aid user model orientation. Using a consistent approach will also make it easier to spot errors e.g. if you have a formula pointing at a different part of the worksheet, if you know column R is always September 2020, and your code should be using values from that period, the cell references in the formula should start with an “R”. As discussed in Part 6, a consistent approach leads to a more efficient build process and can save time, energy and money.
For this reason, good practice is to keep columns relating to time periods consistent across relevant worksheets sharing that timeline. For example, if the sheet containing your inputs show column H representing the quarter ending Mar 20, then your workings and outputs should also reflect this quarter.
The easiest way to achieve this is by linking the timelines on related sheets to the first worksheet that has been created.
Tip - Include spare columns before the timeline starting column if you need to. This will help to ensure a constant/consistent starting column for your timeline and allow for additional items such as ‘unit description’ or ‘total’ column to precede periodic columns.
Multiple Timelines
Ideally, each worksheet of a model should only contain one timeline. If the model requires information with different periodicities (both monthly and quarterly inputs), these are best separated into different sheets - for instance, having a monthly sheet that has only monthly inputs, workings, and outputs.
It is not recommended to mix different timeframes on the same worksheet.
Where this is unavoidable, the model builder must make it clear to the user which timeline relates to each value within a model.
This can be achieved by placing any secondary or tertiary timelines near to each of the values to which they relate, allowing them to be viewed together without scrolling.
In the example below, monthly construction costs are shown within an otherwise quarterly sheet. The costs and their timings are shown together and have been highlighted to make it clear that there is something different about them.
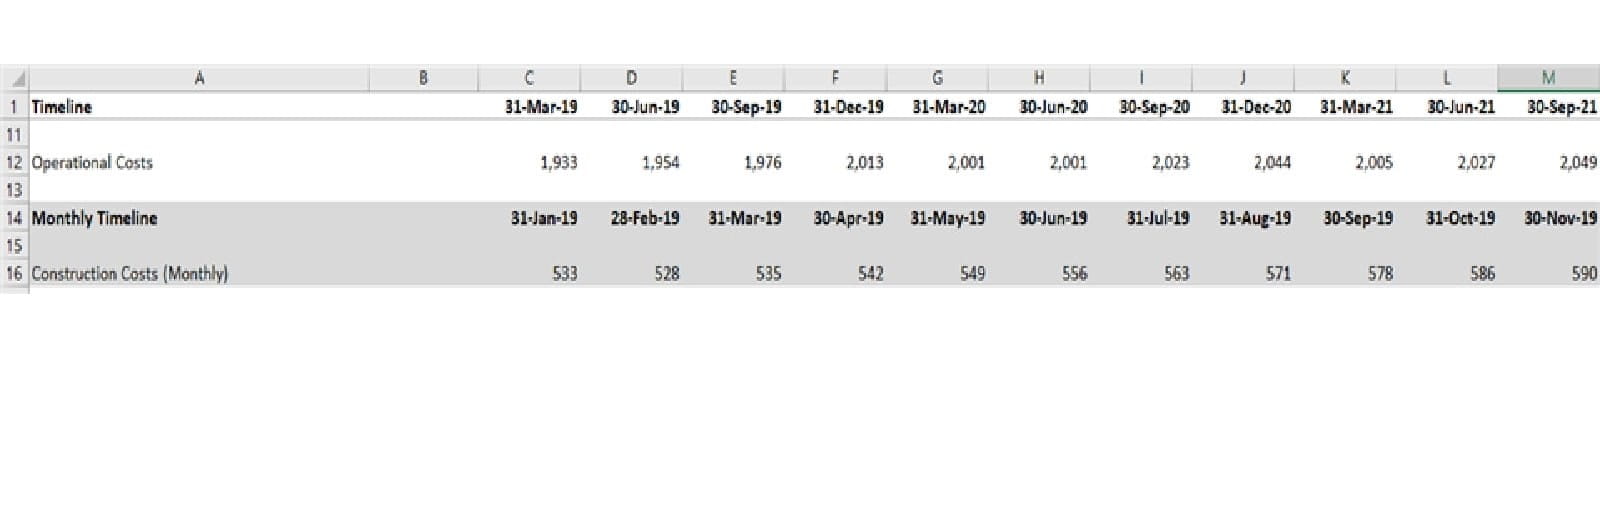
Tip – It is also useful to use labels to clarify items that do not follow the primary timeframe e.g. ‘Construction Costs (Monthly)’ or ‘Availability Fee per day’.
Changing Periodicity
A change in periodicity should not undermine formula consistency – you should, therefore, make sure the formula knows when the calculation should change (in this example, from monthly to semi-annual). For P&L and cashflow items, consistency with a changing periodicity can be achieved easily with an IF statement and a flag stating what timeframe the column is in. This can become more involved when looking at balance sheet items, so it is recommended to thoroughly test and review the period where timeline transition is expected.
Secondary Dimensions
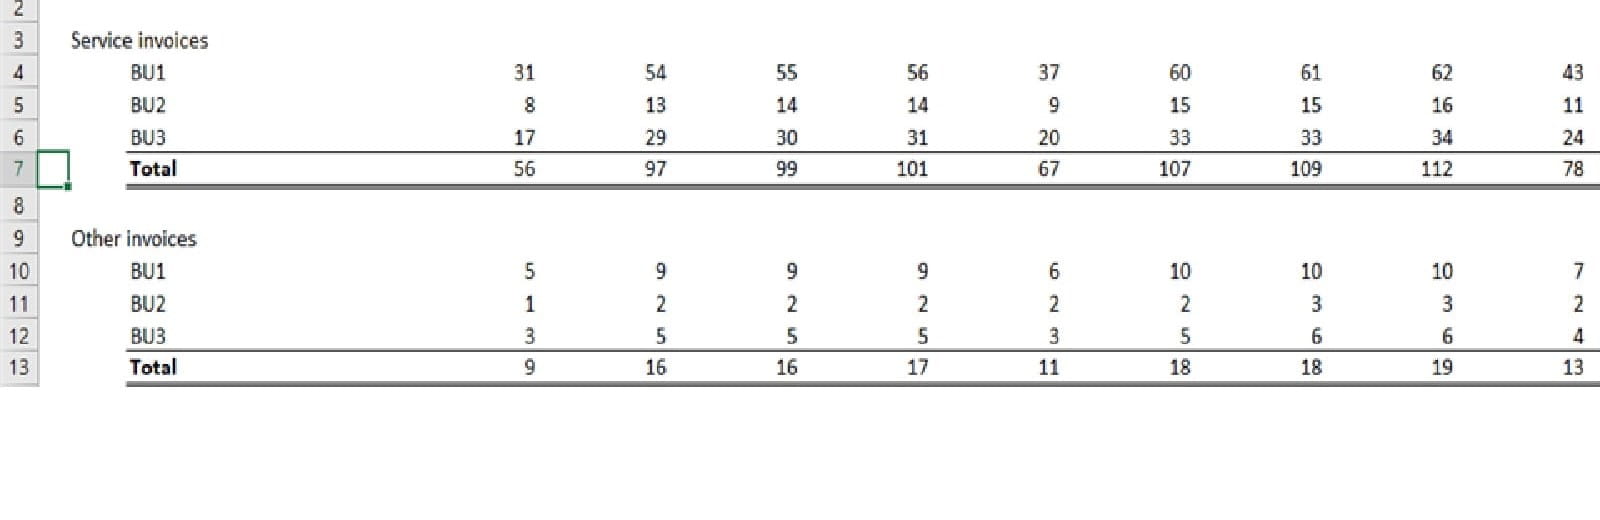
If secondary dimensions are used, you should ensure that they are kept in a consistent order and with a uniform level of detail. For example, the business units below are kept in the same order for both types of invoice and are all showing a monthly breakdown.
Other things to avoid
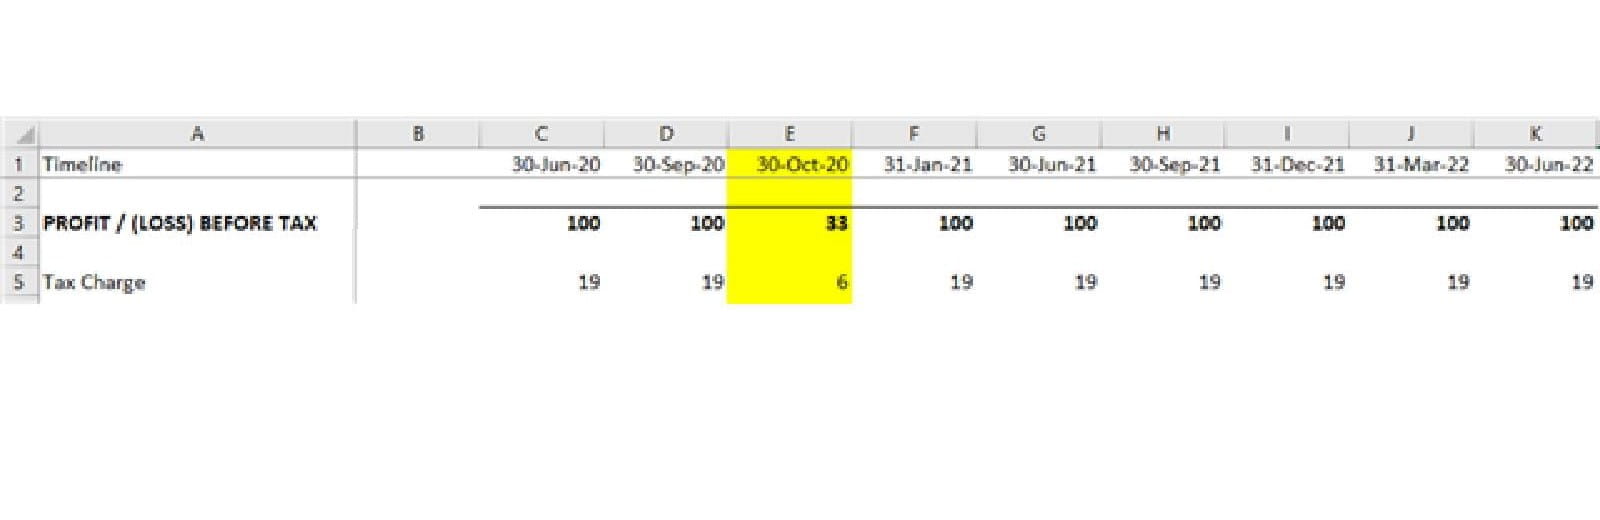
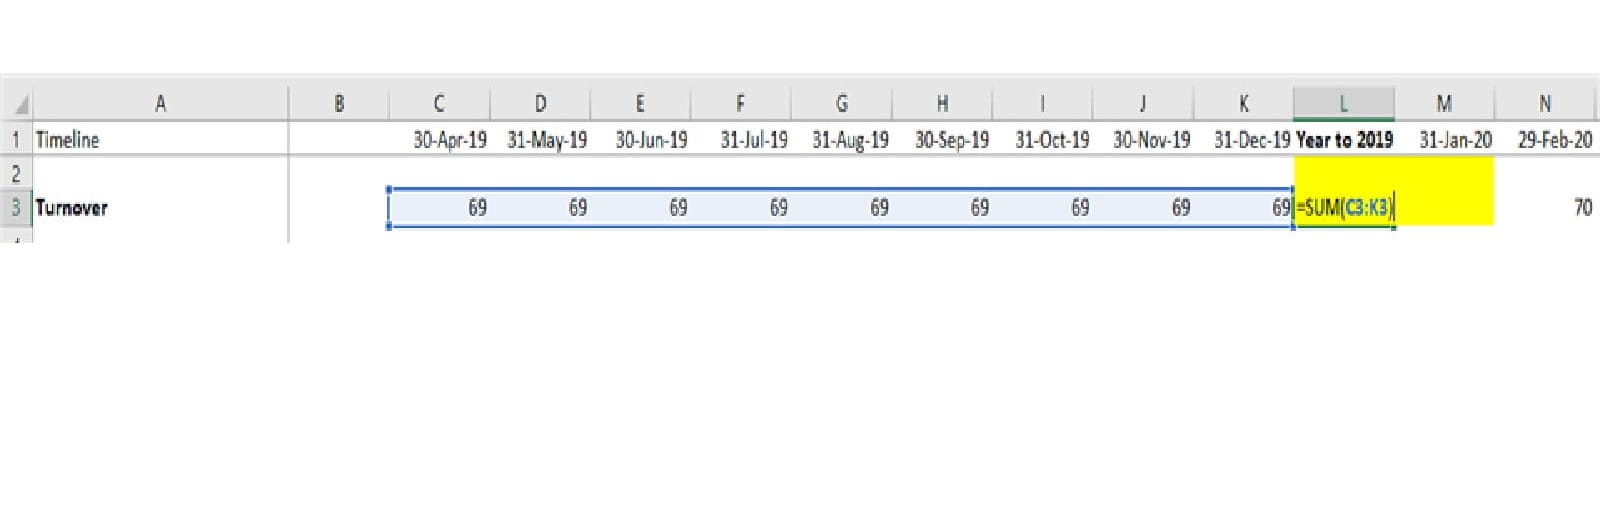
The Code warns against the use of ‘variegated’ timelines in the calculation worksheets. The example below shows a monthly timeline with the subtotal for the year highlighted in yellow. Taking this approach is not good practice as it makes the model very difficult to analyse quickly (i.e. the reader is unable to just run their eye along the row or graph it).
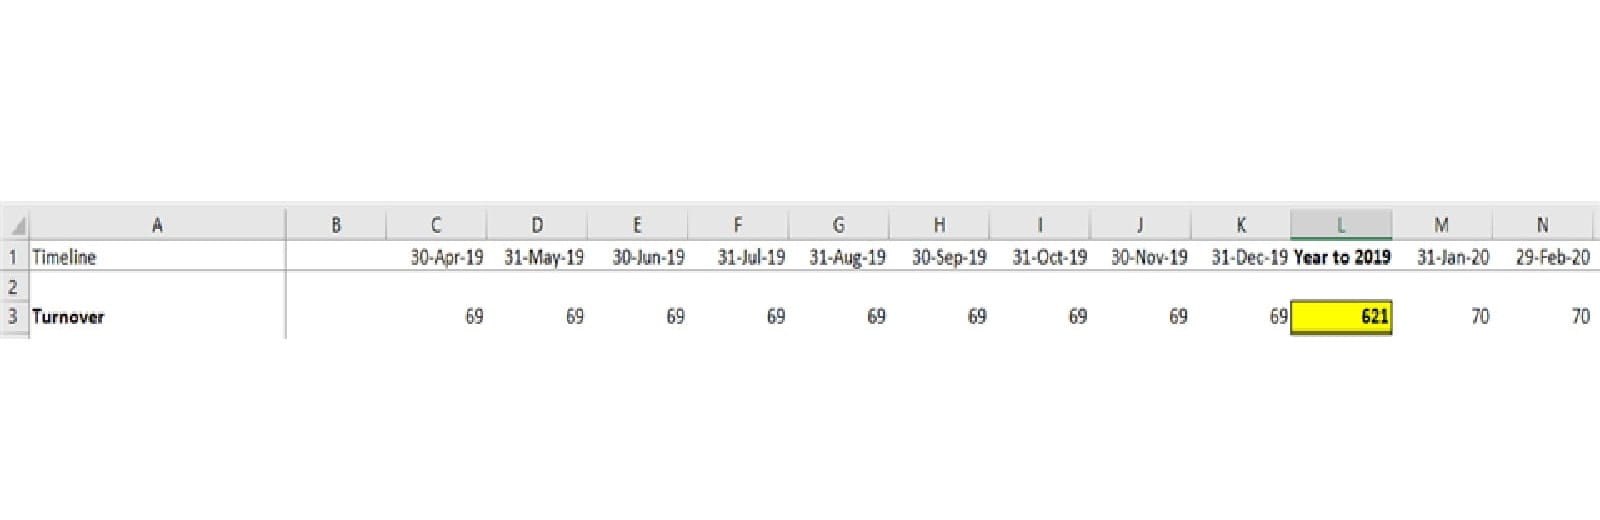
Furthermore, variegated timelines are also generally inefficient for the model builder/reviewer, the interruption/variability of the calculations in the row means the formulae are likely to be inconsistent and therefore create additional work to code or review.
For example, in a two-year monthly model, adding a quarterly summary using a variegated timeline which with subtotals could involve up to 23 changes in the formulae along the row depending on how it is coded. From a best practice perspective, it is better to keep a continuous 24-month timeline, with one consistent formula; and then summarise with a second continuous quarterly timeline for 8 quarters, again with a single formula and noting the advice above about mixing timelines.
Tip - Use a separate sheet to show summarised figures if they are required or alternatively append a summary timeline to one side and separate the timeframes using a blank column.
Final thoughts
Consistency is key for timelines, both for an individual sheet and for related sheets within a larger model. If multiple timelines are absolutely necessary, consider having separate sheets and clearly signpost the change in the timeline.
While consistent timelines are intuitive, can help with comparability, and streamline a build/review process, the benefits are significantly reduced if you are unable to see them! So, my final tip is to follow the rule of thumb mentioned here and remember to use freeze panes to keep the timeline in full display.
Next in series
Intro to Financial Modelling - Part 8: Clarity - Use of formatting
- Intro to Financial Modelling - Part 19: Wrap-up
- Intro to Financial Modelling - Part 18: Sensitivities and Scenarios
- Intro to Financial Modelling - Part 17: Calculation Techniques - Loan Calculations
- Intro to Financial Modelling - Part 16: Calculation Techniques - Flags and Masks
- Intro to Financial Modelling - Part 15: Error reduction - Common pitfalls
Excel community
This article is brought to you by the Excel Community where you can find additional extended articles and webinar recordings on a variety of Excel related topics. In addition to live training events, Excel Community members have access to a full suite of online training modules from Excel with Business.

Archive and Knowledge Base
This archive of Excel Community content from the ION platform will allow you to read the content of the articles but the functionality on the pages is limited. The ION search box, tags and navigation buttons on the archived pages will not work. Pages will load more slowly than a live website. You may be able to follow links to other articles but if this does not work, please return to the archive search. You can also search our Knowledge Base for access to all articles, new and archived, organised by topic.
