
In this ICAEW modelling good practice blog instalment, I will be taking a closer look at flags and masks and how they can be used to improve your models, as covered in pages 16 and 17 of the Financial Modelling Code.
If accounting has double entry bookkeeping at its core, then similarly three statement Financial modelling uses those same concepts to keep the model in balance. As most of us should be aware, the components of an accounting entry are i) the value, ii) the date, iii) the accounts to be posted to, and iv) a narrative; and to be effective in carrying out the right postings, we need to keep track of all four components within the model:
- value will be derived in some form of company specific computation (e.g. revenue = unit price x unit volume);
- date is dictated by the column the calculation occurs in;
- narrative is represented by the row label; and finally
- the accounts to be posted to are taken care of by the linkages and wiring in your model.
But what about when things change over the timeline of your model, what’s the best way to keep track? This blog will focus on how to make sure your model is doing the right things at the right time in a way that’s easy to understand and update, via the practical use of flags and masks.
Things change!
Almost all financial models will include some requirement to perform different calculations in different time periods. It could be that a loan is received from a certain date so repayments need to start, or a transition occurs from an actual to a forecast period, or we need to make periodic payments of corporation tax. We need a way to make the model do what we want it to and modify the behaviour of the calculations over the timeline.
Why flags?
A simplistic approach to tackling a change in behaviour over time would be to use a different formula in each period. For example, in an actuals period use a formula to call up a historical P&L but in a forecast period link to your forecast workings instead. The result is one formula in the first few columns of a row, and a different formula used in the last few columns. This is almost always a bad idea because it means the model can’t easily be updated to accommodate more actual periods as time moves on without editing formulae, which is not very user friendly and has a big risk of error – as discussed in Intro to Financial Modelling - Part 6: Formula blocks and consistency.
A better approach is to write formulae which will perform both actions (look up historical data and reference forecast workings) and use an IF function to determine which one to use. The IF function will likely rely on a date based test to determine whether a given period is an Actual or Forecast period. This could be built into the call up function, something like this:
Value Formula = IF(LastActualDate <= ColumnDate, Actual Value, Forecast Value)
However, if the logical test is being used in multiple formulae throughout the model then it makes sense to pull that logical test out as a separate flag, so that each different value formula doesn’t need to repeat the test and can instead refer to the result of the flag:
Flag Formula = IF(LastActualDate <= ColumnDate, TRUE, FALSE)
Value Formula = IF(Flag, Actual Value, Forecast Value)
Flags vs Masks
A flag can be defined as a type of ‘helper row’ since its purpose is to indicate which of several behaviours is actually desired in a given column. In the example above the Actual/Forecast flag will be calculated by comparing the ‘last actuals date’ from an input cell versus the date for each given period. It will therefore identify whether that given period is an Actual or Forecast and therefore dependent formulae, such as financial statement, can use the result of an actuals period call up or a forecast period calculation as required.
A mask is a special type of flag which doesn’t just get used in an IF or CHOOSE function, rather it can be used to multiply an earlier result. For example, if a mask formula evaluates to either 1 or 0 and can be used to ‘mask out’ results by multiplying the source value by the mask – resulting in either the source value, or zero, depending on the result of the mask in that particular column. There are also circumstances where a mask may not be simply 1 or 0, and these are explained below.
Beyond Binary?
In the example above it’s clear that a TRUE / FALSE or 1/0 value could be produced by comparing the ‘last actual date’ to the period date, and have that binary value represent either Actual or Forecast. (e.g. 1 means Actual and 0 means Forecast) This is enough because the model only has two behaviours to choose from ‘Actual’ or ‘Forecast’ and so a binary flag provides sufficient information.
But what about other changes in behaviour which are more complicated? Let’s have a look at some types of behaviour change we might want to model, and the type of flag which can help out:
| Type | Explanation | Example Use Cases | Required Data |
|---|---|---|---|
| Date cut-off | A simple binary flag which is 0 before a Cut Off Date, and 1 afterwards (or vice versa). |
|
Cut Off Date |
| Counter | An ascending or descending index starting or ending in a specific period. |
|
Cut Off Date (optional number of periods) |
| Periodic | A binary flag which repeats with a given frequency. Important to remember you need to specify both the frequency and datum. I.e. if rent is quarterly are the quarters Jan/Apr/Jul/Oct or Mar/June/Sep/Dec for example. |
|
Frequency and Datum |
| Contingent | A binary flag is set based on certain criteria being met, for example all the debt is fully repaid and there are positive reserves and cash – if these are all met then we can pay a dividend. |
|
|
| Scalar | A percentage calculated in each period, can be used in a similar way to a binary flag, except that being non-binary it will produce a non-binary answer. |
|
Datum (optional also rule / profile) |
* - Assuming the model has a monthly timeline.
How does that look in practice?
The following practical examples illustrate each of the flag types set out above, and show how they work and when you could use them.
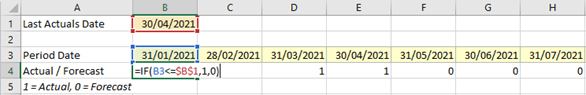
Date Cut-Off
In this example we want to return a 1 for an actual period, and a 0 for a forecast period. The solution is very simple, compare the period date vs. the ‘last actuals date’ and use an IF function to return a 1 or a 0. Once computed, an IF function can use the actual/forecast flag as an input to determine which logic the model should follow in that given period.
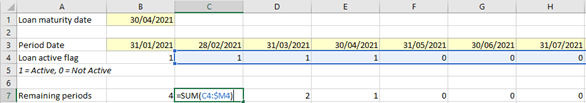
Counter
In this case we will calculate a descending period counter which can be used to amortise a loan over the remaining periods. We will do this in two steps, first to determine when the loan is active, and then to count the number of periods remaining. The ‘loan active flag’ is calculated in the same way as the date cut off flag example above. The periods remaining counter is simply an anchored SUM. Once the remaining periods are known a PPMT function, or similar, could be used to compute the required repayment value. (Note – the next in this series of articles will cover loan calculations in more detail).
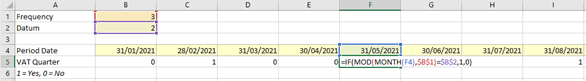
Periodic
Now we need a flag to identify the VAT quarters. For this company they will be Feb/May/Aug/Nov. This function requires two inputs, the frequency (which is every 3 months) and the ‘datum’ which determines which is the ‘first month’ in the cycle (in this case it’s 2 because that corresponds with February). If you wanted a different set of quarters, e.g. Mar/Jun/Sep/Dec then the datum for March would be 3 for example.
The required formula will check the month number (1-12) and reduce to its value, modulo 3, i.e. what’s the remainder after dividing by 3;
- For example, May is month 5 and 5 = 1 x 3 + 2, so “5 mod 3” is 2 because the remainder was 2. Because the remainder of 2 matches the datum of 2, the resulting flag is set to 1.
- By comparison, October is month 10 and 10 = 3x3 +1, so “10 mod 3” is 1 because the remainder was 1. Because that remainder of 2 does not match the datum of 2, the resulting flag is set to 0.
Once we have the periodic flag it can be used as an input to an IF function to pay the opening VAT liability in each given month.
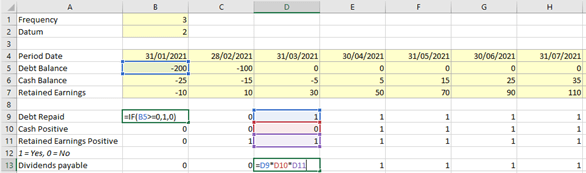
Contingent
It’s very common that you may want to perform a series of tests in order to set a flag, for example checking that debt is repaid and there is sufficient cash and reserves to start paying dividends. Two formulae are used here, the first will check each balance is positive (the same formula has been applied in rows 9:11) and flag value is 1 for yes, and 0 for no. The second formula checks that all of the preceding flags are set to 1, as if any of them are zero then the product of them will be zero. In the example the first time all the flags are ‘yes’ is in April 2021. Once we have the contingent flag it can be an input to an IF function to make a dividend payment, or not.
Scalar
This example is to represent a partial period – for example if a contract to provide a service is signed mid-month it may not be an appropriate modelling simplification to round the nearest whole month. Instead it may be more appropriate to calculate the proportion of the month in which the services is provided, and so your model may require a calculation of the initial partial month proportion. The partial month flag can then be applied to the baseline monthly revenue to compute the actual revenue to be earned in the month.
The formula in row 5 finds the number of days in the month by using the later of either the period start, or the contract start date and compares that against the period end. If that’s negative (as is the case in periods where the contract start falls after the month end) then it’s replaced with zero. If it’s positive then it will either represent the number of days from month start to month end, or if the contract started during that month (April in this case) then it’s from the contract start (16 Apr) until month end (30 Apr). The calculated number of days is divided into the total days in period to get the partial period flag. Once we have the partial period flag it can be multiplied by the contractual monthly revenue to get revenue earned in the partial period which is in row 8.
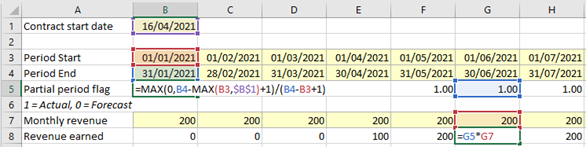
Note, the formula in row 5 includes a “+1” in both the denominator and numerator of the fraction. The reason is that the formula is subtracting the period start date from the period end date, and we need to add one in order to get to the number of days in the month including the first and last days. (An alternative would be to refer to the difference in period end dates between consecutive periods, in which case the +1 term would not be required.)
A bit of best practice
A modelling blog wouldn’t be a modelling blog without touching on a bit of best practice! Some of these concepts have been touched on above, so I’ll keep it short and to the point:
- Use a timeline and flags sheet to calculate any flags which you will need on multiple sheets, and then link to those dates and flags at the top of each calculation sheet instead of re-calculating common flags such as actual/forecast. This reduces unnecessary repetition.
- In cases where there is a choice of values, calculate all the alternative values in separate rows, then apply the flag. The flag could be applied via:
- Multiplication (e.g. in the case of a 1/0 mask)
- IF function, or
- CHOOSE function.
This enables a reviewer to see all the alternative values and it’s also easier for the modeller to update the logic of one option clearly and separately from the others.
- Calculate the base value and then scale appropriately. E.g. for a solar farm you may have an input for forecast sunshine per day and the power rating of the panels, so calculate the power per day and then multiply by the number of days in the period as that could vary depending if you’re in a monthly or quarterly time period in the model.
- Call flags up to the calculation. No one likes having to follow the long blue arrows of the ‘trace precedents’ function, so we would generally advise calling-up the inputs/precedent workings to the calculation to the calculation area before using them – which includes flags! (Note, do take care to avoid daisy-chaining, each area should link to the original independently. Also, please use call-ups in moderation – extreme adherence to this can generate unhelpful ‘white noise’ within a model.)
- Don’t use cross sheet references in calculation formulae. If tracing a blue arrow up the page is a pain, then tracing the dotted grey one across sheets is worse… we recommend avoiding it if at all possible! Instead try to call up source data as if it were an ‘input’ to this calculation area and then reference it within the sheet to avoid daisy chaining.
Final Thoughts
The benefits of flags and masks are clear, they can:
- make the model less risky by supporting consistent formulae across the timeline,
- make the model easier to read and update by separating the underlying calculation of values from the logic tests used to determine which option to use in each period,
- make the formulae easier to read by making them shorter,
- make alternative results easier to see because they are computed and visible in their own row, and
- make the model easier to review because there are more ‘check points’ (i.e. interim results) visible in the calculation chain on the page.
Hopefully this has been useful and given you some structure in the way that you think about and use flags in your models.
Next time… the next instalment in this Financial Modelling series will cover Loan calculations!
Excel community
This article is brought to you by the Excel Community where you can find additional extended articles and webinar recordings on a variety of Excel related topics. In addition to live training events, Excel Community members have access to a full suite of online training modules from Excel with Business.

- Intro to Financial Modelling - Part 19: Wrap-up
- Intro to Financial Modelling - Part 18: Sensitivities and Scenarios
- Intro to Financial Modelling - Part 17: Calculation Techniques - Loan Calculations
- Intro to Financial Modelling - Part 16: Calculation Techniques - Flags and Masks
- Intro to Financial Modelling - Part 15: Error reduction - Common pitfalls
Archive and Knowledge Base
This archive of Excel Community content from the ION platform will allow you to read the content of the articles but the functionality on the pages is limited. The ION search box, tags and navigation buttons on the archived pages will not work. Pages will load more slowly than a live website. You may be able to follow links to other articles but if this does not work, please return to the archive search. You can also search our Knowledge Base for access to all articles, new and archived, organised by topic.
