
Hello all and welcome back to the Excel Tip of the Week! This week we have a Creator level post in which we are starting a short series introducing you to the essentials of Power Pivot. This is a follow-up to our recent webinar on the topic.
Getting started with Power Pivot
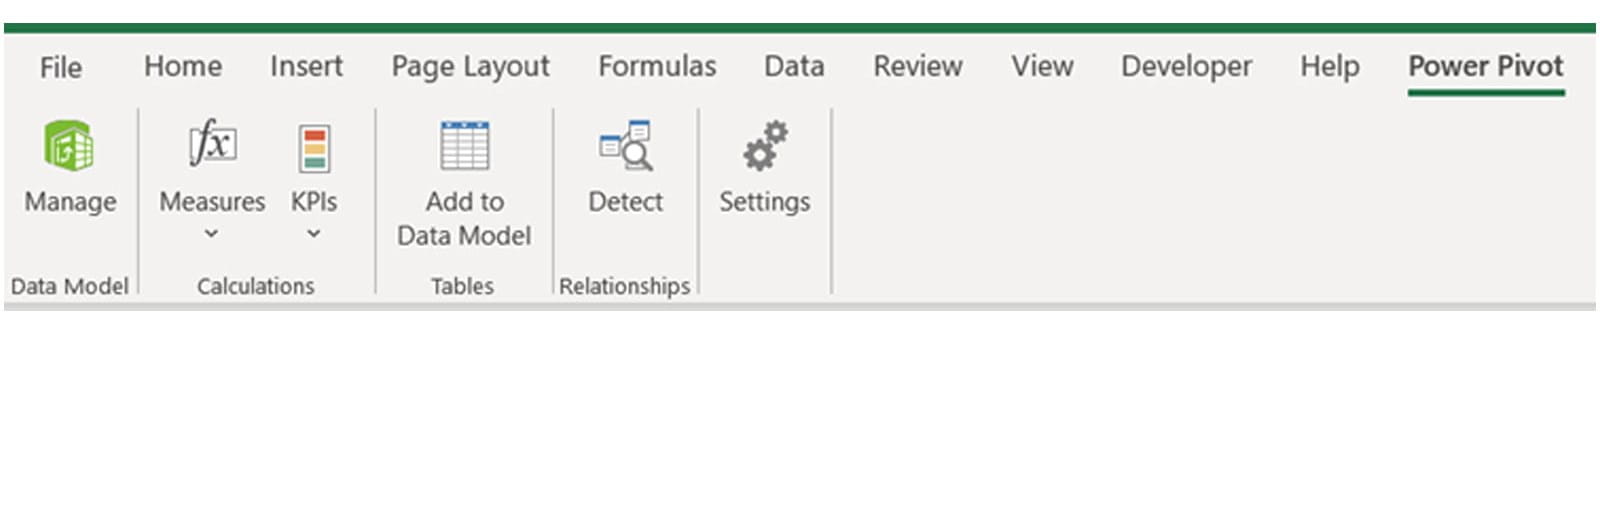
Power Pivot is a free add-in for Excel and usually is available automatically. To enable it, go to File => Options => Add-Ins => COM Add-Ins => Go. It will appear on its own tab:
In this blog, we’re going to look at how to import data into the Power Pivot data model, and how to start using it to make PivotTables. For our example, we are going to use the Northwind dataset, which was created by Microsoft in the 90s to teach the Access database program. It’s a good example to use because it contains information about sales for a company spread across multiple tables, with overlapping but distinct information in each. You can download the file we are using here – including the Northwind data – here.
Here’s a quick overview of the eight tables in the Northwind dataset:
Table name |
Description |
Fields that link to other tables |
| Categories | Top-level categories of items offered for sale | CategoryID |
| Customers | List of all customers | CustomerID |
| Employees | List of salespersons and their personal information | EmployeeID |
| Order details | Complete listing of items included in each order, the price they were sold for, and any discount applied | OrderID, ProductID |
| Orders | More general description of each order, including relevant salesperson, customer, shipping agent, and date | OrderID, CustomerID, EmployeeID, ShipVia |
| Product | Description of each product | ProductID, SupplierID, CategoryID |
| Shippers | Details of the three different shipment companies in use | ShipperID (maps to ShipVia in the Orders table) |
| Suppliers | Details of the suppliers of each product | SupplierID |
As you can see, none of the tables contains all of the information – but each has a link to at least one other table. Some of the tables are more-or-less static – containing listings of suppliers, customers, and so on – and would be updated rarely. But others, like Orders, are dynamic and would be constantly expanding as more orders are processed.
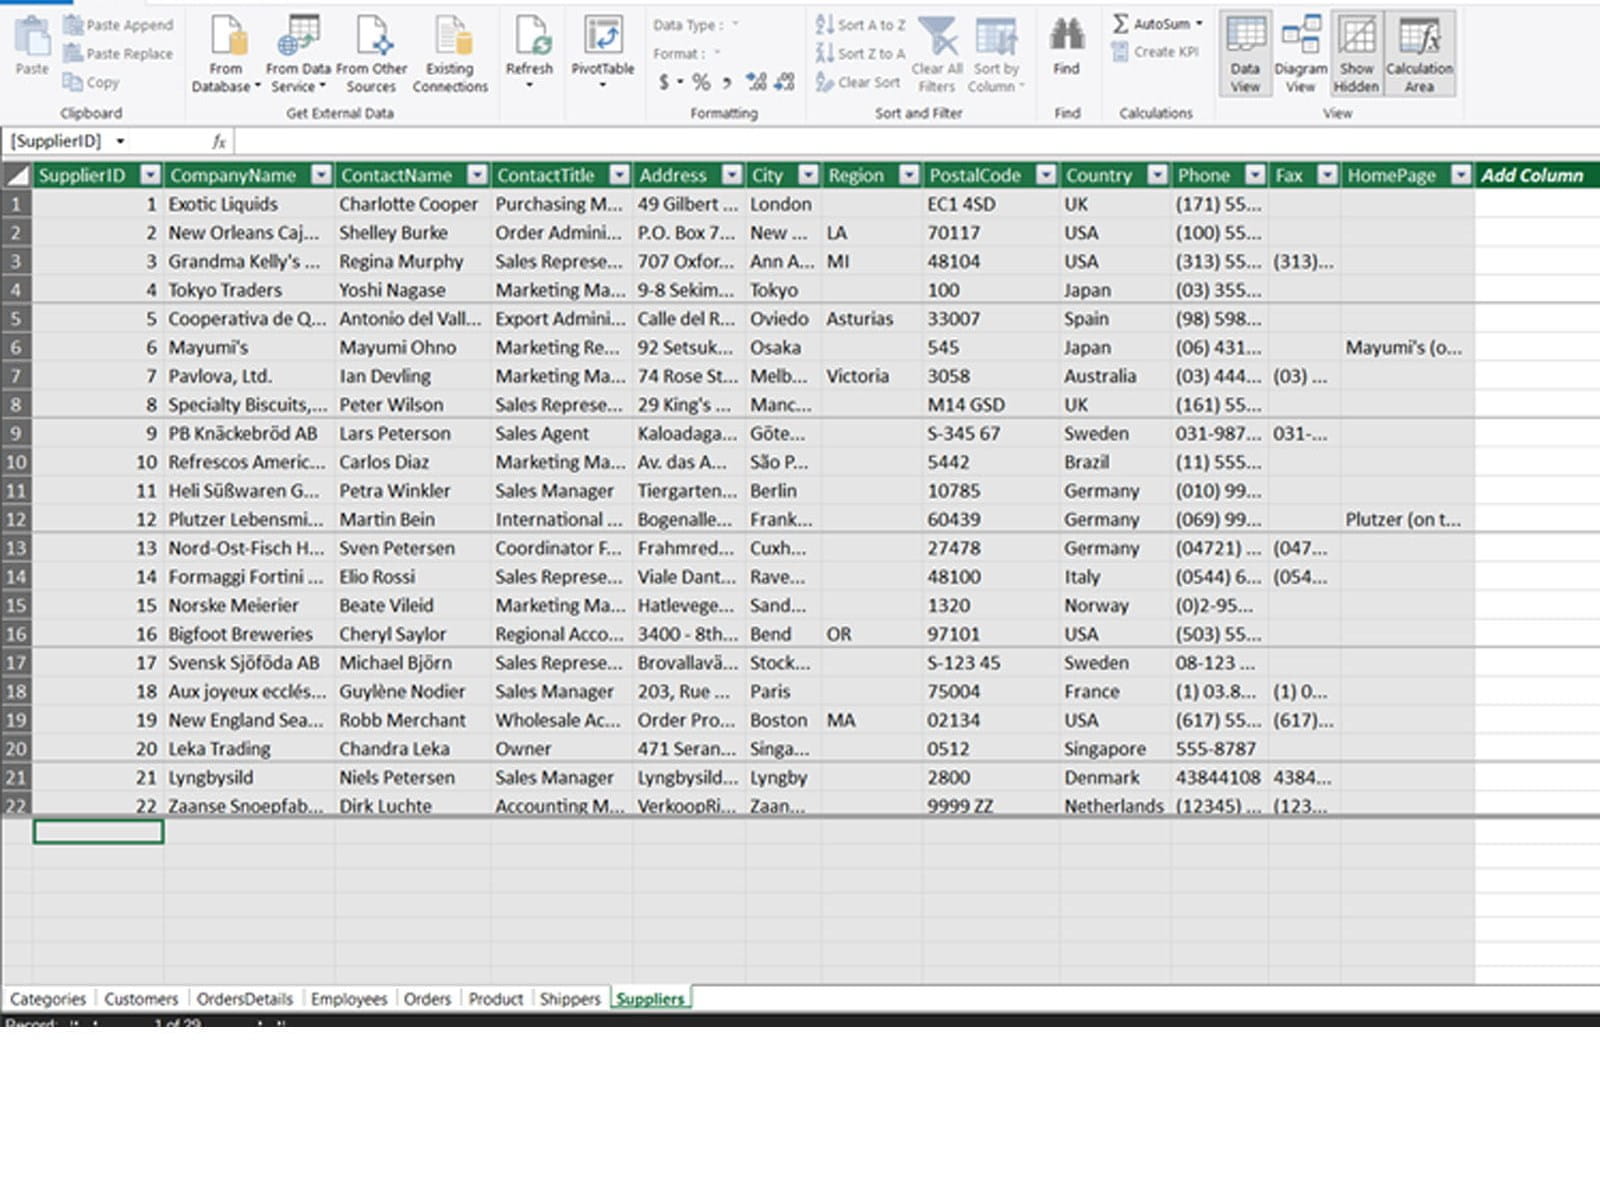
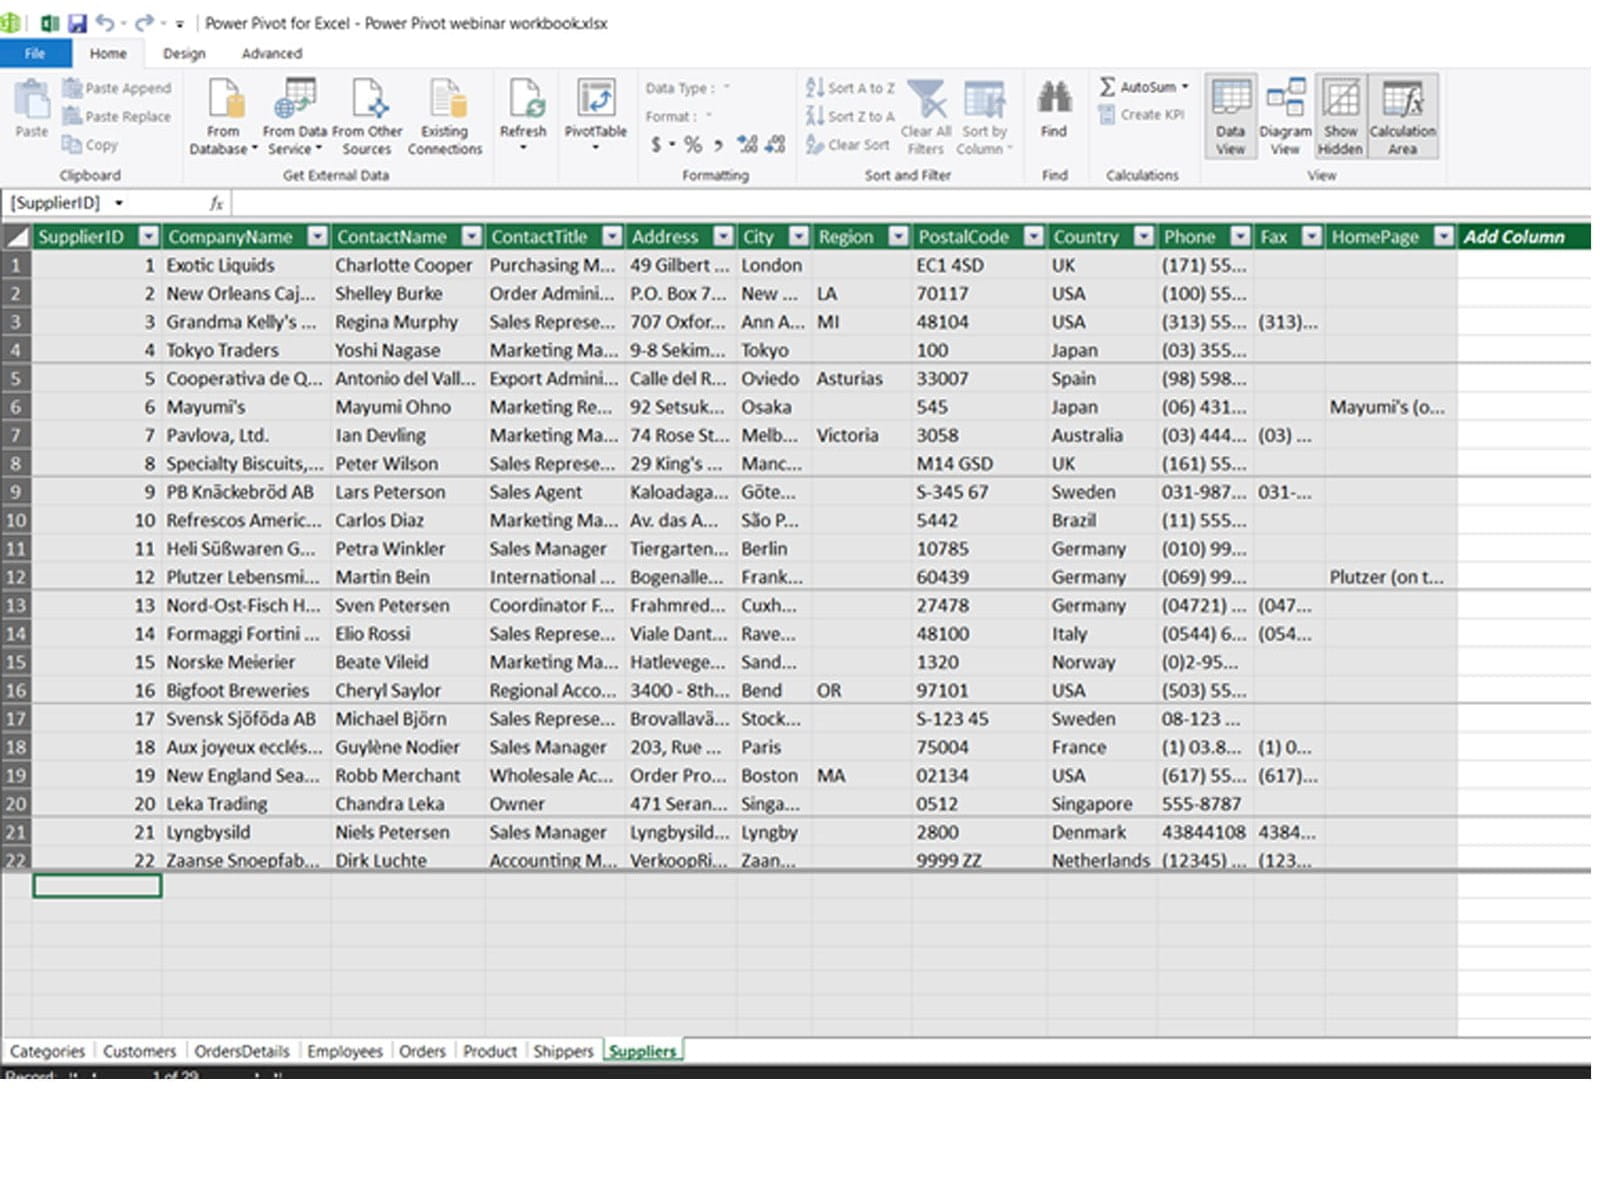
To add one of these to the Data Model, we just highlight the appropriate table and use the ‘Add to Data Model’ button. That opens the separate Power Pivot window, which when all is done looks like this:
While we could create PivotTables from here (see the button top and centre), the real strength of the Power Pivot data model is in creating connections between tables. To do this, we just open up the Diagram View (top right):
All we have to do is click and drag to create links between the related fields in different tables. You can also rearrange the various tables to make them pleasing. When it’s all done it will look something like this:
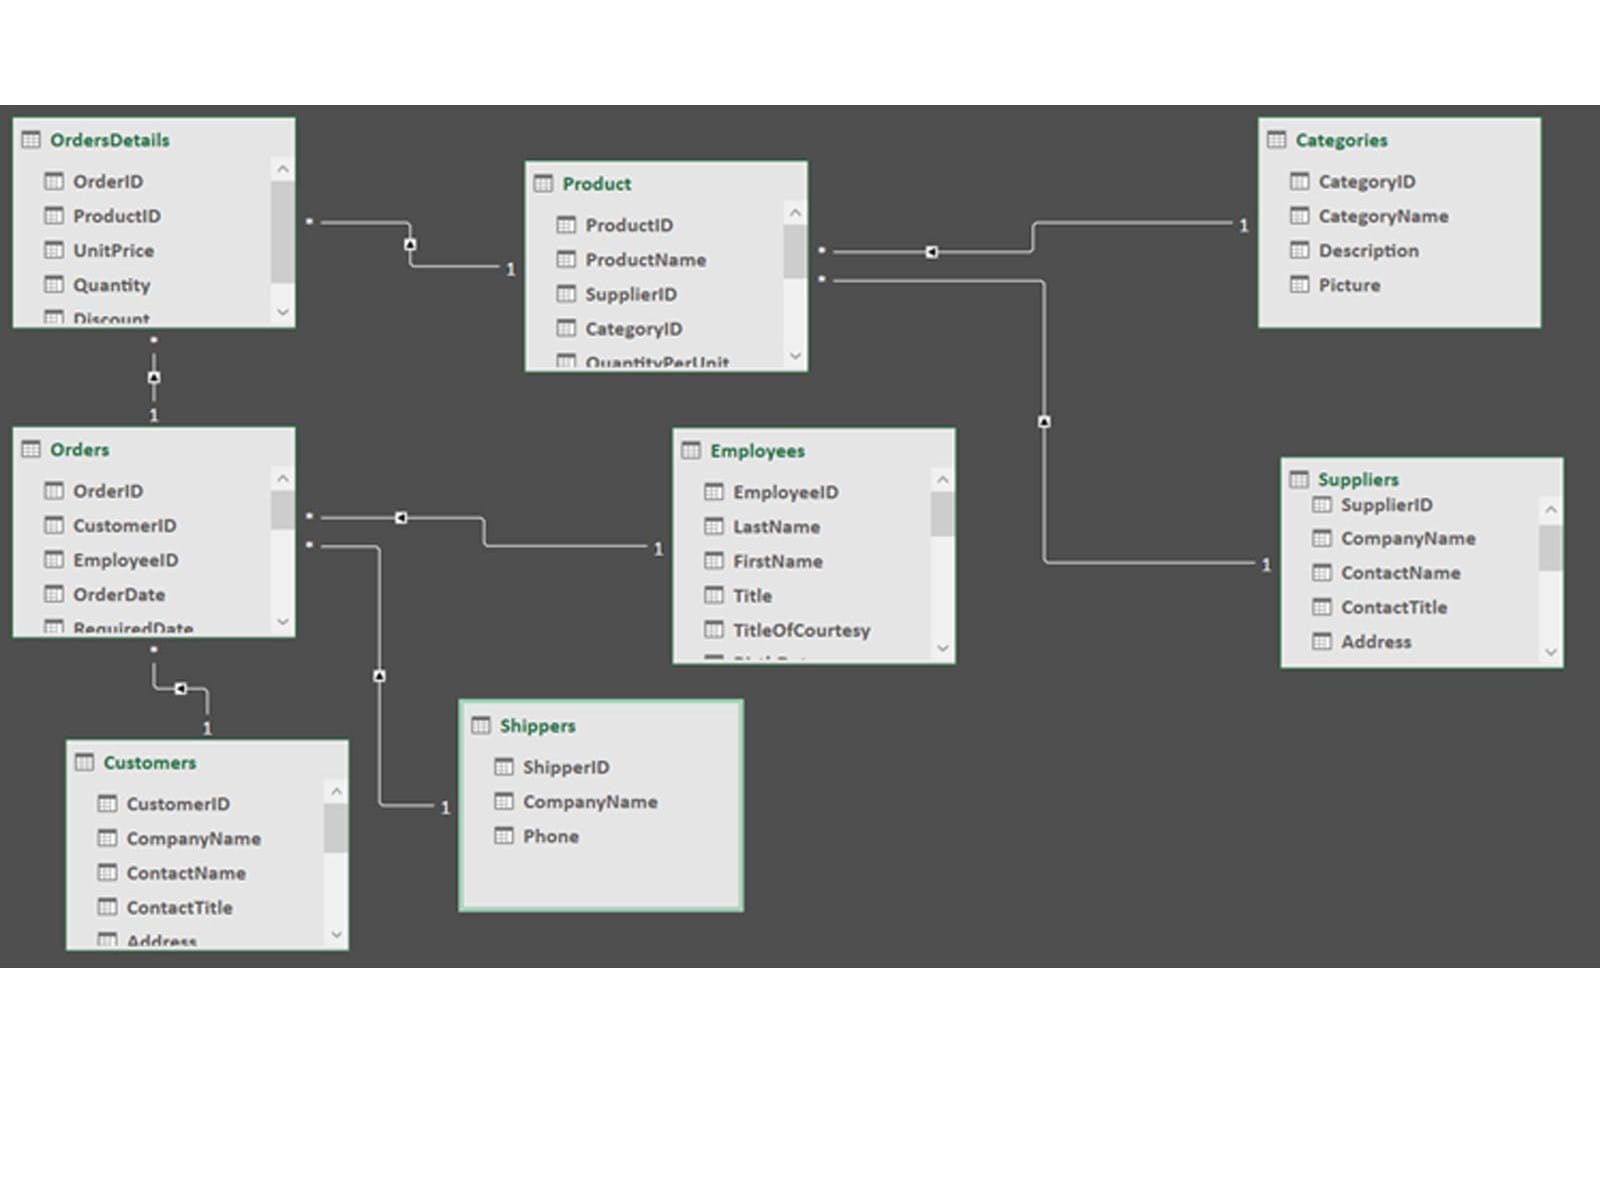
Note that each connection is labelled – either 1 to 1 (none in this example), or 1 to * (“one to many”). This tells you the kind of connection in place – for example, each ProductID in the Product table appears in multiple places in the OrdersDetails table. Connections can only be of these types – so you can’t e.g. create a many-to-many connection.
Now that the connections are created, Power Pivot can associate fields from one table to another. To demonstrate, we can create a PivotTable, and then mix and match fields from more than one table – and it will all just work. For example, here’s a Pivot of the quantity of items sent by shipper:
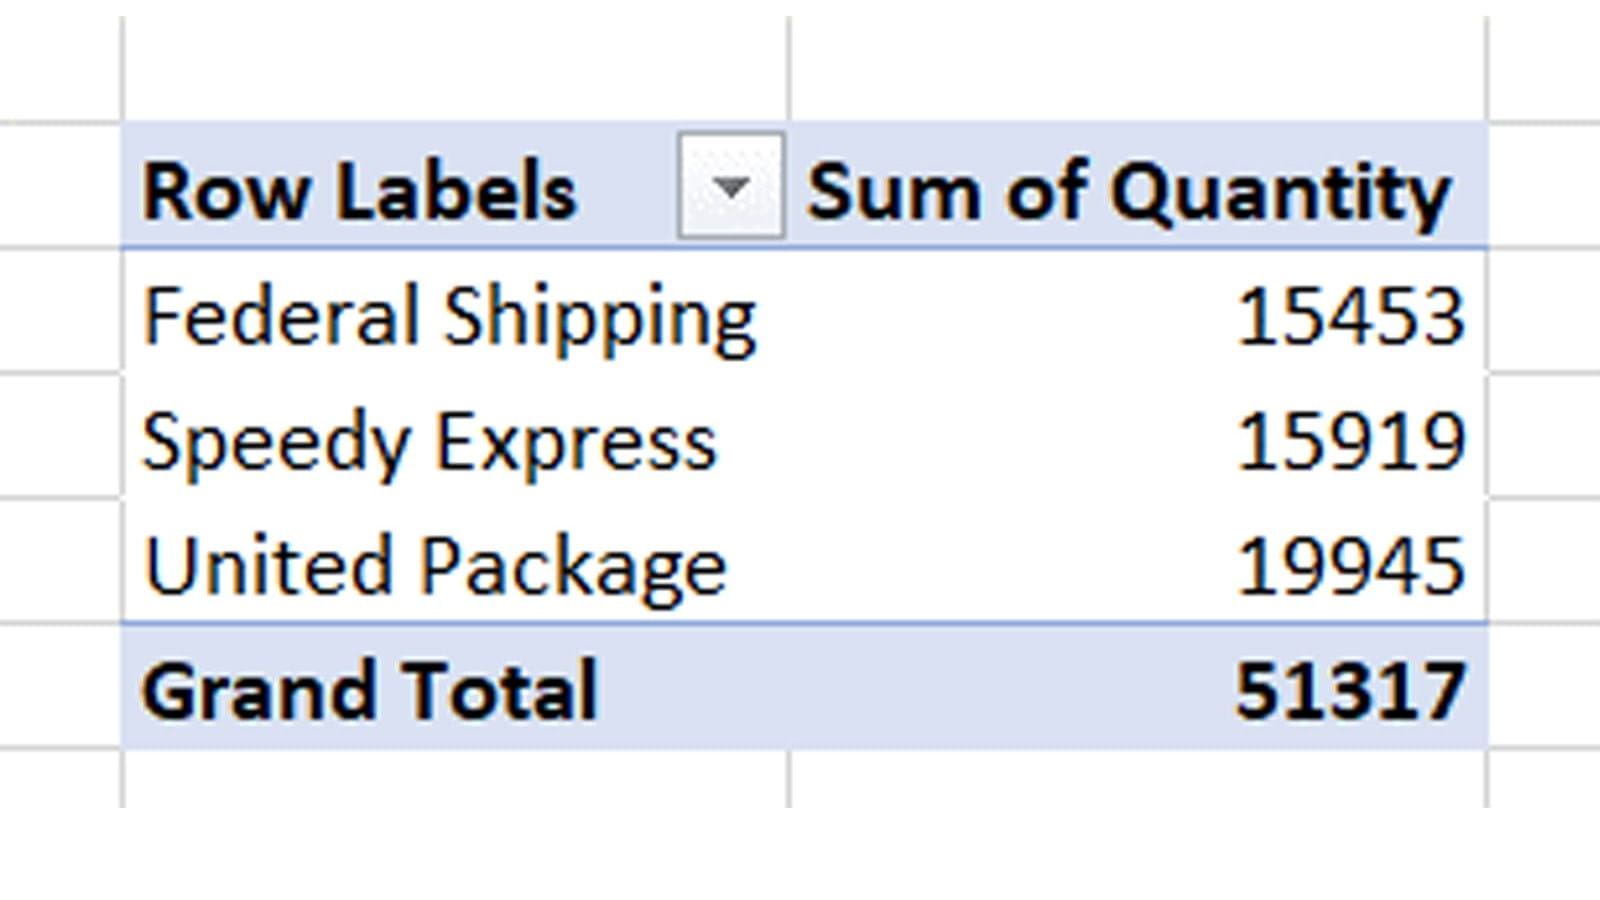
The names of the shippers are in the Shippers table, which connects to the Orders table via the ShipperID field. The Orders table in turn connects to the OrdersDetails table, where the Quantity field lives, via the OrderID field. So even though these tables have no fields in common, we can create this Pivot and it is immediate filled in.
Going further – creating a Calendar table
Many kinds of data analysis require us to use dates. But while date fields are common – our tables contain several – for full analysis it’s usually required to have a table of every date in the appropriate range. We’ll go into more detail about why this is later, but first let’s show how we can easily create such a table.
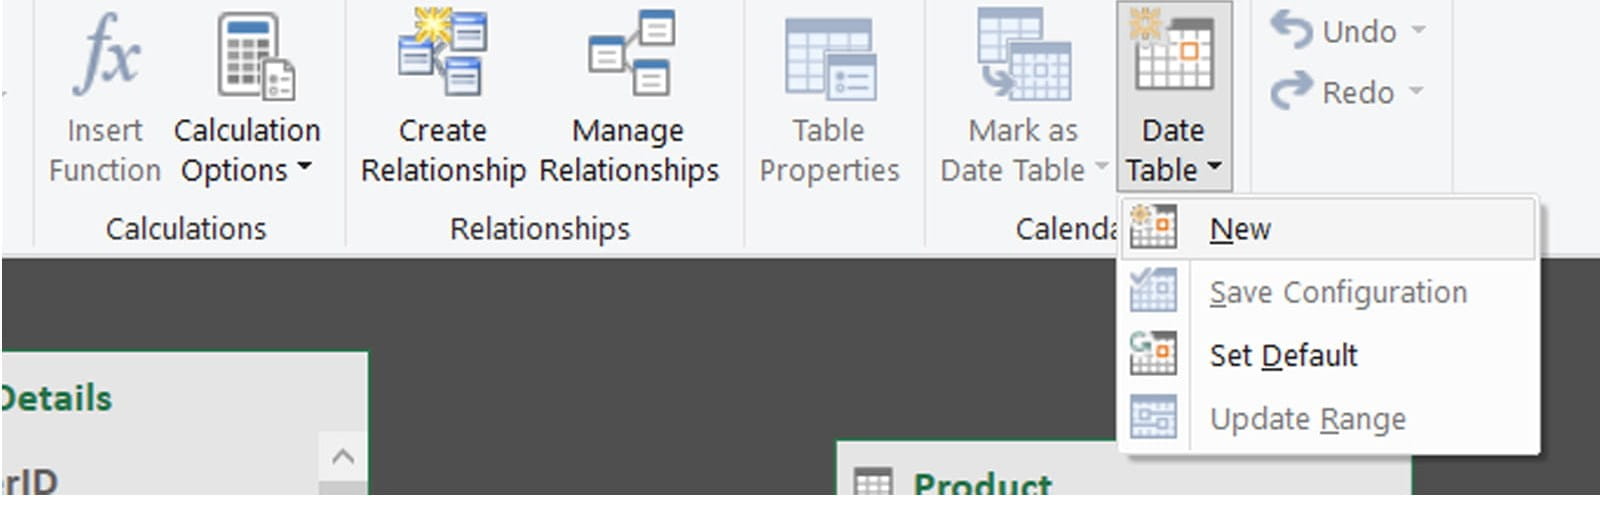
We can create a Date table from Design => Date Table => New:
It will look like this:
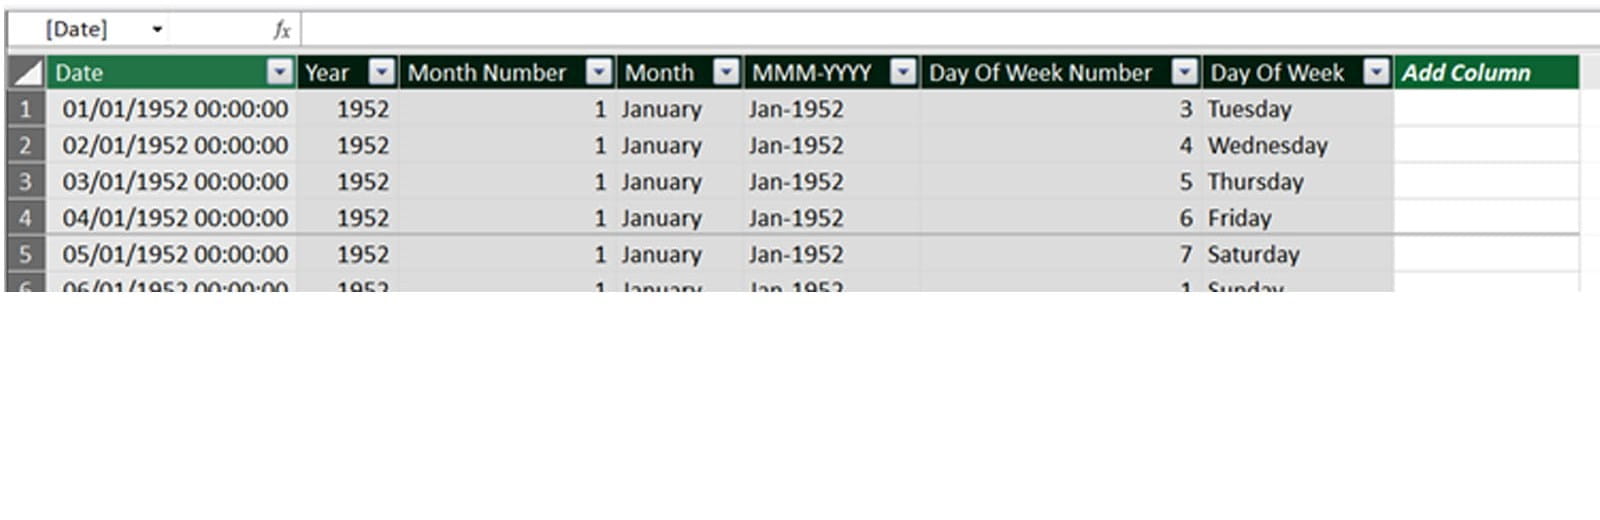
All these fields are automatic – and the dates are automatically filled in, too. The start date is the beginning of the earliest year in the dataset, which is 1952, the year of birth of our oldest salesperson. You can add new columns to this (or any other!) table, much like a Calculated Field in a traditional PivotTable, by entering a formula to the right – in case you needed something else, like the week number.
We need to connect this table to the rest of our data – and as each order has an OrderDate, a RequiredDate, and a ShippedDate, we need to pick which to connect to. OrderDate makes the most sense, and once that is done we can then include these date elements when building PivotTables:
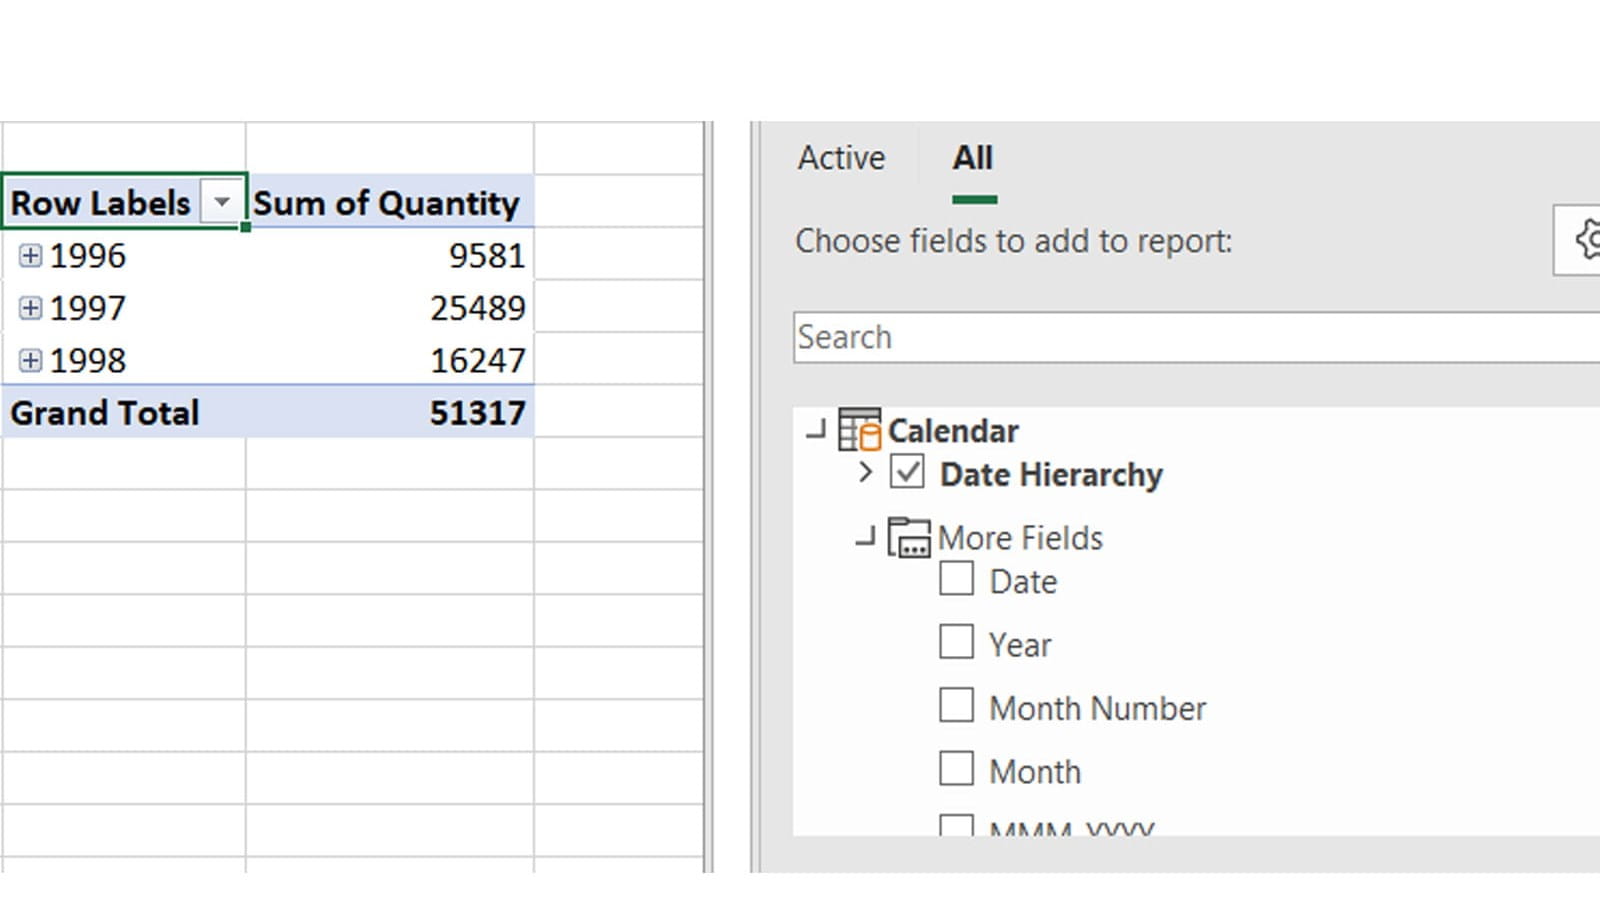
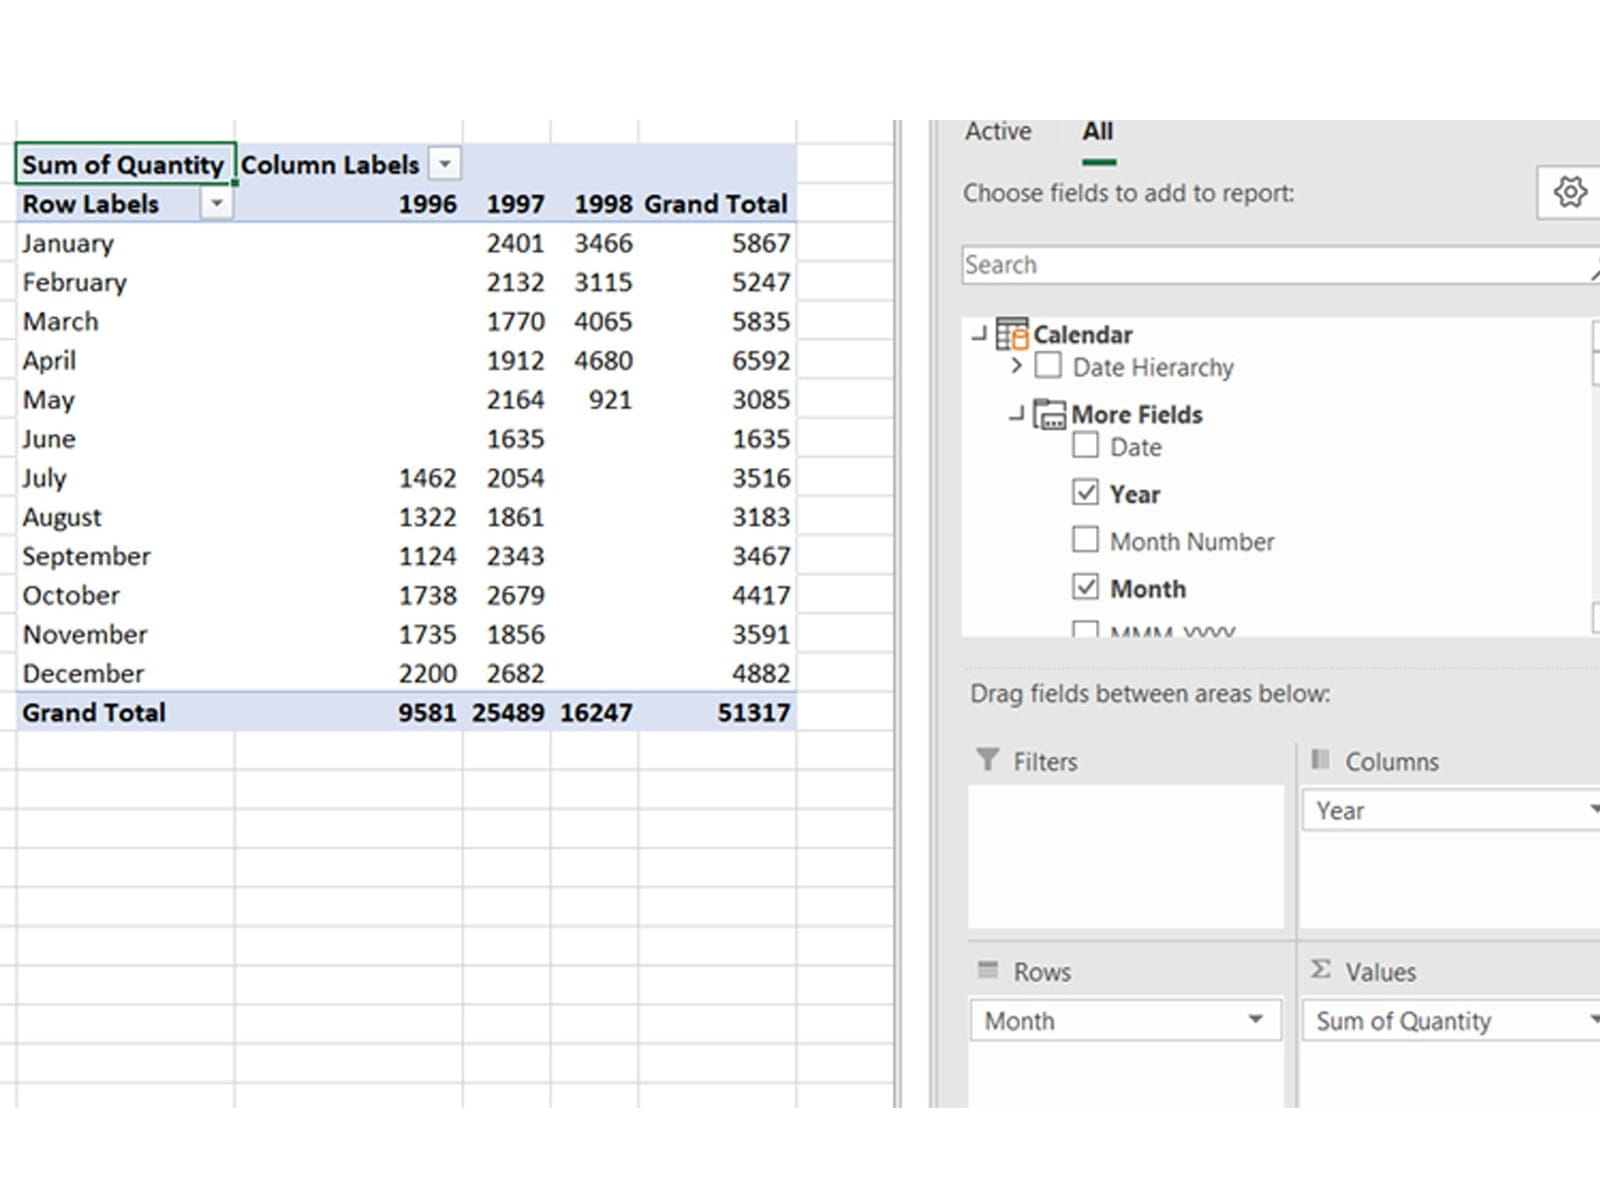
This special “Date Hierarchy” field allows you to expand & collapse years, months, and days separately, and is automatically available with a Calendar table. You can also use the specific columns of the Date table individually if you prefer. You can even split them into different areas of the Pivot:
Next time, we’ll take a look at Measures and KPIs – Power Pivot’s tools for creating flexible and dynamic analyses of your data.
Excel community
This article is brought to you by the Excel Community where you can find additional extended articles and webinar recordings on a variety of Excel related topics. In addition to live training events, Excel Community members have access to a full suite of online training modules from Excel with Business.

Archive and Knowledge Base
This archive of Excel Community content from the ION platform will allow you to read the content of the articles but the functionality on the pages is limited. The ION search box, tags and navigation buttons on the archived pages will not work. Pages will load more slowly than a live website. You may be able to follow links to other articles but if this does not work, please return to the archive search. You can also search our Knowledge Base for access to all articles, new and archived, organised by topic.
