Our chart of the week is on the composition of households in the UK in 2025 and how they compare with the start of the century.
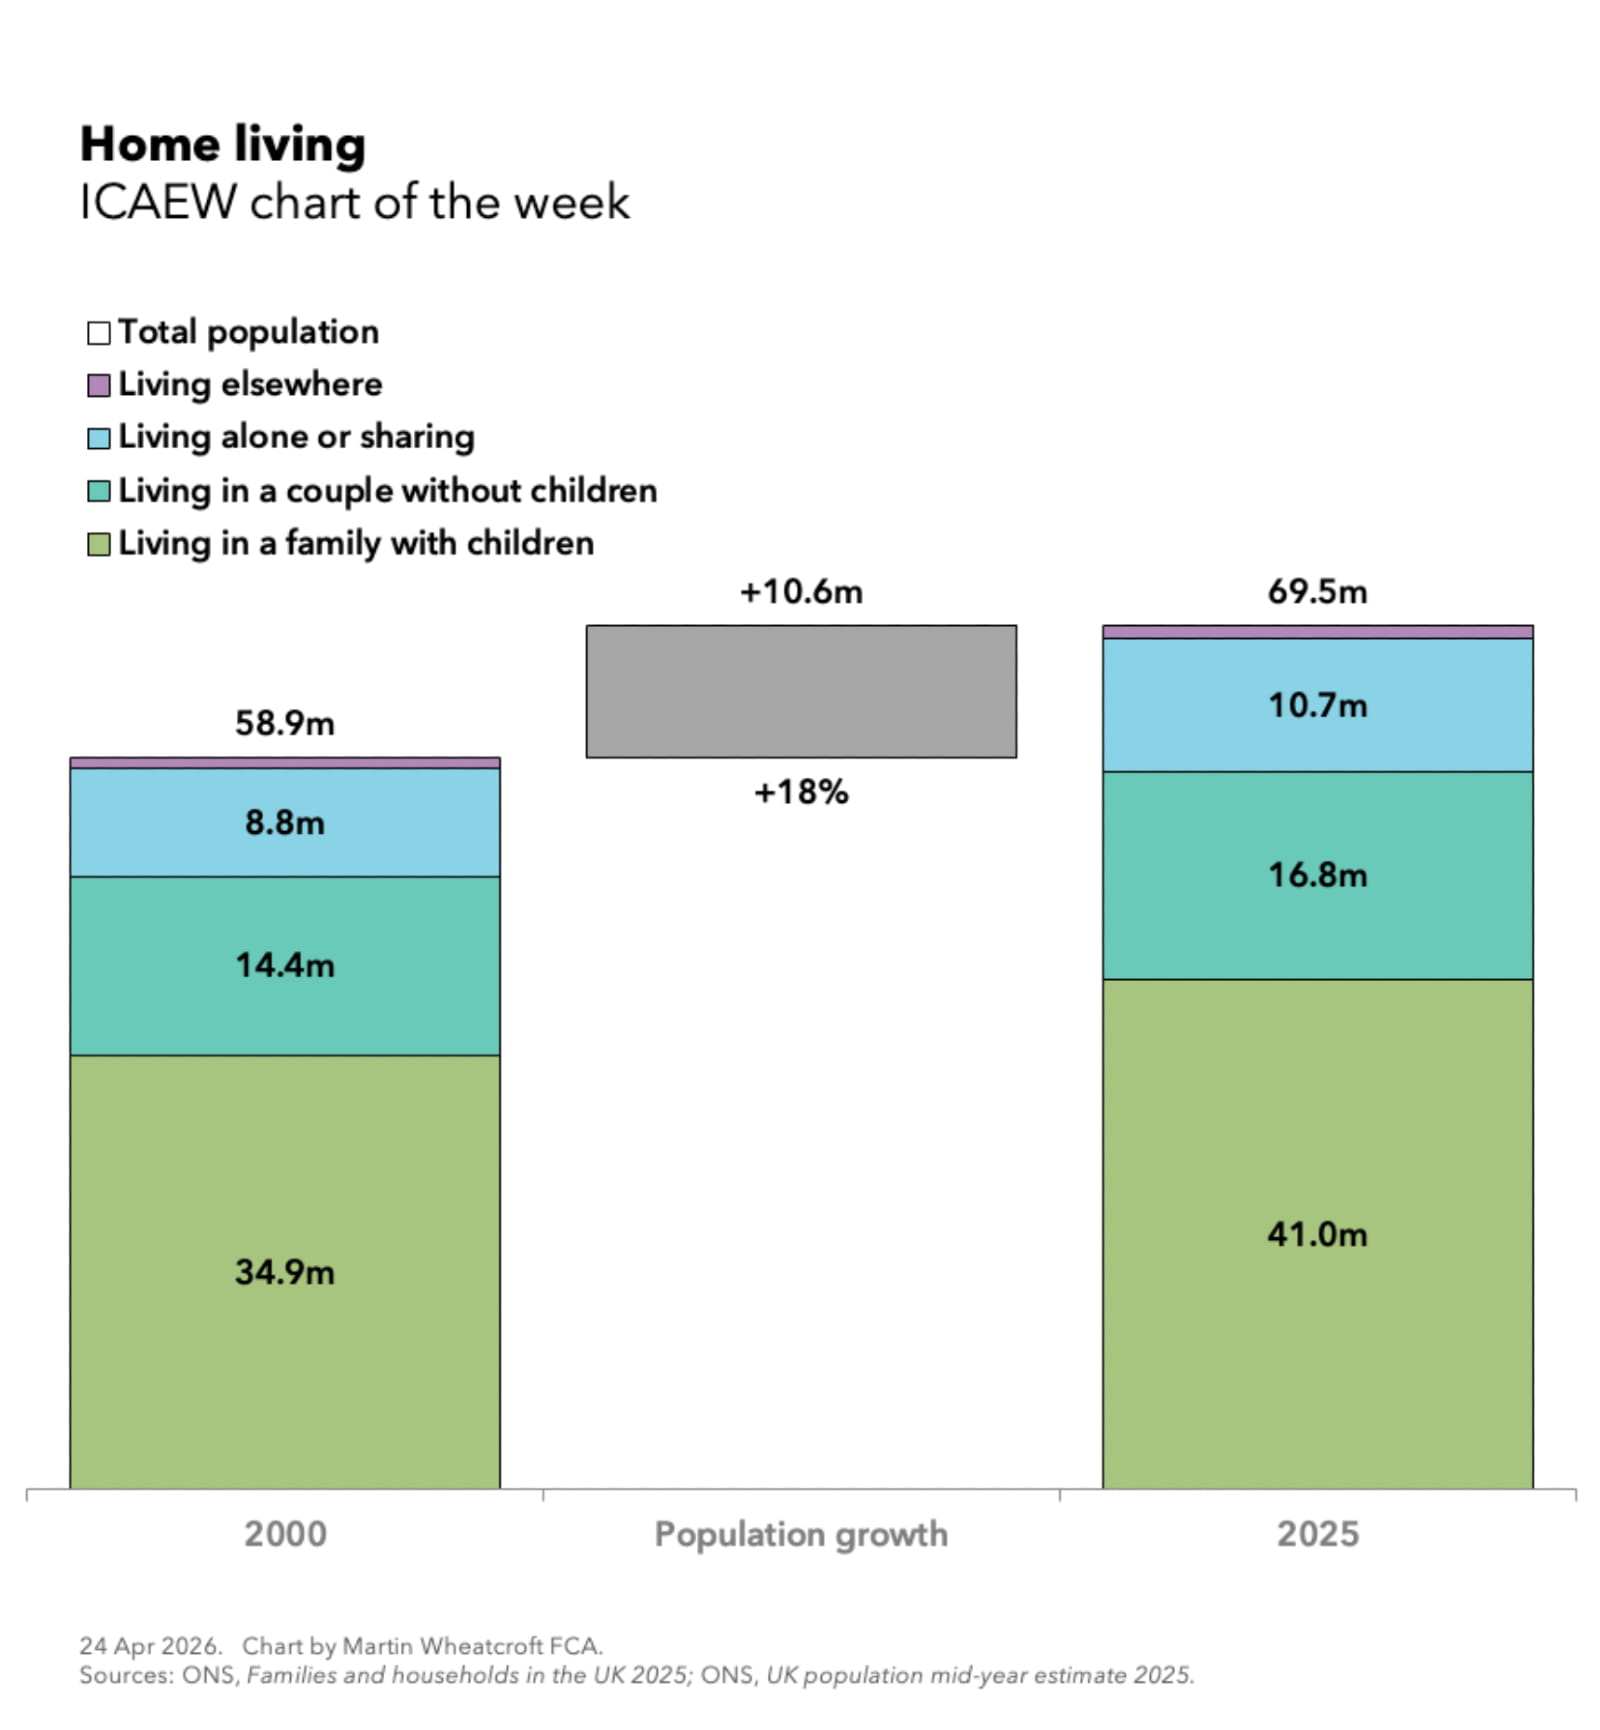
According to the Office for National Statistics (ONS), the total population of the UK in 2000 was 58.9m people, increasing by 10.6m or 18% to 69.5m people in 2025. The ONS also analyses the different types of family groupings for the 58.1m people living in households in 2000 and 68.5m in 2025.
As our chart illustrates, the 34.9m people living as part of a family with children or in multi-family households in 2000 rose by just over 17% to 41.0m in 2025, while the 14.4m people living as part of couples with no children in 2000 increased by just under 17% to 16.8m in 2025. The 8.8m people living alone or sharing with unrelated adults in 2000 increased by 22% to 10.7m while the number of people living elsewhere (generally in community establishments) rose by 0.8m people in 2000 to 1.0m in 2025.
The 34.9m and 41.0m people living as part of a family with children or in multi-family houses in 2000 and 2025 respectively can be analysed between 17.0m and 20.2m living in households headed by a couple with one or two dependent children, 5.5m and 5.0m headed by couples with three or more dependent children, 5.2m and 6.3m headed by couples with non-dependent children only, 6.3m and 8.2m in families headed by lone parents, and 0.9m and 1.3m in multi-family households.
The 8.8m and 10.7m people living alone or sharing in 2000 and 2025 comprise 7.0m and 8.6m living alone and 1.8m and 2.1m sharing with unrelated adults.
The ONS does not give an analysis of the 0.8m and 1.0m living elsewhere in 2000 and 2025, but data from the 2021 census for England and Wales suggests that approaching half live in educational accommodation (student halls and boarding schools) and around a third live in care homes, with the balance in prisons, on military bases, in temporary accommodation, in hospitals, and within religious establishments among other types of accommodation.
Analysing the changes
As a proportion of the total, there has been a 0.4 percentage point decline in the proportion of people living as part of a family with children from 59.4% to 59.0% over the last 25 years and a 0.3 percentage point decrease in the proportion living in couples without children from 24.4% to 24.1%. Meanwhile, the proportion living alone or sharing increased by 0.5 percentage points from 14.9% to 15.4% and the proportion living elsewhere increased by 0.2 percentage points from 1.3% to 1.5%.
Within these categories there were some bigger demographic shifts, reflecting a falling birth rate and people living longer, diverging from the 18% increase in the size of the overall population over 25 years. These include a 9% drop in the number of people living in couple households with three or more dependent children, from 5.5m in 2000 to 5.0m in 2025; a 30% increase in the number of people over the age of 65 living alone, from 3.3m in 2025 to 4.3m in 2025; and a 30% increase in the number of lone parent families, from 6.3m to 8.2m, with the latter driven by a 77% increase in the number of lone-parent families with non-dependent children only from 1.6m to 2.8m.
So, while the overall picture hasn’t changed that dramatically, there is a lot going on under the surface.
Latest charts
Further resources
ICAEW Community

Public Sector Community
The go-to place for guidance on issues affecting finance professionals working in and with the public sector. With a range of dynamic services, ICAEW provides valuable tools, resources and support tailored to the public sector.
ICAEW support

Training and events
Browse upcoming and on-demand ICAEW events and webinars offering support on technical areas, such as assurance, reporting and tax, as well as personal development.
Events and webinars A-Z of coursesLocal government finance

Skills for the future
Improving financial skills is critical in balancing the books and delivering value for citizens. As backstop dates for audited accounts come into force, ICAEW explores how local authorities can strengthen their approach to financial management.
Browse resources