Key takeaways
- Importance of Excel's IF function: Excel’s IF function is a foundational financial modeling tool used to build conditional logic and dynamic scenario testing in spreadsheets.
- Risks of IF function overuse: Overusing complex or deeply nested IF formulas can make financial models fragile, difficult to audit, and prone to calculation errors.
- Supported IF function output types: The IF function in Excel can return multiple data types based on logical tests, including text strings, numerical values, dynamic calculations, or blank outputs.
- Best use cases for the IF function: The IF function works best for simple binary choices or scenarios with only a few potential outcomes; complex multi-condition logic is better served by IFS, SWITCH, or XLOOKUP.
For many Excel users, IF is the first function they ever learn. It is easy to understand, even for a basic Excel user, and brings a whole new world of flexible logic to your modelling fingertips.However, it’s also the most over-used function in Excel. There’s a tipping point for modellers where the use of IF goes from making an Excel model really dynamic to making it clunky, hard to understand and unreliable.
That’s what we’re going to explore.
Anatomy of an IF statement
The structure of an IF formula is:
=IF(logical_test, [value_if_true], [value_if_false])
That may look technical, but the concept is simple:
If something (a logical test) is true, do one thing. Otherwise, do something else.
For example:
=IF(F2>=0,"Positive","Negative")
Excel checks whether the value in cell F2 is greater than or equal to 0.
- If it is, Excel returns “Positive”
- If it isn't, Excel returns “Negative”
Every IF formula starts with a logical argument that will return either a TRUE or FALSE value. You choose what happens after that.
IF returns more than just text
A popular misconception about IF is that it only returns words such as "Yes" and "No".
In reality, IF can return almost anything.
Text:
=IF(F2>100, "High", "Low")
Numbers:
=IF(F2>100, 100, 0)
And calculations:
=IF(F2>100, J2*10% ,0)
=IF(F2>100, SUM(B2:E2), AVERAGE(B2:E2))
In that last example, Excel will perform two different calculations, depending on the number in cell F2. If it’s greater than 100, Excel will SUM the contents from B2:E2, and if it isn’t greater than 100, Excel will calculate the AVERAGE of the contents of cells B2:E2.
This is what makes IF so versatile. You’re not limiting your model logic to a single output but layering it in two completely different logical pathways.
Creating blank outputs
Not every IF statement needs to return a visible result when the answer is FALSE.
For example:
=IF(A2>100,"Review Required","")
The two quotation marks at the end of the formula represent an empty text string.
If the condition is not met, Excel displays what appears to be a blank cell.
This is a common technique in reports and dashboards because it avoids filling worksheets with unnecessary labels, zeros or other distracting values.
IF can use TRUE and FALSE directly
It is common to see users write formulas such as:
=IF(D11=TRUE, “On”, “Off”)
However, if D11 already contains a formula that returns either TRUE or FALSE then there’s no need to test it again within the IF function.
With a TRUE or FALSE value in D11, you can simply write:
=IF(D11, “On”, “Off”)
This works because IF only needs a logical answer.
- If D11 is TRUE, Excel returns “On”
- If D11 is FALSE, Excel returns “Off”
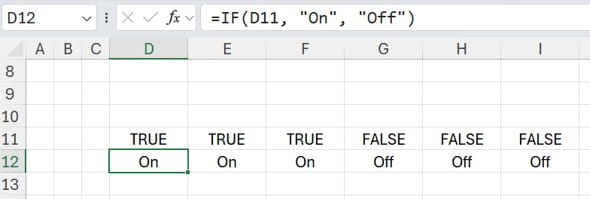
It is a small change, but it makes formulas shorter and reinforces an important Excel concept: many formulas already return TRUE and FALSE values that can be used directly in other calculations.
When IF gets too complicated
IF is excellent when there are only a few possible outcomes.
Problems arise when IF statements start becoming deeply nested.
Let’s look at a grading example:
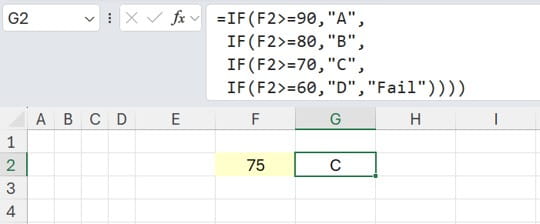
This formula works perfectly well.
The problem is one of maintenance. As more outcomes are added, reviewing and updating the formula becomes increasingly difficult.
A more scalable approach is to create a lookup table:
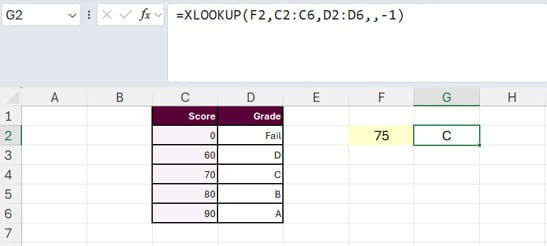
The screenshot features a lookup function:
=XLOOKUP(F2,C2:C6,D2:D6,,-1)
The logic becomes easier to update and for others to understand.
Using IF to build financial model flags
One of the most common uses of IF in financial modelling is the creation of flags.
A flag is a binary value used elsewhere in the model to control calculation behaviour.
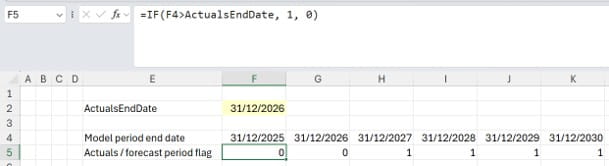
In the screenshot we have a model with six annual periods extending from column F to K. Actual financial results are available up to the end of the 2026 calendar year, after which forecast assumptions and calculations take over.
We have given cell F2 a range name, ActualsEndDate, and in cell F5 we have written:
=IF(F4>ActualsEndDate, 1, 0)
which we can copy across each period on row 5 of our model’s timeline.
This returns:
- 0 for actuals periods
- 1 for forecast periods
This flag can then drive other calculations throughout the model. For example:
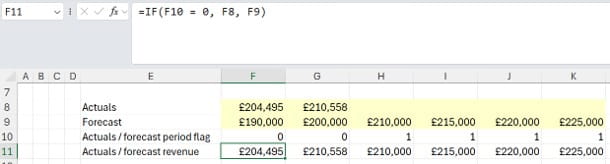
Now our calculation in row 11 is consistent across the timeline and will dynamically update to show actuals revenue when the period’s flag is 0, or forecast revenue when the period’s flag is 1 – and these flags depend on the date in ActualsEndDate.
The benefit of such an approach is the clarity and consistency it brings to the model. Anyone reviewing the workbook can immediately see what the model is doing, and it can be quickly rolled forward in future months when more actuals data arrives.
There may be shorter ways to write the formula, but sometimes readability is more important than saving a few characters.
IF remains one of the most valuable functions in Excel. It allows us to build flexibility into our model logic in a way that’s easy to follow. But you need to know when to stop using it and when other functions offer better solutions.
Excel tips and tricks
ICAEW's Excel Community shares regular Tips & Tricks on how to get the best out of this key accountancy tool. See all their posts by topic, and by level in the Spreadsheet Competency Framework.

You may also be interested in
ICAEW Community

Excel
Do you use Excel in your organisation? Are you using it to its maximum potential? Develop your skills and minimise spreadsheet risk with our Excel resources. Join the Excel Community
ICAEW Certificate

Analytics in Power BI
Gain essential data analytics skills and advanced reporting techniques to stay ahead of industry demands with this practical qualification from ICAEW.
Find out moreICAEW support

Training and events
Browse upcoming and on-demand ICAEW events and webinars focused on making the most of the latest technologies.
Events and webinars CPD courses and more