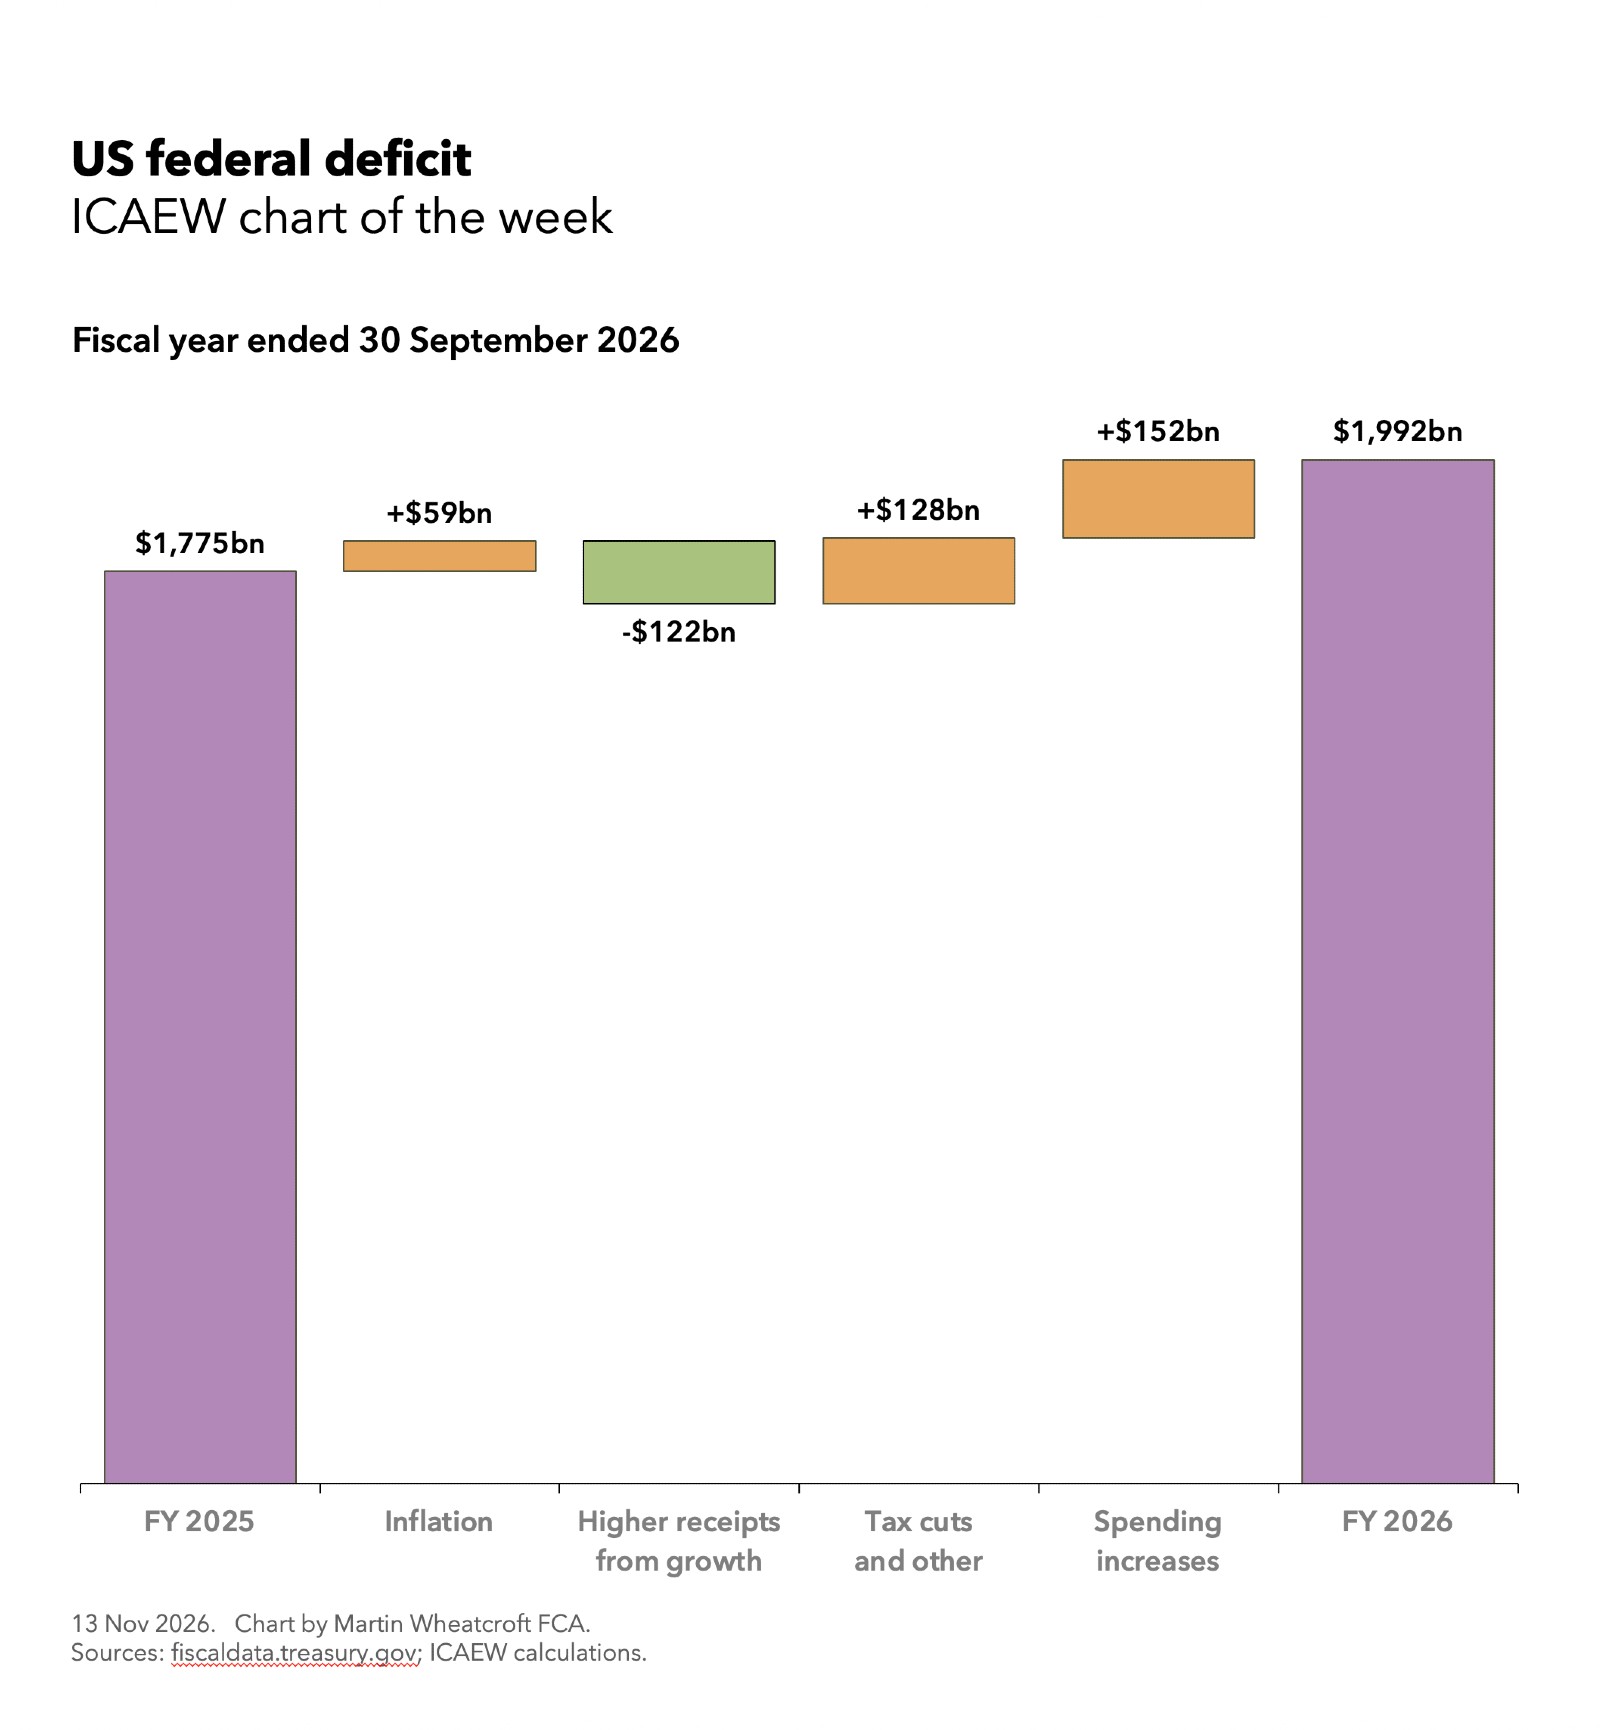
Our chart this week looks at how the US federal deficit of $1,775bn in the fiscal year ended 30 September 2025 (FY2025) increased to $1,992bn in the fiscal year ended 30 September 2026 (FY2026). This is based on numbers published by the US Department of the Treasury and the Bureau of the Fiscal Service.
Inflation of 3.3% contributed to a net $59bn of the increase, while the effect of economic growth of 2.3% on receipts reduced it by $122bn. Tax cuts, tariff refunds and other movements in receipts added $128bn, while spending increases added $152bn.
The resulting deficit of $1,992bn is equivalent to 6.2% of GDP, bringing total debt to $40.2tn or 125% of GDP on 30 September 2026. Of this, $32.4tn or 101% of GDP is debt held by the public, while $7.8tn or 24% of GDP is intragovernmental debt owed to federal trust funds and programmes, including social security.
Changes in receipts
Total receipts of $5,235bn in FY2025 (not shown in the chart) increased by $174bn for inflation and $122bn for economic growth and reduced by $128bn from tax cuts and other movements in receipts to reach $5,403bn in FY2026.
The net reduction of $128bn in tax receipts (after adjusting for inflation and economic growth) included a reduction in corporate income tax of $96bn (mainly because of tax cuts), custom duties of $33bn (reflecting a large increase in tariffs that were more than offset by refunds for tariffs ruled unconstitutional), employment and retirement contributions of $27bn, and other taxes and receipts of $19bn. This was offset by a net increase after inflation and economic growth in individual income taxes of $39bn and estate and gift taxes of $8bn.
Changes in outlays
Total outlays of $7,010bn in FY2025 increased by $233bn for inflation and $152bn in spending increases to reach $7,395bn in FY2026.
The $152bn net increase after inflation included health programmes up $57bn, debt interest up $49bn, Social Security up $34bn, education, training, employment and social services up $34bn, veterans benefits and services up $27bn, justice up $22bn, defence up $18bn and other increases of $16bn. These were offset by spending reductions in natural resources and environment of $34bn (mainly in cuts to the Environmental Protection Agency), income security of $31bn (including cuts to food stamps and other support programmes), community and regional development of $25bn and other reductions of $15bn.
Overall, spending increased by $11bn less than it would have been if it had risen in line with economic growth.
Bringing the fiscal deficit down
The most recent 10-year fiscal projections from the Congressional Budget Office (CBO) in February 2026 were for a net deficit of $1,853bn or 5.8% of GDP in FY2026 and $1,887bn or 5.7% of GDP in FY2027, rising to $2,080bn or 6.0% of GDP in FY2028 and $3,115bn or 6.7% of GDP in 2036.
These projections see debt held by the public rising from $32.1tn or 101% of GDP on 30 September 2026 to $46.7tn or 120% of GDP on 30 September 2036.
Bringing the federal government’s finances under control will be one of the many challenges awaiting the recently elected members of the 120th Congress, with the CBO working on a report to be released in December 2026 on options they might want to consider.
Latest charts
Stay up to date
You can receive regular email updates from ICAEW insights, including weekly or monthly enewsletters. Subscribe to whichever works for you.
Sign upFurther resources
ICAEW Community

Public Sector Community
The go-to place for guidance on issues affecting finance professionals working in and with the public sector. With a range of dynamic services, ICAEW provides valuable tools, resources and support tailored to the public sector.
Resources

Economy explainers
ICAEW experts offer simple guides to help understand the technical, economic jargon that is discussed when talking about public finances and the economy.
Find out moreICAEW support

Training and events
Browse upcoming and on-demand ICAEW events and webinars offering support on technical areas, such as assurance, reporting and tax, as well as personal development.
Events and webinars A-Z of courses