Observing the impact of operational and economic changes without experiencing them in reality can offer useful analysis. Jonathan Swan explains how to set up a helpful budgeting model using Excel.
The objective in using a spreadsheet for budget projections is to test our assumptions about operational and economic parameters and observe their impact on financial results. We use the terms ‘sensitivity analysis’ and ‘scenario management’ to describe these techniques.
But what should we expect such a model to do? There are three essential elements to a budgeting model: the ability to run and control the inputs for sensitivity and scenario analysis; robust formulas to manage changes to the inputs; and the means to compare the results from different sensitivities and scenarios.
It may be helpful to define sensitivity analysis as the process of testing one or two key variables linked by the word ‘or’. For example: the effect of increasing sales by 5% OR reducing costs by 10%.
Scenarios, however, involve the manipulation of several variables linked by the word ‘and’. For example: increasing sales AND reducing costs AND decreasing headcount.
To help explain these modelling techniques I’m using a single example, also pictured in the screen shots seen here. We will also comply with the modelling standards described in ICAEW’s Twenty Principles for Good Spreadsheet Practice.
Top-down approach
It is unlikely I will be asked to show my calculations, or assumptions, but I will need to show the forecast results.
Setting up inputs
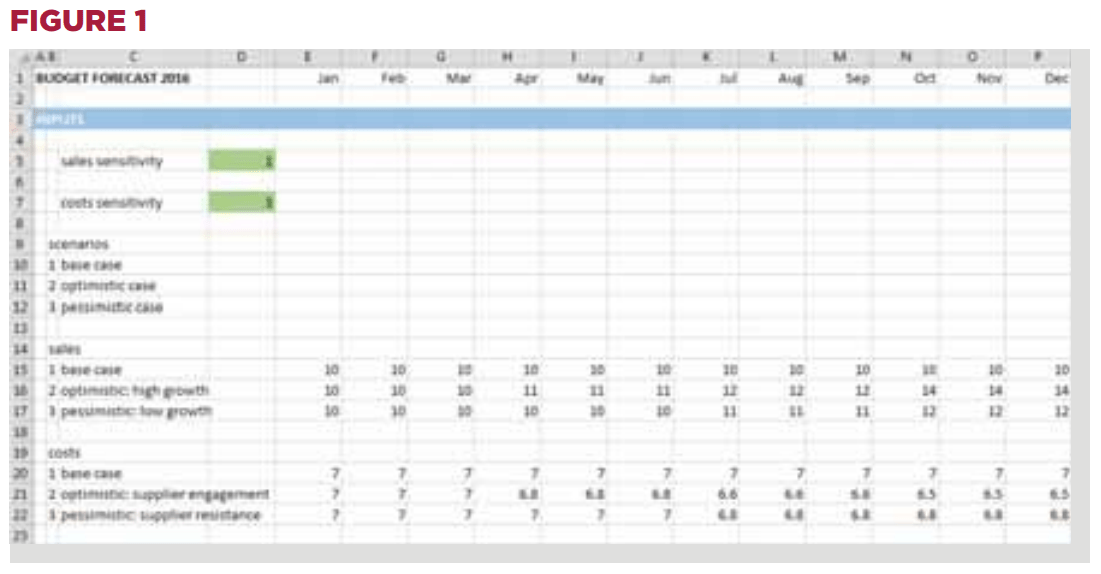
At the top of the inputs section we put the number 1 into a cell. This will be used to drive the sensitivities. We then list and number the scenarios.
The simplest way to set up the model for sensitivity or scenario analysis is to set up rows of inputs (Figure 1). These can be properly documented and the source of the assumptions recorded. In this example, we will assume three scenarios for each of sales and costs – labelled base case, optimistic and pessimistic. For now, we will also assume the base case scenario means that we will use the base case values for sales and costs. Each row is numbered; for consistency, each is set up in the same way. An extension is to add a further row for actual results, which can be entered as the figures become available.
Formulating workings
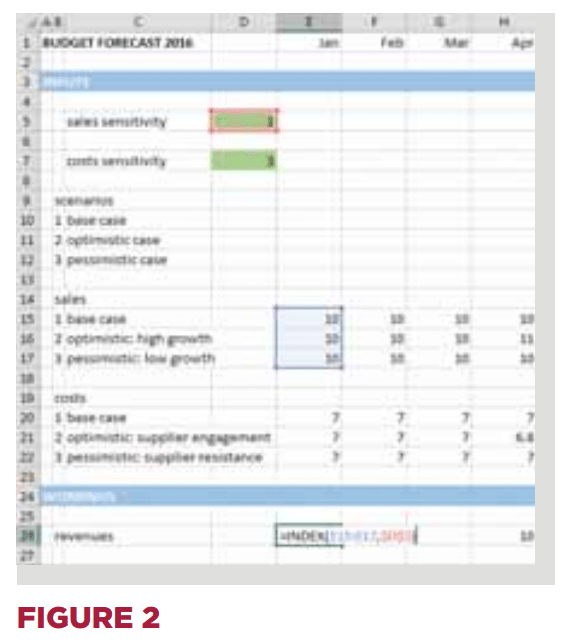
We can use the Excel INDEX function to drive the calculations (Figure 2). The syntax of the function is that INDEX will look in a range, at a position.
With the sales example, there are three values arranged vertically. We want to show the value in position n, where n is the value in the scenario cell. Write the formula as INDEX (three cells above, scenario cell) substituting cell references as required.
Test the operation of the scenario cell by changing the value. The INDEX functions should pick up the correct number in the list.
User control
At the moment, there is nothing to prevent you or anyone else from typing any value into the scenario cell. We can restrict this by using Excel’s Data Validation (Figure 3).
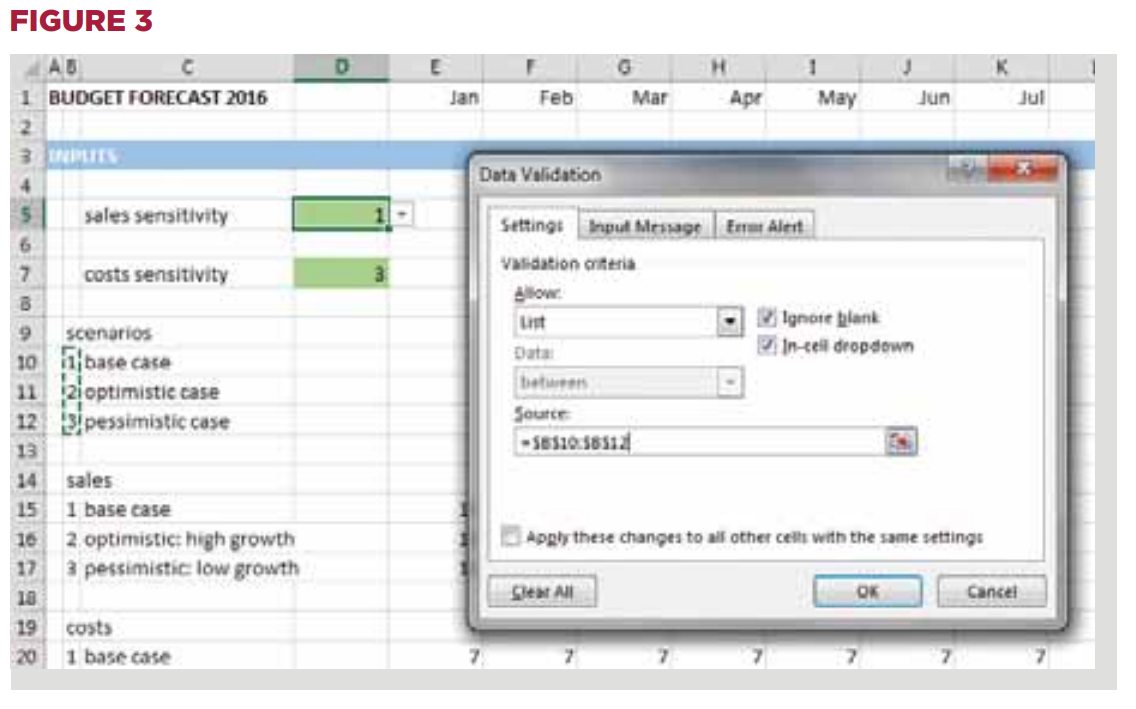
Select the scenario cell and on the Data tab, select Validation. In the Data Validation dialog box, under Validation criteria, select Whole number from the dropdown list and specify the minimum value as 1, and the maximum as 3. Click OK. Now try typing a different number into the scenario cell and Excel will prevent you from doing so.
If you have typed the scenario numbers next to the scenario descriptions in the inputs section, you can take this one step further.
In the Data Validation dialog box you can also set the Validation criteria to List and specify the Source as the group of three cells containing the scenario numbers. Back in the worksheet you should see a dropdown indicator on the scenario cell; when you click on it, you can select the scenario number from the list.
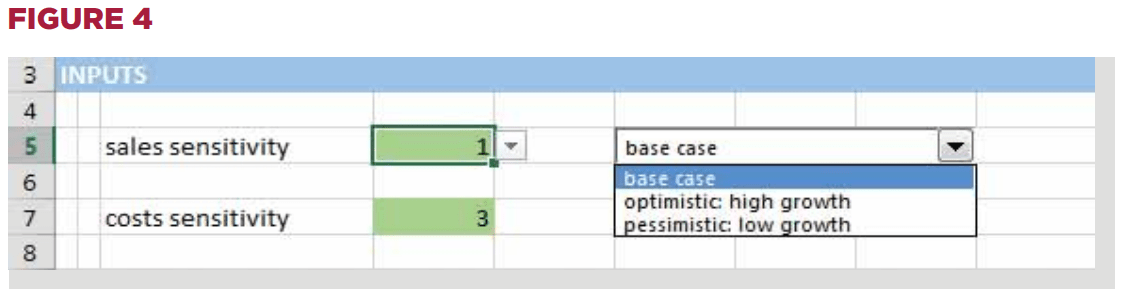
The disadvantage of the Whole number or List approaches is that the user has to enter or select a number, the meaning of which may or may not be apparent.
To really impress your colleagues you can set up a combo box (Figure 4). This requires access to the Developer tab which is not always instantly displayed in Excel. To switch this on, use File, Options, Customize Ribbon, check the Developer box in the list of Main Tabs, and then click OK.
Once this is done, click on the Developer tab and then click on the Insert tool, from which you should select the Combo Box (Form Control). Your mouse pointer is now a cross hair, so click and drag – two adjacent cells should be sufficient – and let go.
You now have a combo box in your worksheet. To make it work, right-click and choose Format Control. In the dialog box specify the Input range as the three cells containing the descriptions of the scenarios, and the Cell link as the original scenario cell.
When you click OK you should see all your INDEX formulas fill up with #VALUE! errors, because the combo box has not yet been used. If you now click on the combo box, this time you will see the scenario descriptions. When you make a selection, Excel will enter the position of the item in the list into the scenario cell, not the text.
The combo box result is put into the scenario cell, which is still using data validation. This can be removed by opening the Data Validation dialog box and choosing Clear All. It may be helpful to position the combo box on top of the scenario cell to avoid confusion.
Generating outputs
Running the scenario or sensitivity is now simple. Too simple, in fact. It may be difficult to notice what, if anything, is changing in the key results.
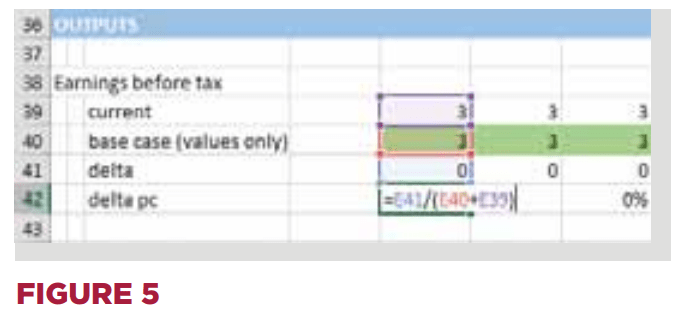
A simple approach is to use the delta technique (Figure 5). A delta, in this context, simply means change, or movement. Variance is probably the correct accounting term. In the output section we have our results formulas. The first step is to run the model, using the base case values. Locate the results and copy them, then paste the values as shown.
This gives us one row linked to the model calculations, and one which is fixed. If the optimistic scenario is run, the differences may be apparent, so a third, delta, line is used to show the differences (current – base). This will give the absolute differences, so we can add a percentage delta line, which can be calculated as delta/(base + current).
You will recognise that for ‘base case’ we could easily substitute in the previous year’s figures, so that the delta is the variance between the forecast and the previous actual figures.
Analysing sensitivities and scenarios
We now have a model set up for scenario analysis, in which the scenario cell drives both the sales and the costs.
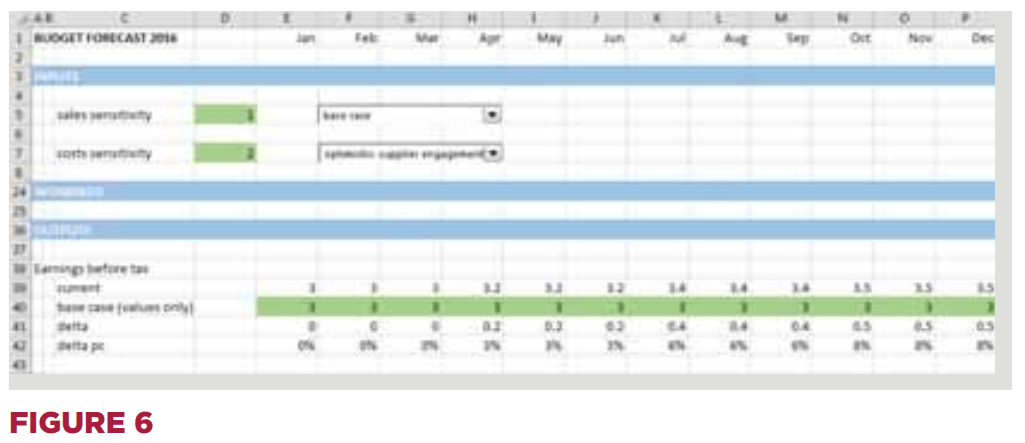
To adapt it for sensitivities, we simply add two further input cells: one for the sales sensitivity and one for the costs sensitivity (Figure 6). Amend the sales INDEX formulas to point to the sales sensitivity cell, and point the costs INDEX formulas to the costs sensitivity cell. Once set up, add two combo boxes.
We can now test the interaction of the base sales case with the optimistic costs case, and so on. We can even see the impact of the pessimistic sales with optimistic costs, as a form of scenario analysis.
This example is very simple, but it is the basis of the large sensitivity modelling used in corporate accounting.
In conclusion
The example here is very simple, but it is the basis of the large and complex sensitivity modelling used in corporate accounting. I would normally use an inputs sheet/ workings sheet/outputs sheet structure, with separate delta sheets. The key features are that the input values can be seen and explained; that reproducibility is built-in; and that the changes can be clearly demonstrated on the outputs.
Nothing is required of the user other than the selection of the appropriate sensitivities.
About the author
Jonathan Swan is director of Operis Group’s training division and his book Practical Financial Modelling: The Development and Audit of Cash Flow Models is in its third edition.
Download PDF version:
- Testing assumptions in Excel
Finance & Management Magazine, Issue 235, September 2015
Related resources
The ICAEW Library & Information Service provides access to leading business, finance and management journals, as well as eBooks.
Further reading on financial modelling and Excel is available through the resources below.
You are permitted to access, download, copy, or print out content from eBooks for your own research or study only, subject to the terms of use set by our suppliers and any restrictions imposed by individual publishers. Please see individual supplier pages for full terms of use.
More support on business
Read our articles, eBooks, reports and guides on Financial management
Financial management hubFinancial management eBooksCan't find what you're looking for?
The ICAEW Library can give you the right information from trustworthy, professional sources that aren't freely available online. Contact us for expert help with your enquiries and research.
-
Update History
- 08 Sep 2015 (12: 00 AM BST)
- First published
- 14 Nov 2022 (12: 00 AM GMT)
- Page updated with Related resources section, adding further reading on financial modelling and Excel. These provide fresh insights, case studies and perspectives on this topic. Please note that the original article from 2015 has not undergone any review or updates.
