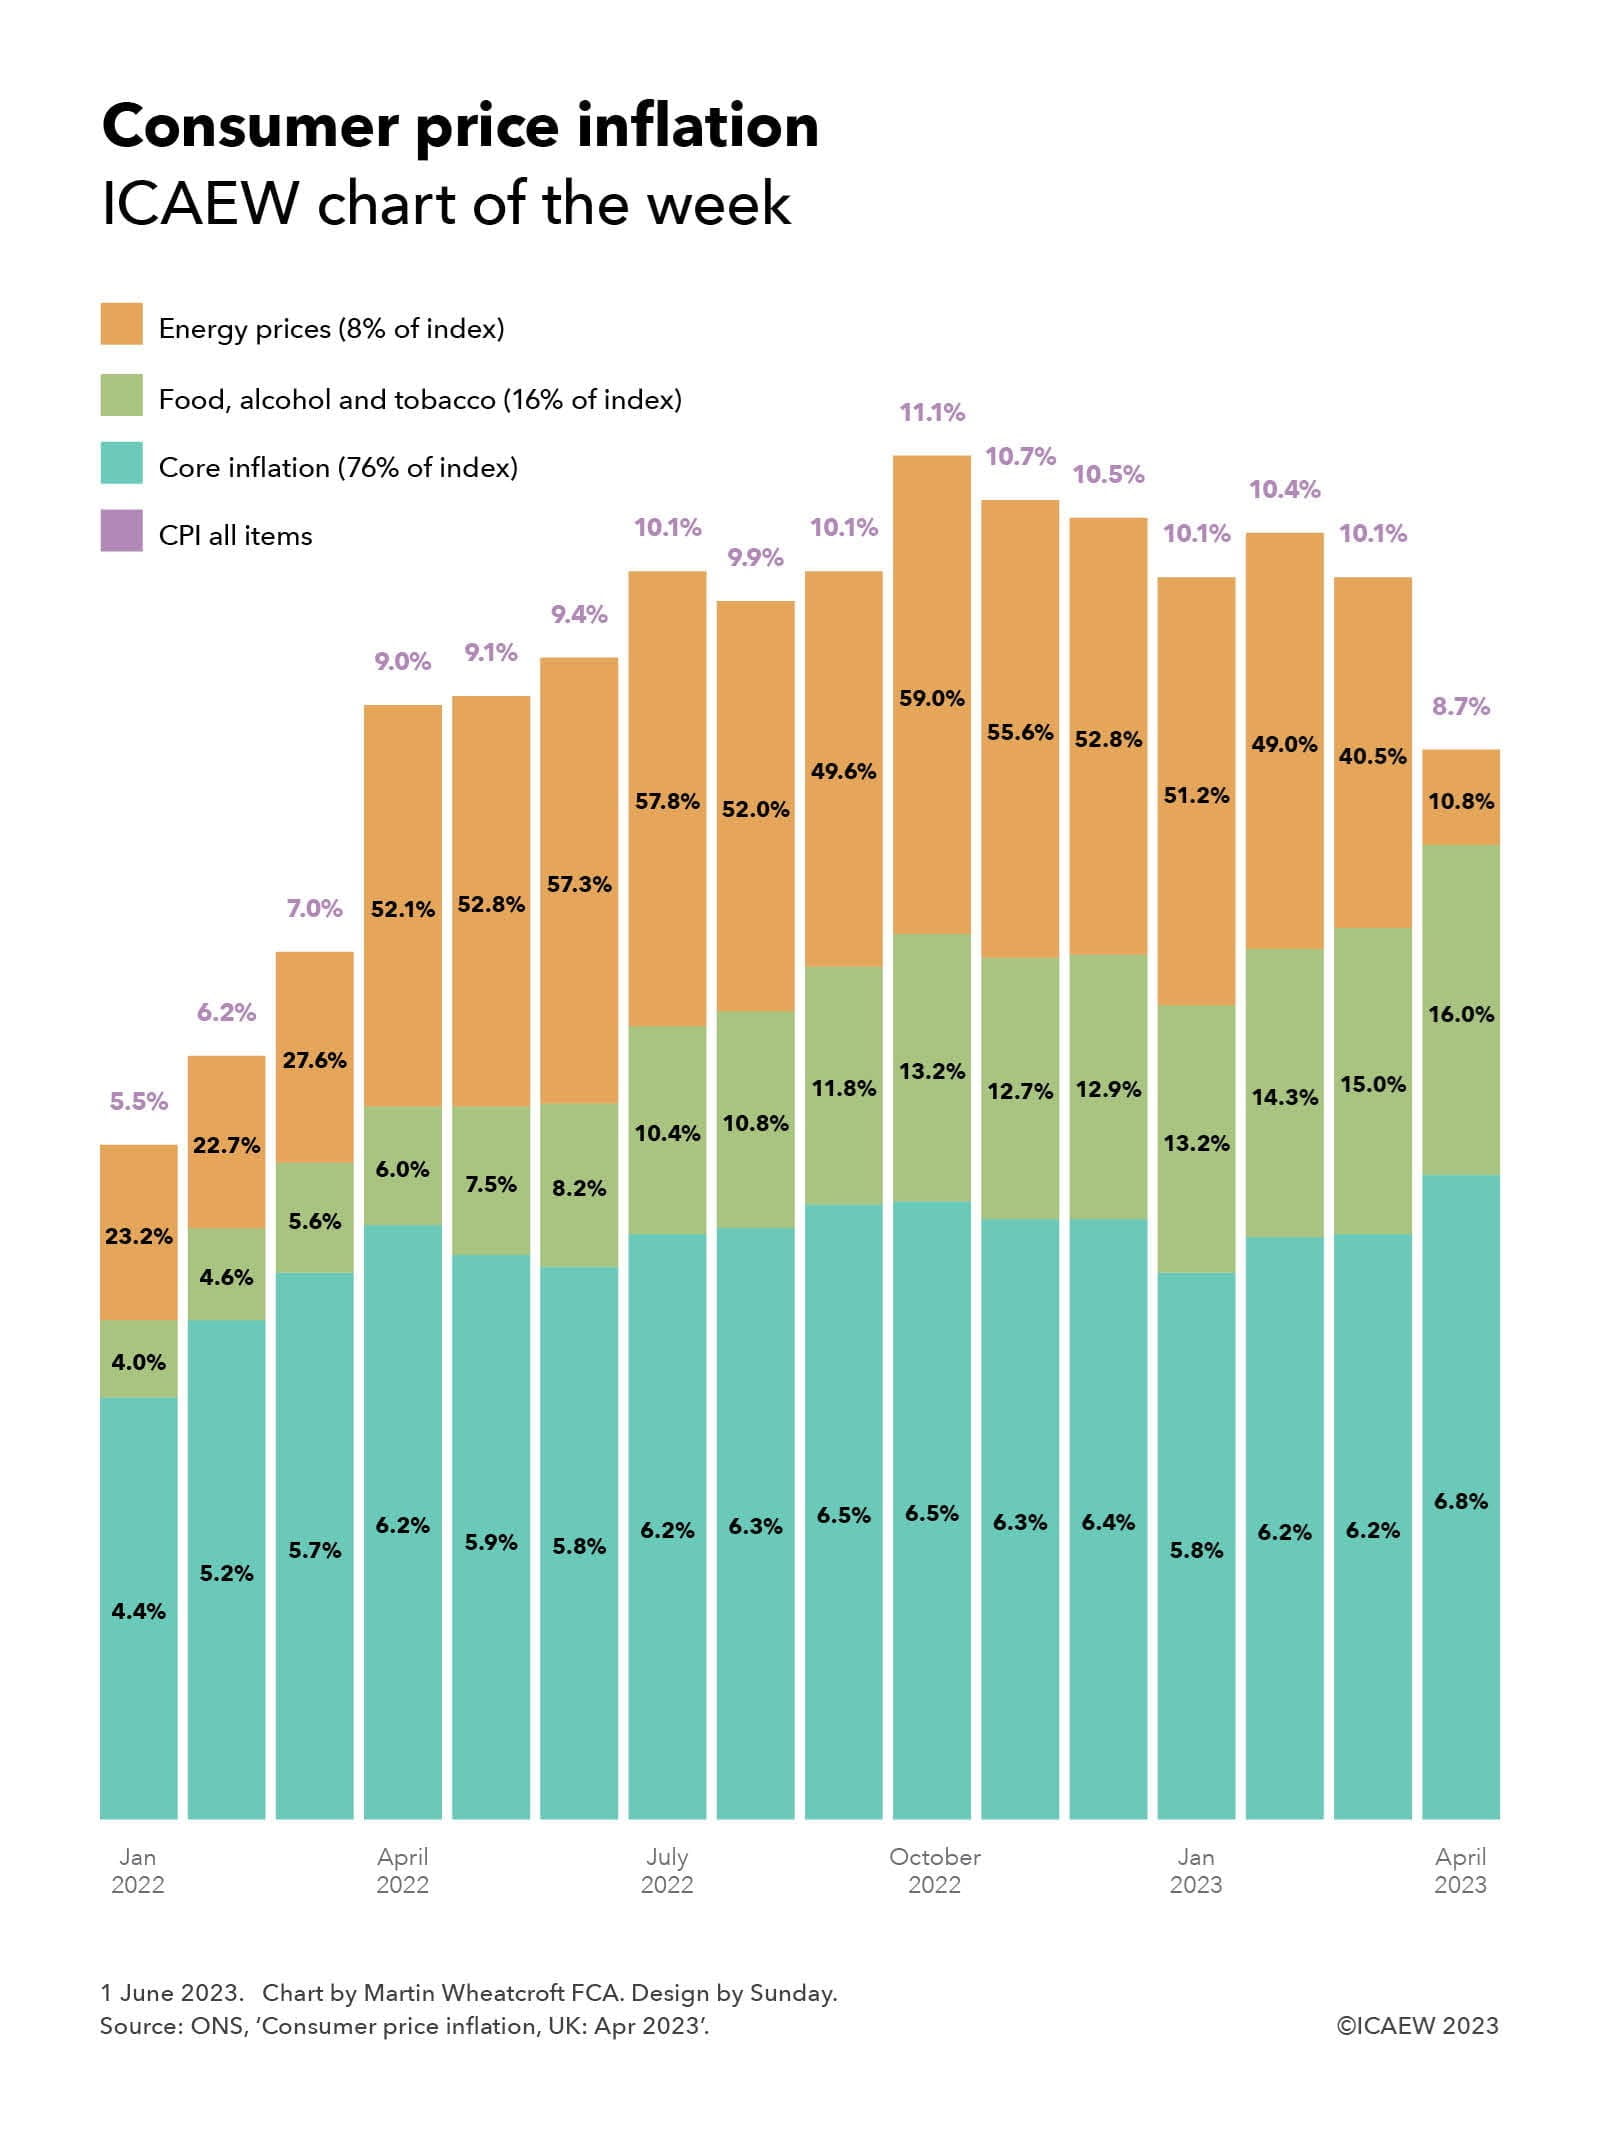
The annual rate of consumer price inflation (CPI) fell from 10.1% in March 2023 to 8.7% in April 2023, but this fall was not considered very good news by economists, policymakers or the financial markets.
The response to April’s inflation statistics has been dramatic, with financial markets now predicting that the Bank of England could increase its base interest rate to as much as 5.5%, instead of sticking at the 4.5% rate announced in May that many commentators had previously suggested might be the peak needed to bring inflation under control.
The reasons why there are these concerns can be illustrated by our chart this week, which analyses CPI into three component sub-indices: energy price inflation, food, alcohol and tobacco, and core inflation. Our chart highlights how core inflation and the annual rate of food, alcohol and tobacco price rises both unexpectedly increased in April 2023, partially offsetting the anticipated slowdown in energy price inflation as the huge rises in domestic energy costs that took effect in April 2022 fell out of the year-on-year comparison.
Energy price inflation, comprising both domestic energy and fuels such as petrol and diesel, currently represent just 8% of the overall consumer price inflation index, but the rises over the past 15 months have been so large they have contributed significantly to the overall headline CPI rate. Annual energy price inflation in January 2022 was already high at 23.2% as the constrained energy supply drove prices high while the global economy started to recover from the pandemic. This was followed by 22.7% in February 2022 and 27.2% in the year to March 2022, before jumping to 52.1% in April 2022. The annual rate of increase in energy prices remained high over the following months rising to 52.8%, 57.3% then 57.8% in July, 52.0%, 49.6% to a peak of 59.0% in October. The rate of increase decelerated to 55.6%, 52.8% and then 51.2% in January, to 49.0% and 40.5% in February and March 2023, before dropping to 10.8% in April 2023 when compared with the higher base of April 2022.
Food, alcohol and tobacco prices represent about 16% of the CPI index and were 4.0% higher than a year previously in January 2022. Since then the annual rate of increase has gradually increased each month, to 4.6%, 5.6% and then 6.0% in April 2022, to 7.5%, 8.2% and 10.4% in July 2022, and then to 10.8%, 11.8% and 13.2% in October 2022. The annual rate of increase moderated to 12.7% and 12.9% in November and December, before returning to 13.2% in January 2023. The annual rate of price increases accelerated to 14.3% in February, 15.0% in March and to 16.0% in April.
Not shown in the chart is the sub-subindex of food and non-alcoholic beverages, which was running at 19.1% in the year to March 2023 and 19.0% in the year to April 2023, with the jump in April coming from alcohol and tobacco prices, which rose from 5.3% in March to 9.1% in April.
Perhaps more worrying than the jump in alcohol and tobacco prices is what is happening to ‘core inflation’, which is defined as CPI excluding energy, food, alcohol and tobacco. Representing just over three quarters (76%) of consumer spending, annual core inflation was running at 4.4% in January last year, rising to 5.2%, 5.7% and then 6.2% in April 2022, 5.9%, 5.8% then 6.2% in July, 6.3%, 6.5% then 6.5% in October, 6.3%, 6.4% then 5.8% in January, 6.2%, 6.2% and then 6.8% in April 2023.
By excluding more volatile components of the CPI index, core inflation is generally more stable than overall CPI. By hovering within the 5.7% to 6.5% range for the past year, the hope was that core inflation was – while pretty high – at least not out of control. The unexpected rise to 6.8% in April is worrying for the Bank of England, which is concerned that inflation could become embedded into the UK economy at a rate much higher than its 1%-3% mandated target range.
The good news is that planned cuts to domestic energy prices in July, together with other price rises last summer falling out of the year-on-year comparison, should feed through to a much lower headline rate of inflation over the next few months, reducing the pressure on wage settlements and other input costs that are currently driving up prices across the whole economy.
Despite that, the markets believe that further interest rate rises may still be necessary on top of the actions already taken by the Bank of England, potentially risking overtightening that could worsen the cost-of-living crisis and the squeeze on businesses.
Latest charts
Recommended content
ICAEW Community

Public Sector Community
The go-to place for guidance on issues affecting finance professionals working in and with the public sector. With a range of dynamic services, ICAEW provides valuable tools, resources and support tailored to the public sector.
Resource

More economic insight
ICAEW works with Oxford Economics to provide useful insight and timely intelligence for finance professionals and their clients.
Read moreInsights special

Inflation
A closer look at the impact of inflation on people, businesses, accountancy and the wider economy, bringing together the best expert opinion, data and analysis from ICAEW and its members.
Read more