The Office for National Statistics (ONS) is always trying to improve the quality of its statistics, which is why it has been looking again about how it measures labour productivity. For many, the big question is whether this new measure can help solve the productivity puzzle: the significant drop in the rate of productivity growth in the UK since the financial crisis.
The ONS sets out its thinking about the change in a release published earlier this month on the component approach to measuring labour productivity, UK: 1997 to 2024 to be implemented in February 2027.
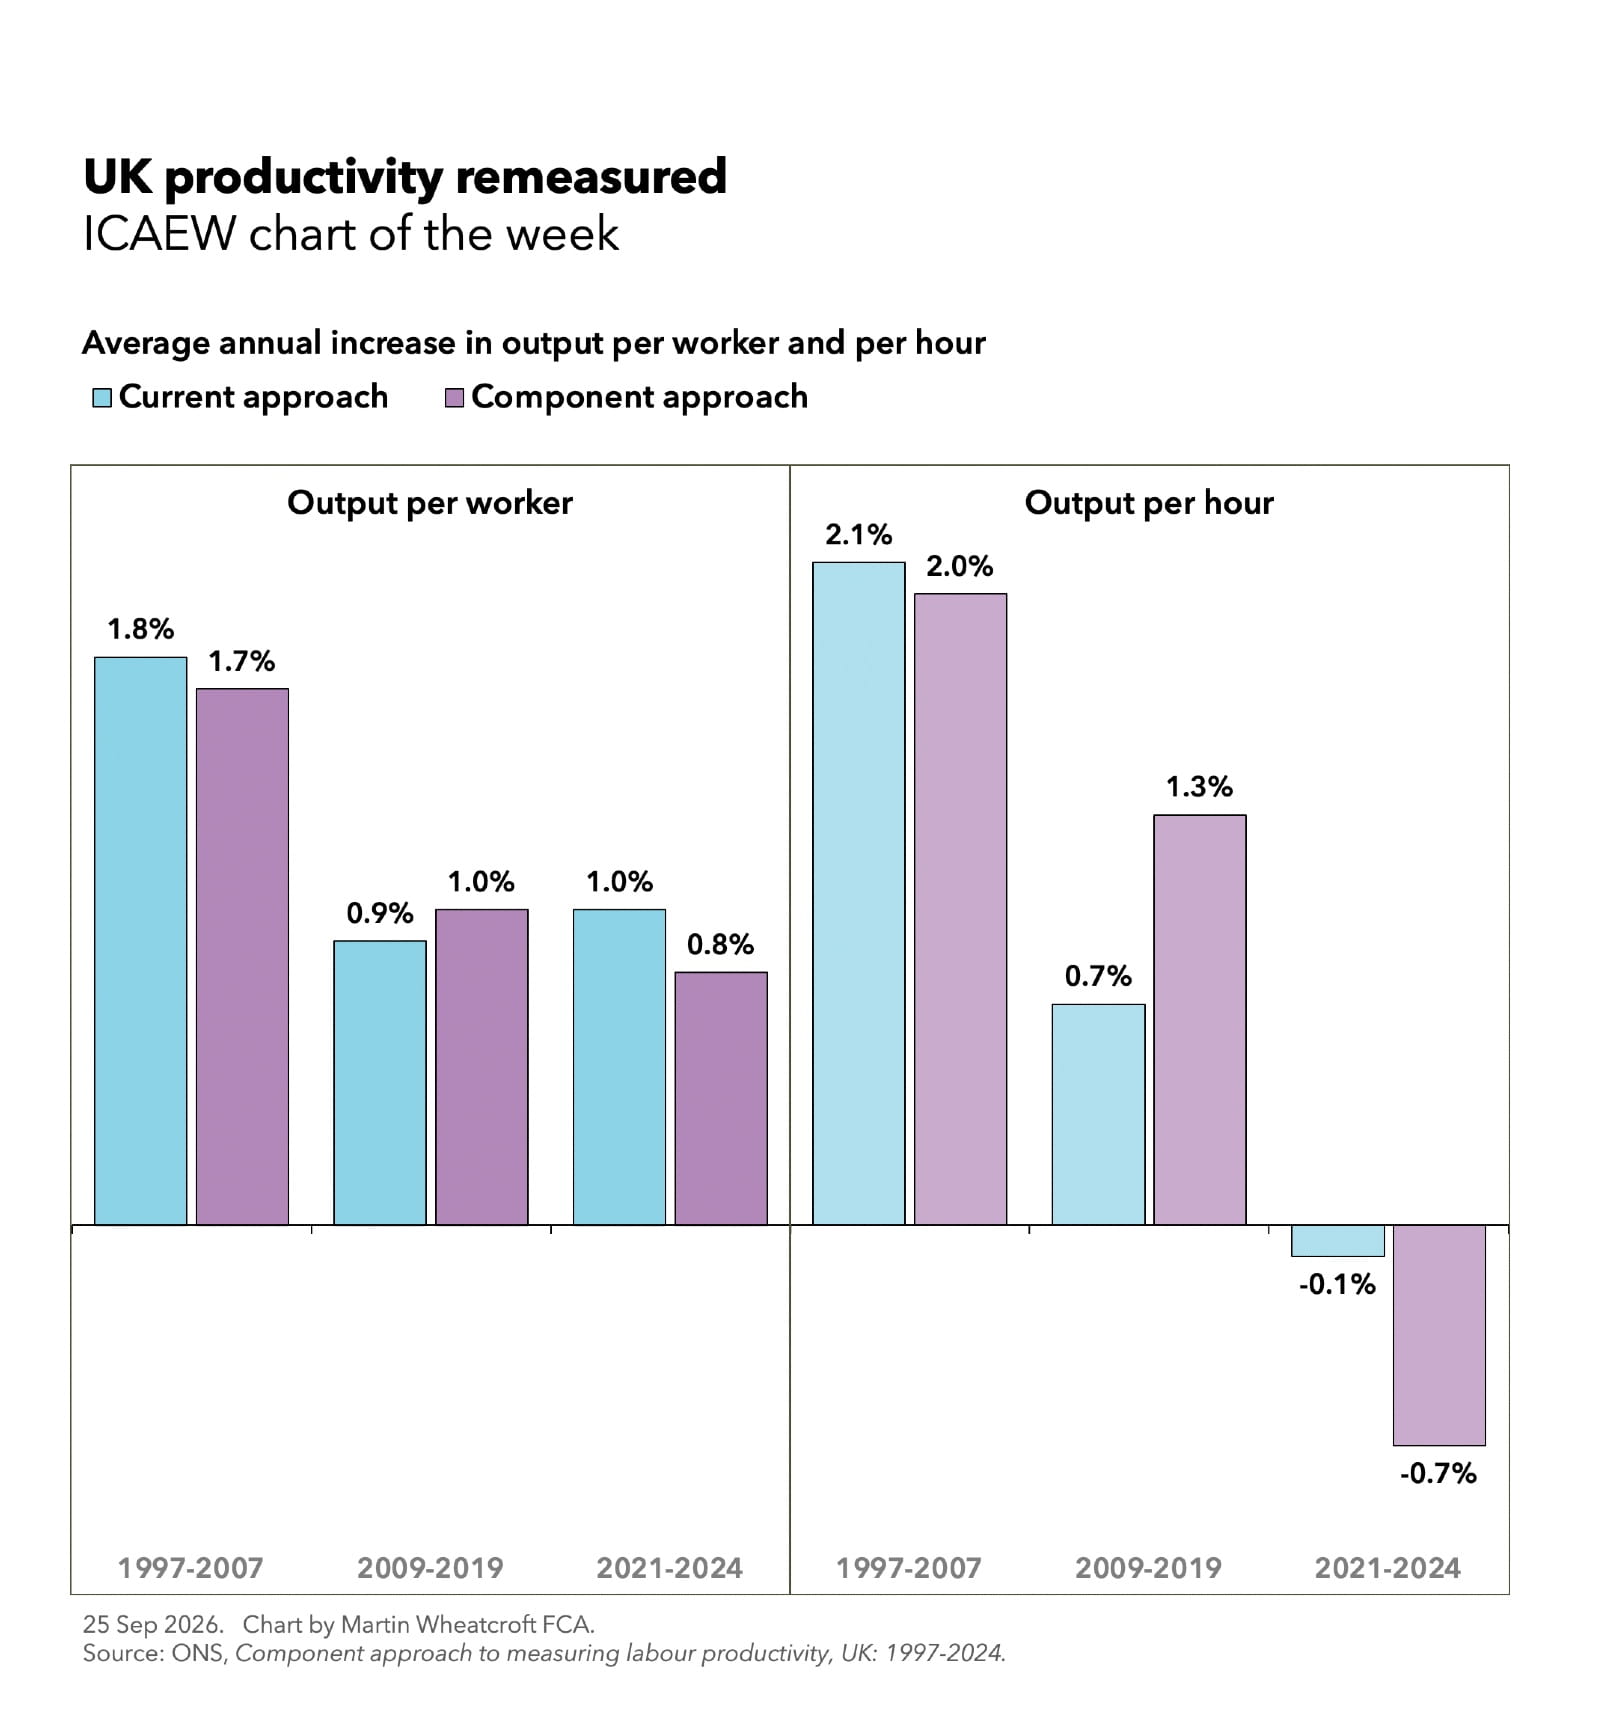
Our chart shows how output per worker and output per hour are affected by the new measurement approach.
Output per worker
According to the ONS, the average annual increase in economic output per worker between 1997 and 2007 (before the financial crisis) of 1.8% under the current approach will be revised to 1.7% using the component approach, while the average annual increase between 2009 and 2019 of 0.9% is recalculated as 1.0% using the new method.
Our chart also shows how an increase in output per worker of 1.0% a year on average between 2021 and 2024 using the current method translates into 0.8% using the component approach.
As the chart illustrates, the average rates of increase in output per worker are not that different between the two methodologies, with reasonably good productivity growth on a per worker basis before the financial crisis followed by much weaker levels of productivity growth since then.
Output per hour
Where the methodologies diverge more widely is on output per hour since the financial crisis.
Our chart illustrates how the average annual increase of economic output per hour between 1997 and 2007 of 2.1% under the current approach changes to 2.0% under the component method, in line with the change for output per worker.
This contrasts with the much larger change between an average annual increase in output per hour between 2009 and 2019 of 0.7% using the current method and the 1.3% calculated using the component approach.
Output per hour fell between 2021 and 2024 under both approaches, with a small drop of 0.1% per year on average using the current approach translating to a fall of 0.7% a year using the component approach.
Better data on hours worked
The ONS says that they are improving how UK labour productivity is measured by “building labour input from separate measures of hours worked, jobs and workers, using household surveys, business surveys and administrative data, in line with the latest international norms and standards.” They continue: “The new component approach introduces explicit adjustments for annual leave, sickness, bank holidays, furlough and overtime, while benchmarking hours worked to employer-reported data.”
In other words, the ONS believe they now have much better data on how many hours people are working. While this doesn’t make a big difference to productivity growth rates before the pandemic, it does to the rates since then.
In effect, the 0.3 percentage point difference (using either methodology) between output per worker and output per hour over the decade to 2007 reflects a decline in average working hours over those periods. The component approach now suggests that this decline continued between 2009 and 2019, with output per worker rising by 1.0% compared with a 1.3% increase in output per hour. This contrasts with the current approach, which implies that average working hours increased over that decade, with output per worker rising by 0.9% compared with 0.7% for output per hour.
The ONS still believes that average working hours have increased in the three-year period between 2021 and 2024, with the current approach seeing a 0.8 percentage point difference between the per worker and per hour measures and the component approach seeing a 1.5 percentage gap. This is likely to reflect the workforce emerging from a pandemic and so a longer period is needed to really understand what is now going on, although there may also be some data issues around the time of the pandemic.
Productivity puzzle only partly solved
Our chart highlights how the productivity puzzle is a smaller puzzle than it once was, with the change in the growth rate in output per hour falling by 0.7 percentage points between the pre- and post-financial crisis decades on both a per worker and per hour basis instead of the 1.1 and 1.4 percentage point falls that its current approach reports for these metrics respectively.
However, that 0.7 percentage point drop means that there is still a productivity puzzle that remains, even if not as large as previously thought.
Solving the remaining productivity puzzle might not fix all of the UK’s economic and fiscal problems, but it would be a big help.
ICAEW on the budget

Latest charts
Stay up to date
You can receive regular email updates from ICAEW insights, including weekly or monthly enewsletters. Subscribe to whichever works for you.
Sign upFurther resources
ICAEW Community

Public Sector Community
The go-to place for guidance on issues affecting finance professionals working in and with the public sector. With a range of dynamic services, ICAEW provides valuable tools, resources and support tailored to the public sector.
Resources

Economy explainers
ICAEW experts offer simple guides to help understand the technical, economic jargon that is discussed when talking about public finances and the economy.
Find out moreICAEW support

Training and events
Browse upcoming and on-demand ICAEW events and webinars offering support on technical areas, such as assurance, reporting and tax, as well as personal development.
Events and webinars A-Z of courses