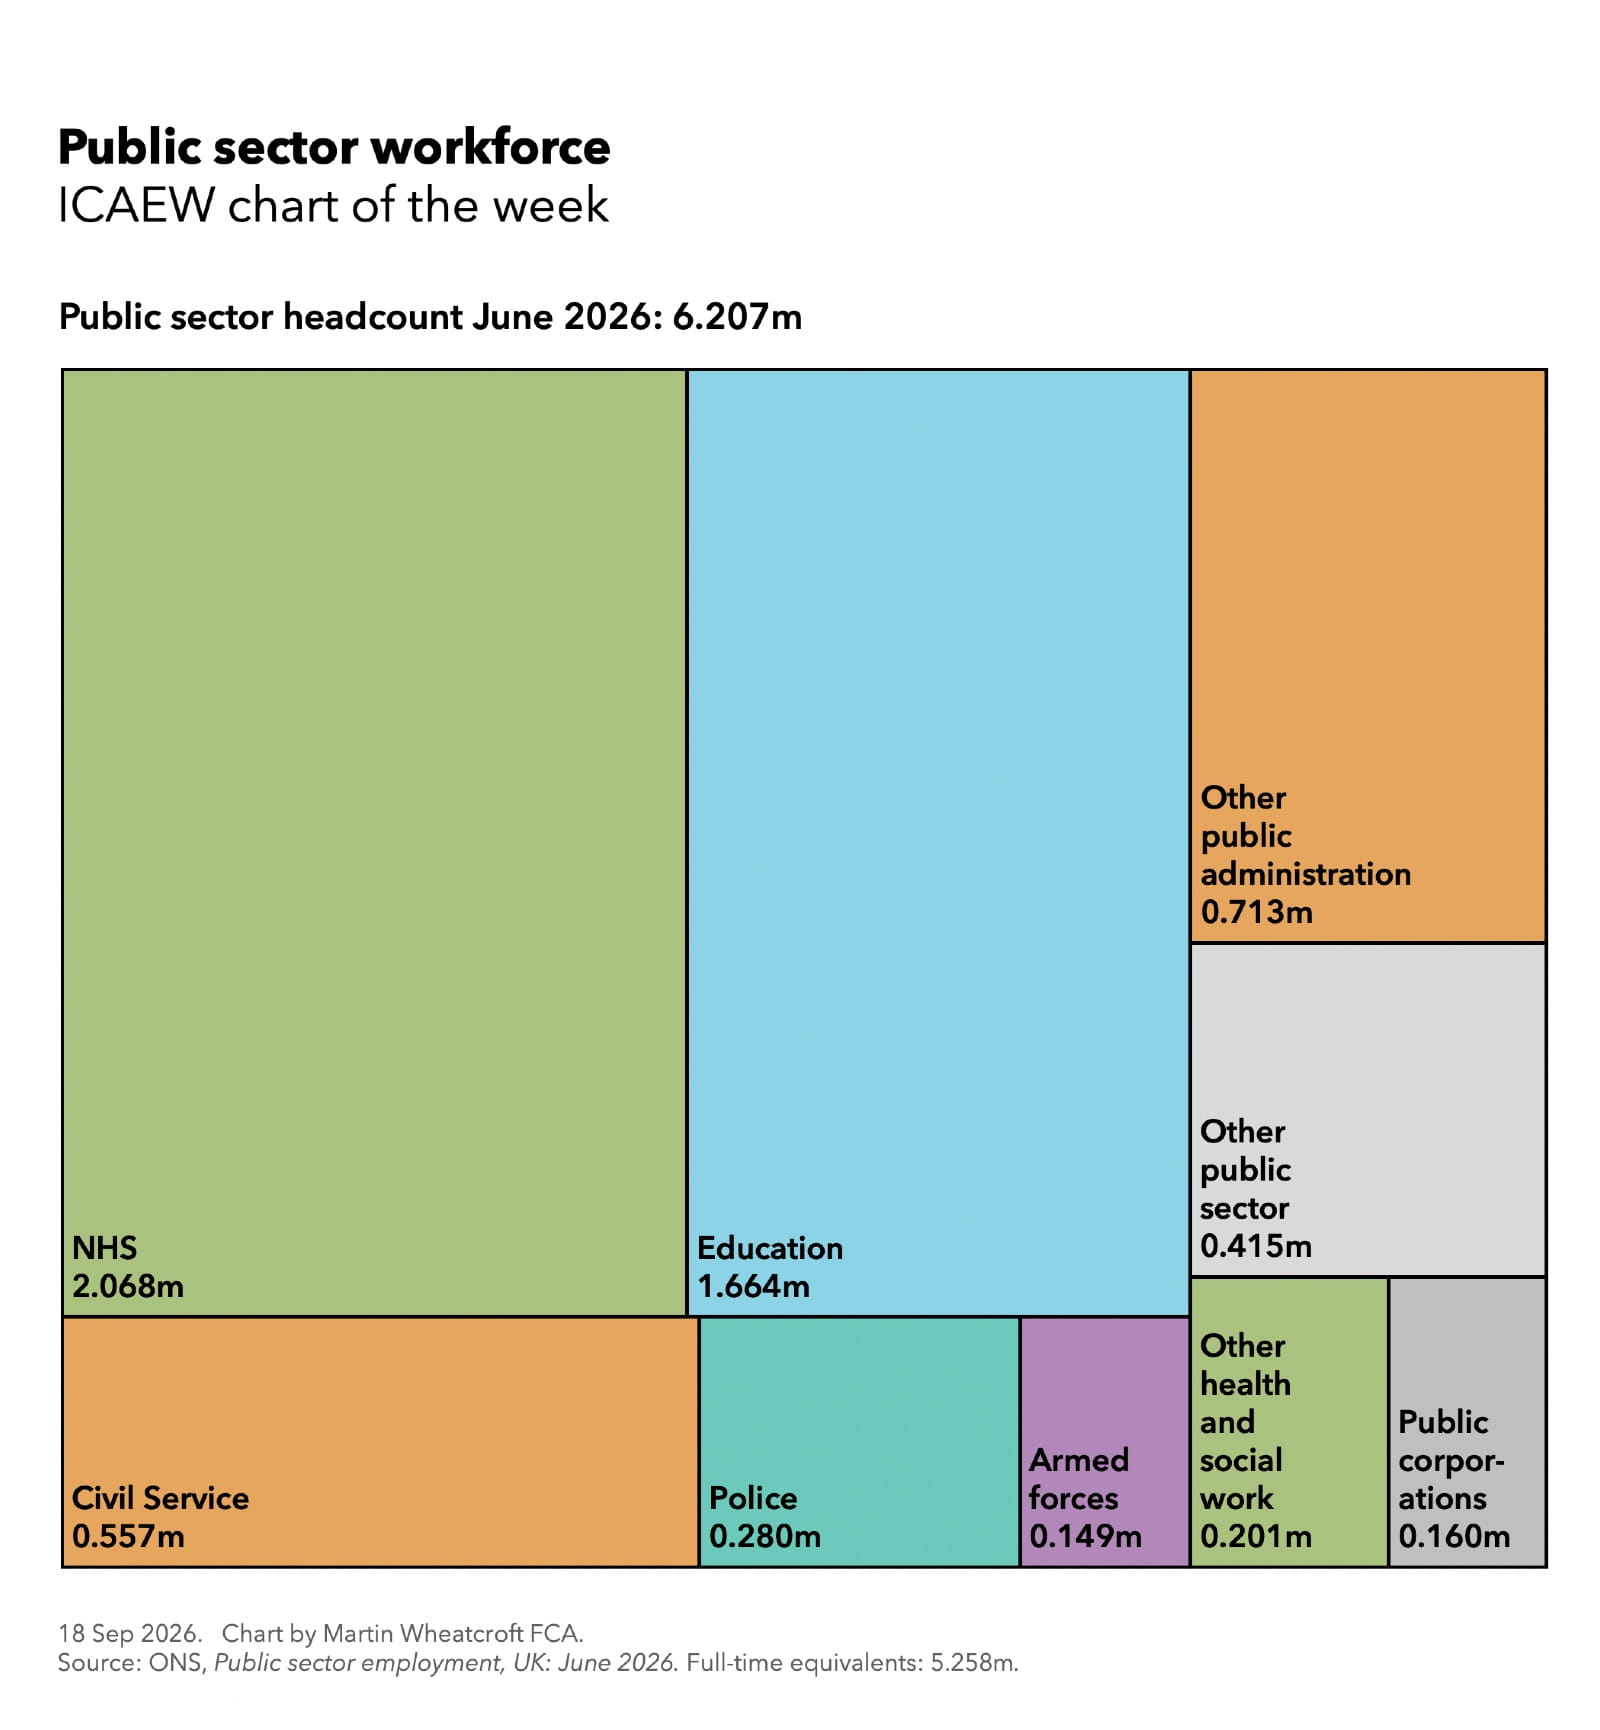
According to the latest statistics from the Office for National Statistics (ONS) there were 6.207m people working in the public sector in June 2026, equivalent to 18% of the total UK workforce of 34.478m.
Our chart of the week shows how this is broken down into the 2,068,000 (33.3% of the total public sector workforce) who are employed by the NHS, 1,664,000 (26.8%) working in education, 557,000 (9.0%) in the Civil Service, 280,000 (4.5%) in the police (including civilian staff) and 149,000 (2.4%) in the armed forces.
There were 713,000 (11.5%) people working in public administration outside of the Civil Service (many in local government), 201,000 (3.2%) in other health and social work roles outside of the NHS, 160,000 (2.6%) working for public corporations, and 415,000 (6.7%) in other public sector roles.
Full-time equivalents
Our chart is based on headcount, but many public sector workers are employed on a part-time basis. According to the ONS, the public sector employed 5.258m full-time equivalents (FTEs) in June 2026, meaning total hours worked were around 85% of what they would be if everyone worked full time.
The NHS employed 1,839,000 FTEs (89% of full-time hours), education 1,237,000 FTEs (74%), Civil Service 523,000 FTEs (94%), police 273,000 FTEs (98%) and armed forces 149,000 FTEs (100%).
There were 579,000 FTEs (81%) in other public administration, 156,000 FTEs (78%) in other health and social work, 153,000 FTEs (96%) working for public corporations, and 349,000 FTEs (84%) in other public sector roles.
Changes over the last decade
The public sector workforce is 556,000 (or approximately 10%) higher than it was 10 years ago in June 2016. This compares with an increase in the UK population of 6% over the same period.
The biggest rise has been in the NHS, which employs 479,000 more people (+30% compared with June 2016). Education employs 12,000 fewer (-1%), the Civil Service 141,000 more (+34%), police (including civilians) 33,000 more (+13%) and the armed forces 9,000 fewer (-6%).
There were 126,000 more (+21%) public sector workers in other public administration, 92,000 fewer (-31%) in other health and social work, 175,000 fewer (-52%) in public corporations and 65,000 more (+19%) in other public sector roles.
Employment prospects
The Civil Service is expected to start to shrink over the next three years as the government looks to deliver significant efficiency savings within the current three-year spending review period that started in April 2026. This contrasts with the NHS where the workforce is expected to continue to grow to serve increased demand as more people live longer.
Education should in theory see a further reduction over the next few years as primary schools close or merge in response to falling rolls, and secondary schools thereafter. Police headcount (particularly the numbers of civilian staff) are likely to depend on whether the proposed consolidation of police forces goes ahead, while the armed forces should stabilise around the current level before increasing as defence spending approaches 3.5% by 2035.
Other public administration should in theory fall with local government reorganisation, but this may be offset by devolution moving activities and people out of central government into regional and local authorities.
Latest charts
Stay up to date
You can receive regular email updates from ICAEW insights, including weekly or monthly enewsletters. Subscribe to whichever works for you.
Sign upFurther resources
ICAEW Community

Public Sector Community
The go-to place for guidance on issues affecting finance professionals working in and with the public sector. With a range of dynamic services, ICAEW provides valuable tools, resources and support tailored to the public sector.
Resources

Economy explainers
ICAEW experts offer simple guides to help understand the technical, economic jargon that is discussed when talking about public finances and the economy.
Find out moreICAEW support

Training and events
Browse upcoming and on-demand ICAEW events and webinars offering support on technical areas, such as assurance, reporting and tax, as well as personal development.
Events and webinars A-Z of courses