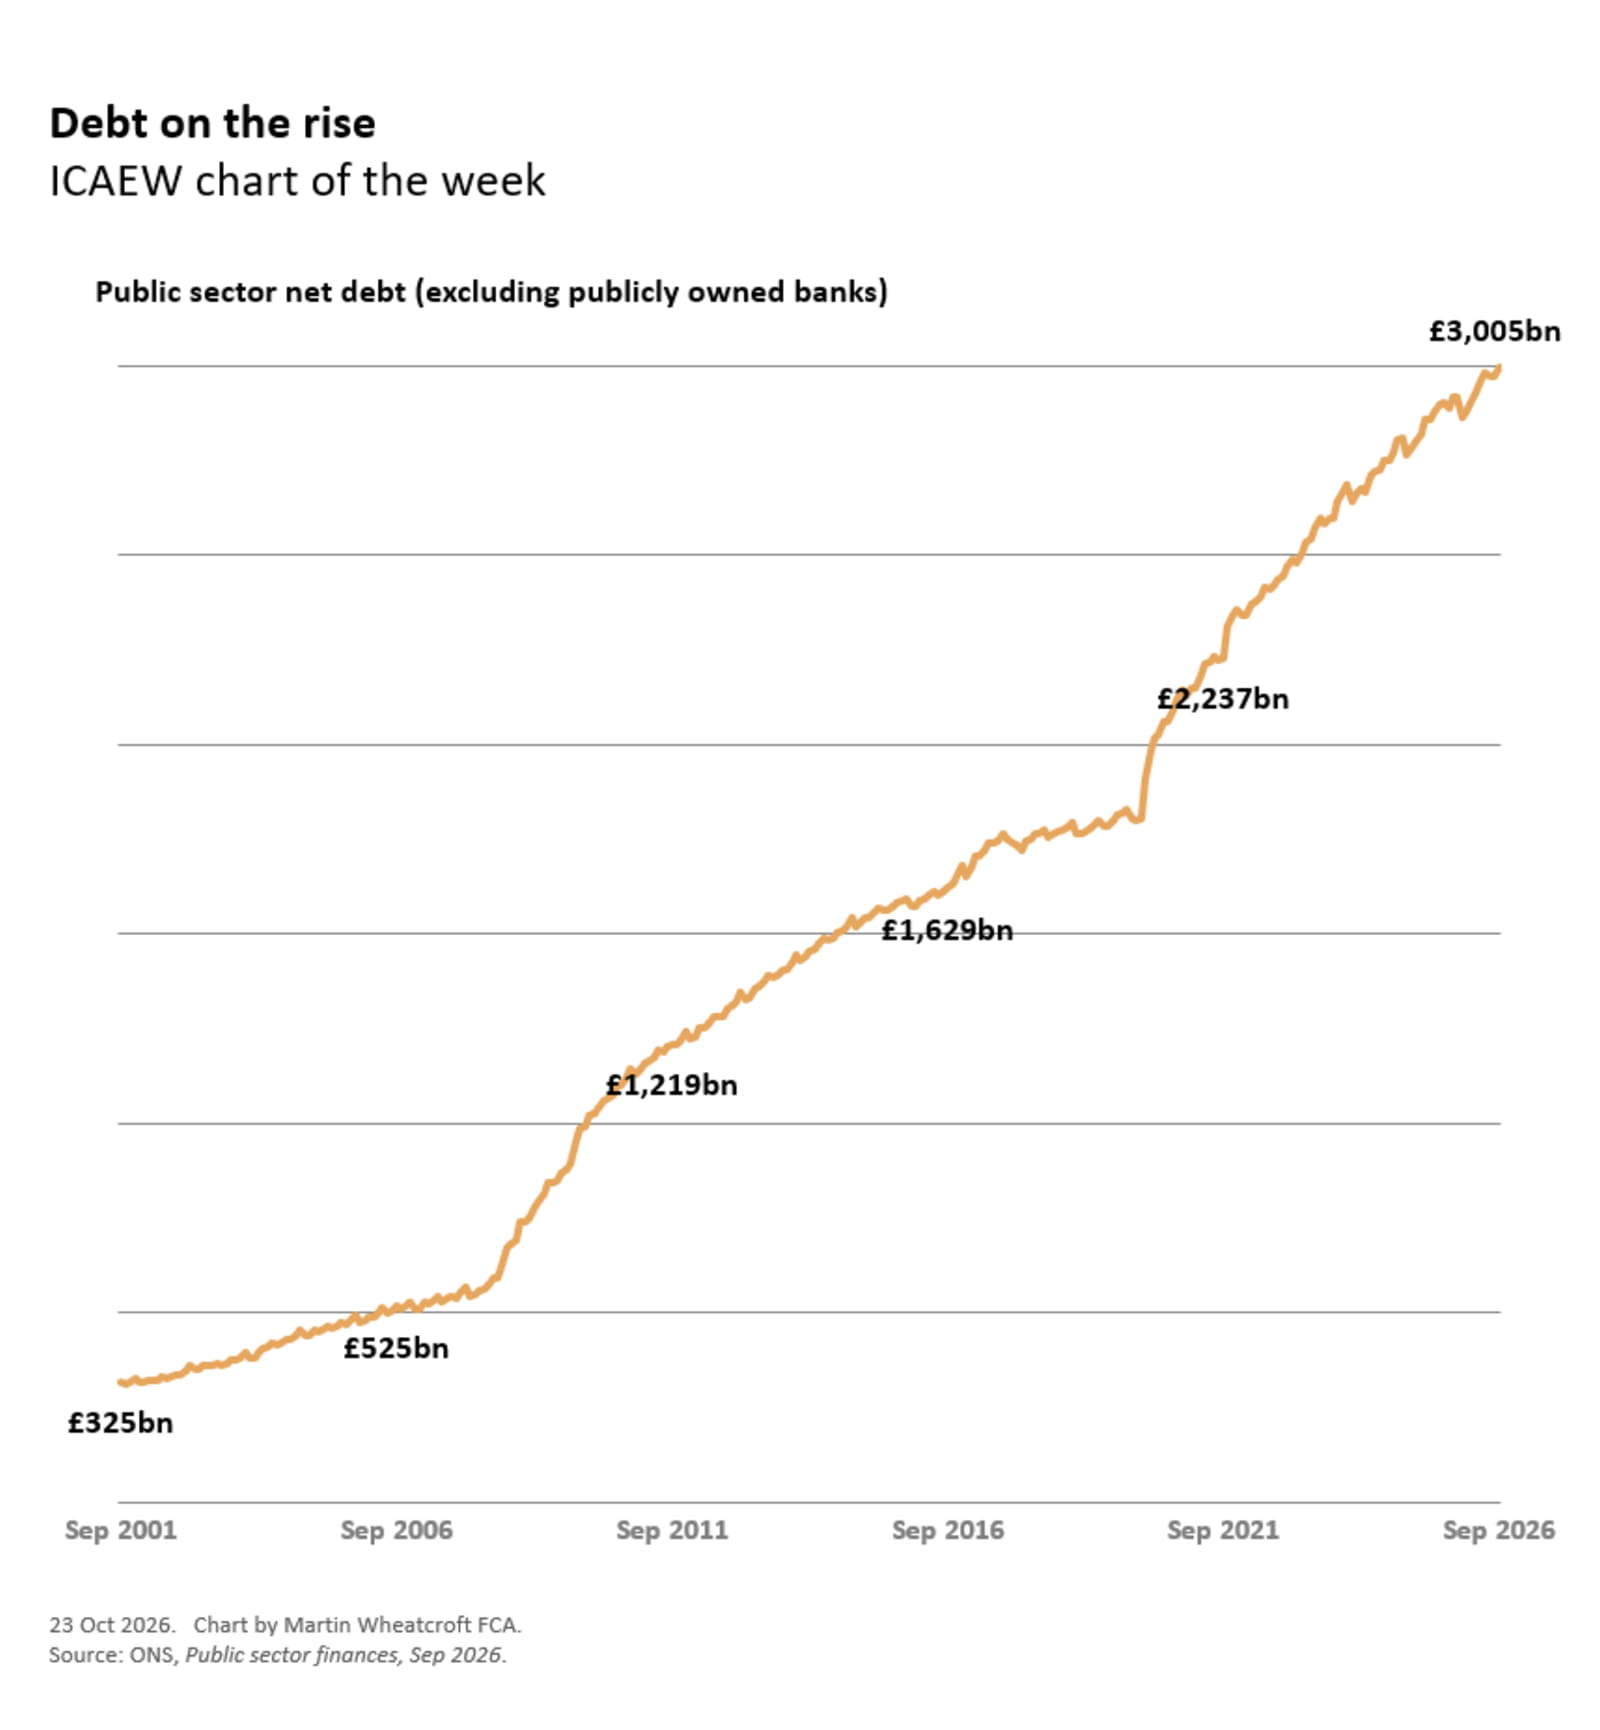
Public sector net debt reached £3tn for the first time in September 2026, providing a difficult backdrop for the Chancellor as he seeks to bring the public finances back under control in his first budget.
This week’s chart illustrates how public sector net debt has been on an increasingly sharp upward path over the past 25 years, rising from £325bn on 30 September 2001 to £525bn in 2006, £1,219bn in 2011, £1,629bn in 2016, £2,237bn in 2021 and then £3,005bn on 30 September 2026. (Net debt for this purpose excludes the debt of publicly owned commercial banks, such as NatWest between 2008 and 2025.)
As a share of national economic activity public sector net debt was equivalent to 28.1%, 35.3%, 72.5%, 81.5%, 80.3%, 92.8% and 94.0% of GDP on the above dates respectively.
The rise in debt reflects decisions by successive governments to borrow more in addition to emergency borrowing to rescue the banking sector during the financial crisis in 2008 and 2009, to cover the costs of the pandemic between 2020 and 2022, and to support households and businesses with high energy costs between 2021 and 2023.
Borrowing, more or less
The rise in net debt of £2,680bn over the past quarter of a century represents borrowing to fund shortfalls each year between receipts and public spending (the deficit), as well as to fund government lending and working capital requirements. This is equivalent to an average of £107bn a year, or a compound annual increase of 9.3%.
The total increase can be analysed into increases of £200bn, £694bn, £410bn, £608bn and £768bn respectively over each five-year period to September 2006, 2011, 2016, 2021 and 2026 or average increases of £40bn, £139bn, £82bn, £122bn and £154bn per year.
Thinking about tomorrow
The good news is that the rate of increase in debt is expected to reduce to an average of £118bn per year over the five years to March 2031, based on the Office for Budget Responsibility (OBR)’s spring forecast and before updates in the upcoming budget. This should mean net debt starts to fall as a share of GDP, even if the total amount owed continues to grow.
The bad news is that debt is close to its highest level since the 1960s, which combined with high interest rates means the cost of servicing debt has risen significantly. This means that it is going to be that much more difficult to slow the rise of debt, particularly as demographics change over the coming decades.
It took 316 years (from the founding of the Bank of England in 1694) for net debt to reach £1tn in 2010, but then only 10 years to reach £2tn in 2020, and then just six years to pass £3tn in 2026.Current projections are that net debt should pass £4tn somewhere around 2036, although further economic shocks could accelerate this.
Meanwhile, our focus is likely to be on the plan for next few years that the Chancellor sets out in his first budget on Wednesday 28 October and whether that brings forward or pushes back the point at which net debt reaches £3.5tn, currently expected to be in four years’ time in 2030.
ICAEW on the budget

Latest charts
Stay up to date
You can receive regular email updates from ICAEW insights, including weekly or monthly enewsletters. Subscribe to whichever works for you.
Sign upFurther resources
ICAEW Community

Public Sector Community
The go-to place for guidance on issues affecting finance professionals working in and with the public sector. With a range of dynamic services, ICAEW provides valuable tools, resources and support tailored to the public sector.
Resources

Economy explainers
ICAEW experts offer simple guides to help understand the technical, economic jargon that is discussed when talking about public finances and the economy.
Find out moreICAEW support

Training and events
Browse upcoming and on-demand ICAEW events and webinars offering support on technical areas, such as assurance, reporting and tax, as well as personal development.
Events and webinars A-Z of courses