Guidance for CFOs and audit committees on reporting and assuring scope 3 greenhouse gas emissions related to insuring the aviation sector. Find out about methods of estimating emissions and common challenges.
ICAEW's Financial Services Faculty has worked with members from within the sector and experts from the Partnership for Carbon Accounting Financials (PCAF) to outline estimation methodologies for those reporting and assuring on greenhouse-gas emissions relating to non-life insurance products.
Here we focus on personal lines (motor), and separately have covered aviation and sovereign debt to highlight the suitability of applying PCAF methodology to the investments held by Non-Life insurers.
Scope 3 emissions are all indirect GHG emissions, not included in Scope 2, that occur in the value chain of the reporting company. Scope 3 can be broken down into upstream emissions that occur in the supply chain (for example, from production or extraction of purchased materials) and downstream emissions that occur as a consequence of using the organization’s products or services.
As part of Scope 3 Category 15, non-life insurers may wish to report both their financed emissions from their investments and their insured emissions from across the insurance value chain. To avoid double counting the insured emissions are calculated separately to the financed emissions but still reported within Category 15 (investments).
The PCAF highlights that insurance associated emissions and financed emissions are not directly comparable and so should not be aggregated (see Box 6-1 on p53 of The Global GHS Accounting and Reporting Standard, Part C).
Estimation methodologies
Overall process flow
This figure outlines the overall process flow for the calculation of insurance associated emissions from personal lines - motor (across all PCAF options).
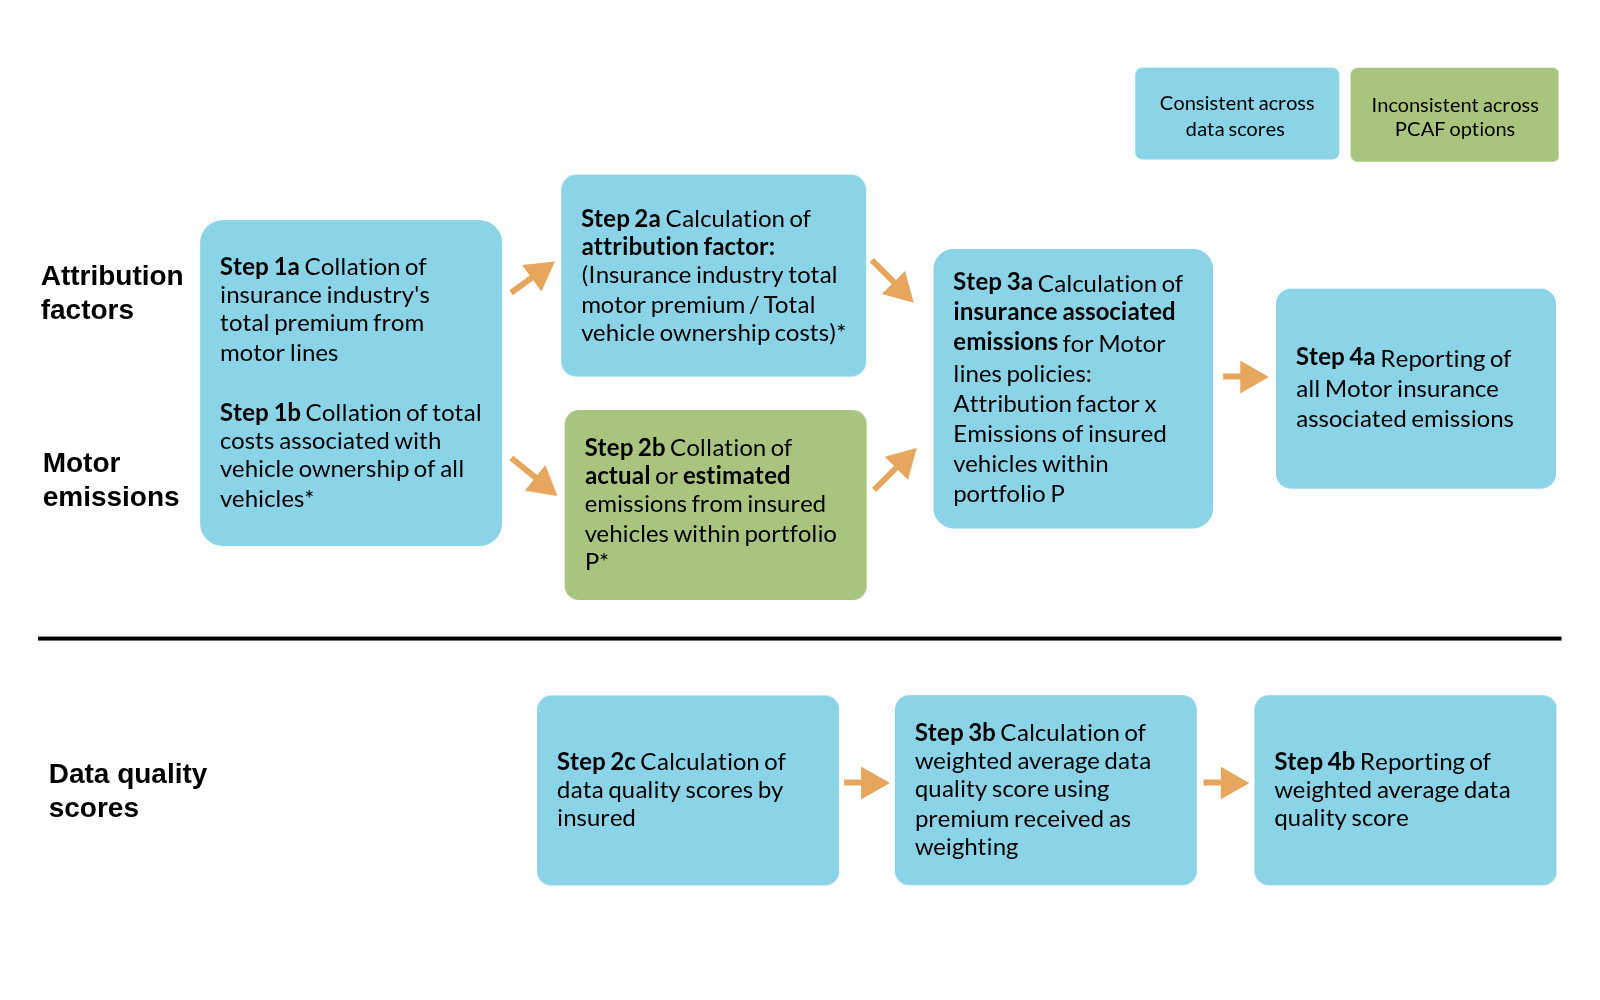
Key source: PCAF Standard Part C - The Global GHG Accounting and Reporting Standard - Insurance Related Emissions.
Note: Total costs associated with vehicle ownership can be calculated using publicly available information, such as ONS weekly expenditure. Recommended costs include vehicle purchases, vehicle accessories, petrol, repairs, insurance, fines, road tax, and parking expenses.
If the industry total premium is not suitable, an insurer may use the insurer specific premium from the motor line of business and divide this by the total costs associated from vehicle ownership of a portfolio of 'P' vehicles.
Data quality scores
Within its Global GHG Accounting and Reporting Standard Part C, the PCAF further splits possible data quality scores into three different 'options' depending on data availability which are outlined in the table below. Further details on the attribution factors are available on p44 of Part C.
More support
Read more case studies and a list of common challenges facing financial services organisations when reporting and assuring scope 3 emissions.
Case studiesChallengesOption 1: actual vehicle-specific emissions
Figure 2 outlines the process flow for calculations using reported emissions to calculate insurance-associated emissions from personal lines - motor vehicle insurance.
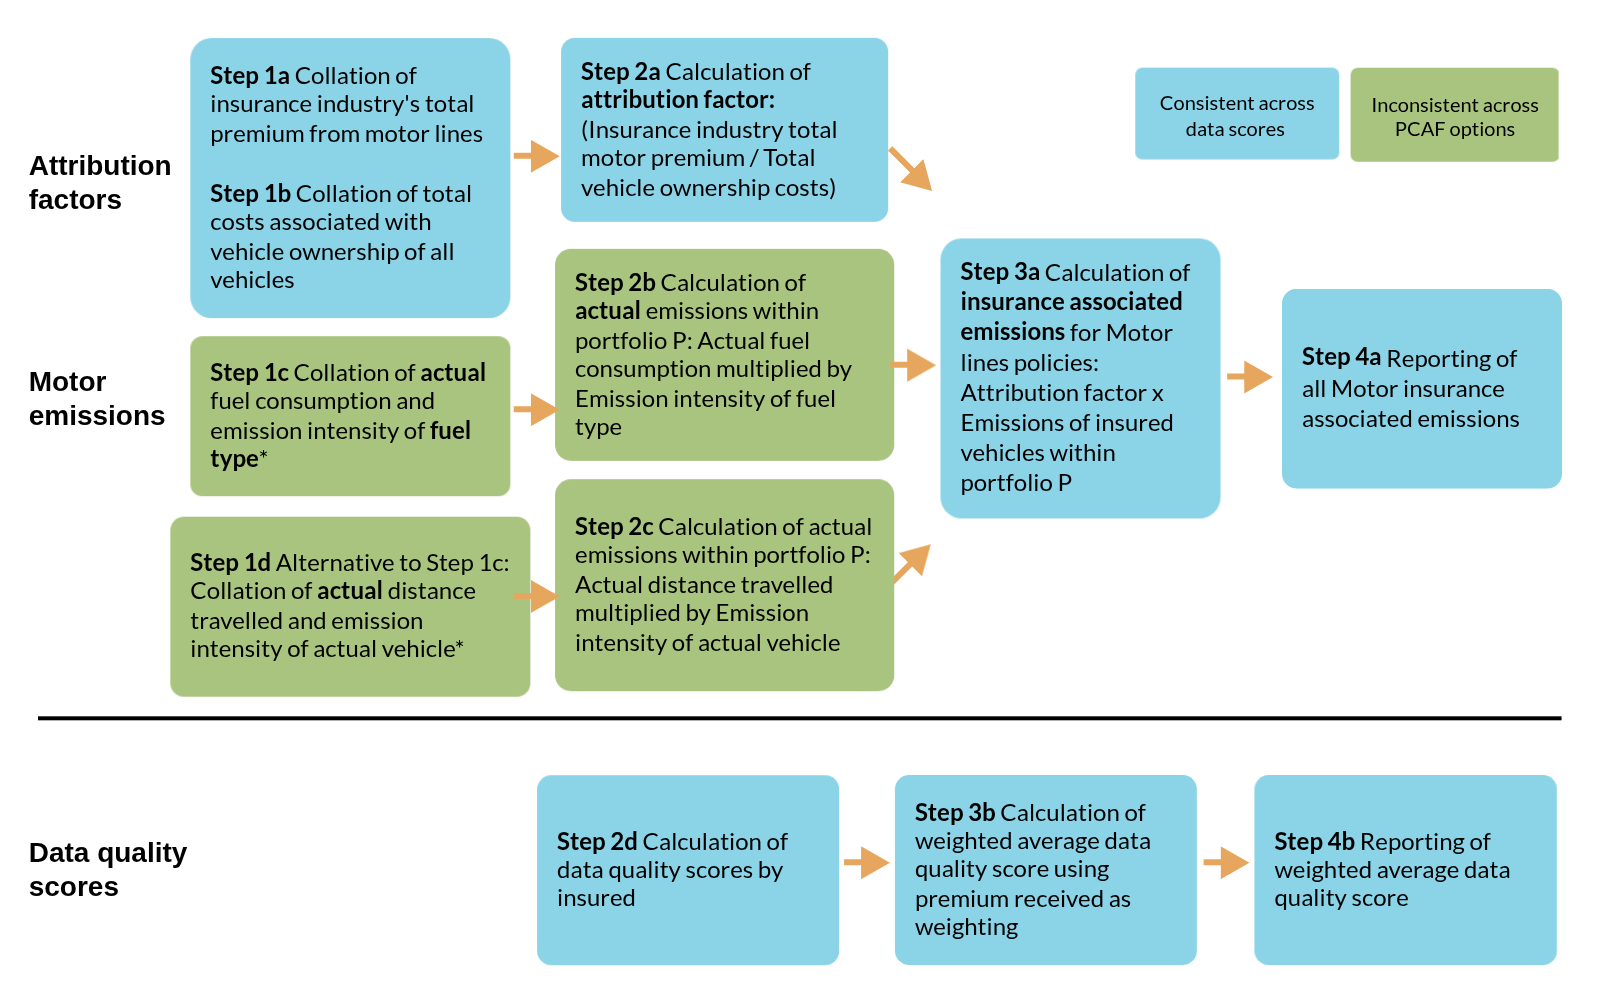
Key source: PCAF Standard Part C - The Global GHG Accounting and Reporting Standard - Insurance Related Emissions.
Note:
- Data quality score 1 where actual vehicle usage data and emission data is used.
Option 2: estimated vehicle-specific emissions
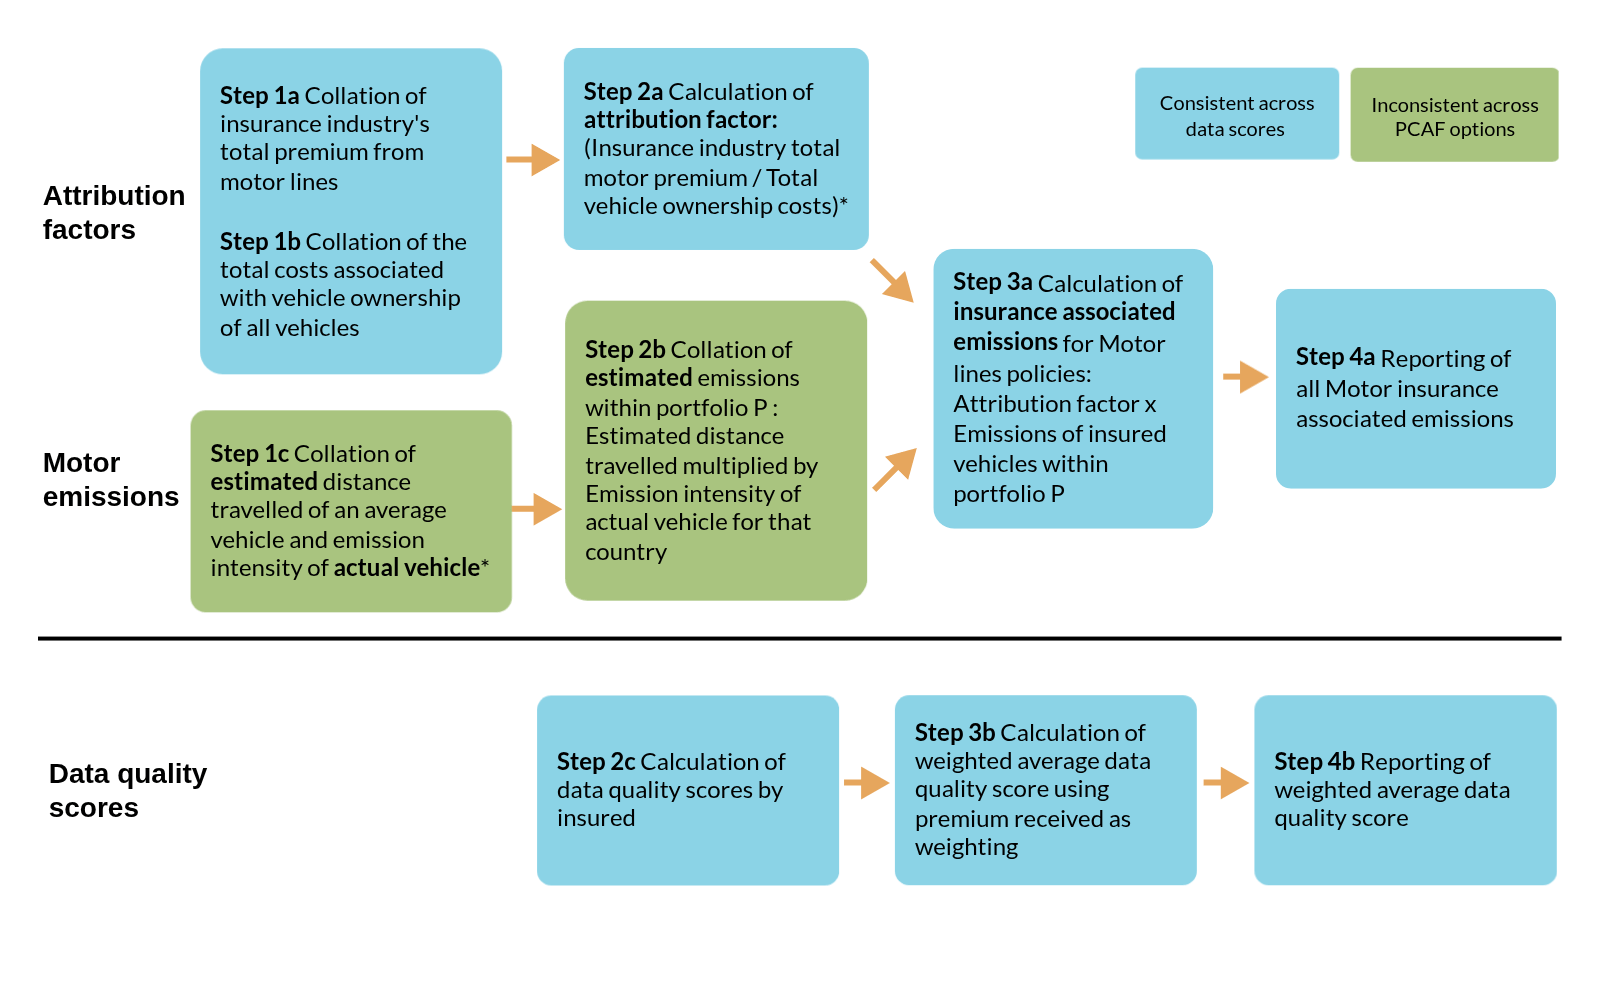
Key source: PCAF Standard Part C - The Global GHG Accounting and Reporting Standard - Insurance Related Emissions.
Note:
- Data quality score 2 where estimated distanced travelled of an average vehicle is split by type (cars, vans, motorcycles). If granularity of vehicle is not considered then a score of 3 is given. The average vehicle data must be specific for the province or country.
Option 3: estimated vehicle-unspecific emissions
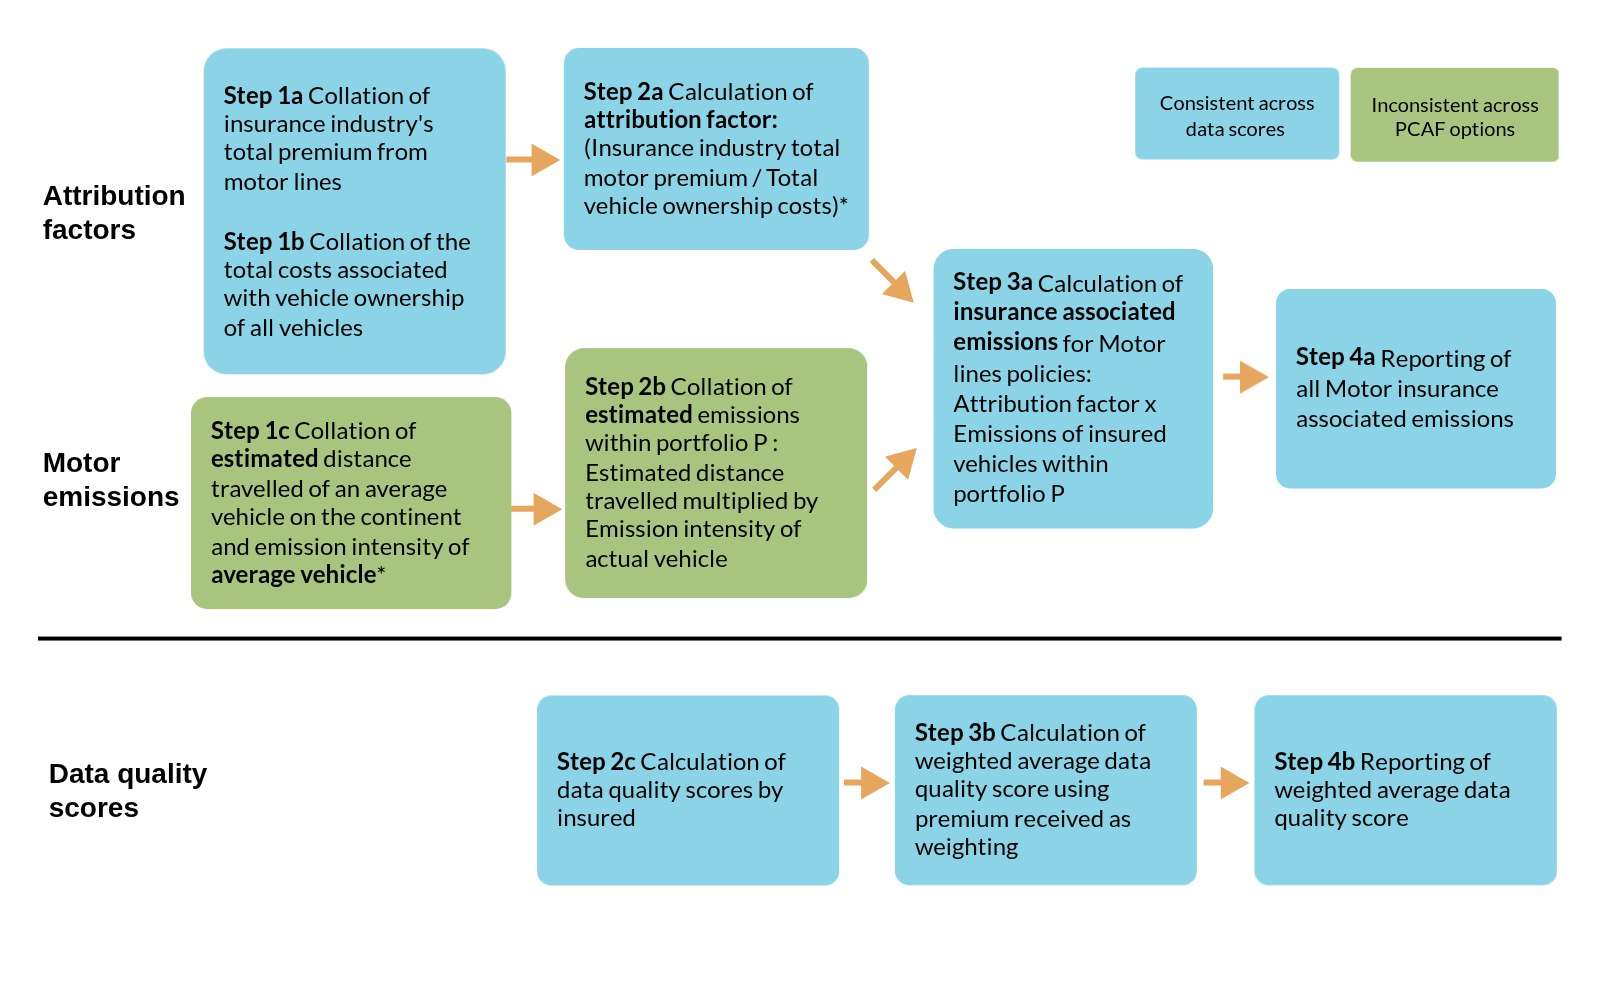
Key source: PCAF Standard Part C - The Global GHG Accounting and Reporting Standard - Insurance Related Emissions.
Note:
- Data quality score 4 where emission intensity of an average vehicle is split by type (cars, vans, motorcycles) and/or fuel type (motor oil, hybrid, electric). If granularity of emission intensity is not considered then a score of 5 is given.
Guidance created with permission from PCAF
This guidance is based, with permission, upon the work of the Partnership for Carbon Accounting Financials (PCAF) including the data quality score tables from The Global GHG Accounting and Reporting Standard for the Financial Industry. Any discussion of implementation challenges, lessons learned, interpretations, or other commentary are the views and experiences of contributors and not those of PCAF. Please refer to the PCAF Standard for complete guidance. In the event of any inconsistency between the guidance and the PCAF standard, the standard should be considered the authoritative source and take precedence.