Guidance for CFOs and audit committees on reporting and assuring scope 3 greenhouse gas emissions related to insuring the aviation sector. Find out about methods of estimating emissions and common challenges.
ICAEW's Financial Services Faculty has worked with members from within the sector and experts from the Partnership for Carbon Accounting Financials (PCAF) to outline estimation methodologies for those reporting and assuring on greenhouse-gas emissions relating to non-life insurance products.
Here we focus on commercial lines (aviation), and separately have covered personal lines (motor) and sovereign debt case study to highlight the suitability of applying PCAF methodology to the investments held by Non-Life insurers.
Scope 3 emissions are all indirect GHG emissions, not included in Scope 2, that occur in the value chain of the reporting company. Scope 3 can be broken down into upstream emissions that occur in the supply chain (for example, from production or extraction of purchased materials) and downstream emissions that occur as a consequence of using the organization’s products or services.
As part of Scope 3 Category 15, non-life insurers may wish to report both their financed emissions from their investments and their insured emissions from across the insurance value chain. To avoid double counting the insured emissions are calculated separately to the financed emissions but still reported within Category 15 (investments).
The PCAF highlights that insurance associated emissions and financed emissions are not directly comparable and so should not be aggregated (see Box 6-1 on p53 of The Global GHS Accounting and Reporting Standard, Part C).
Estimation methodologies
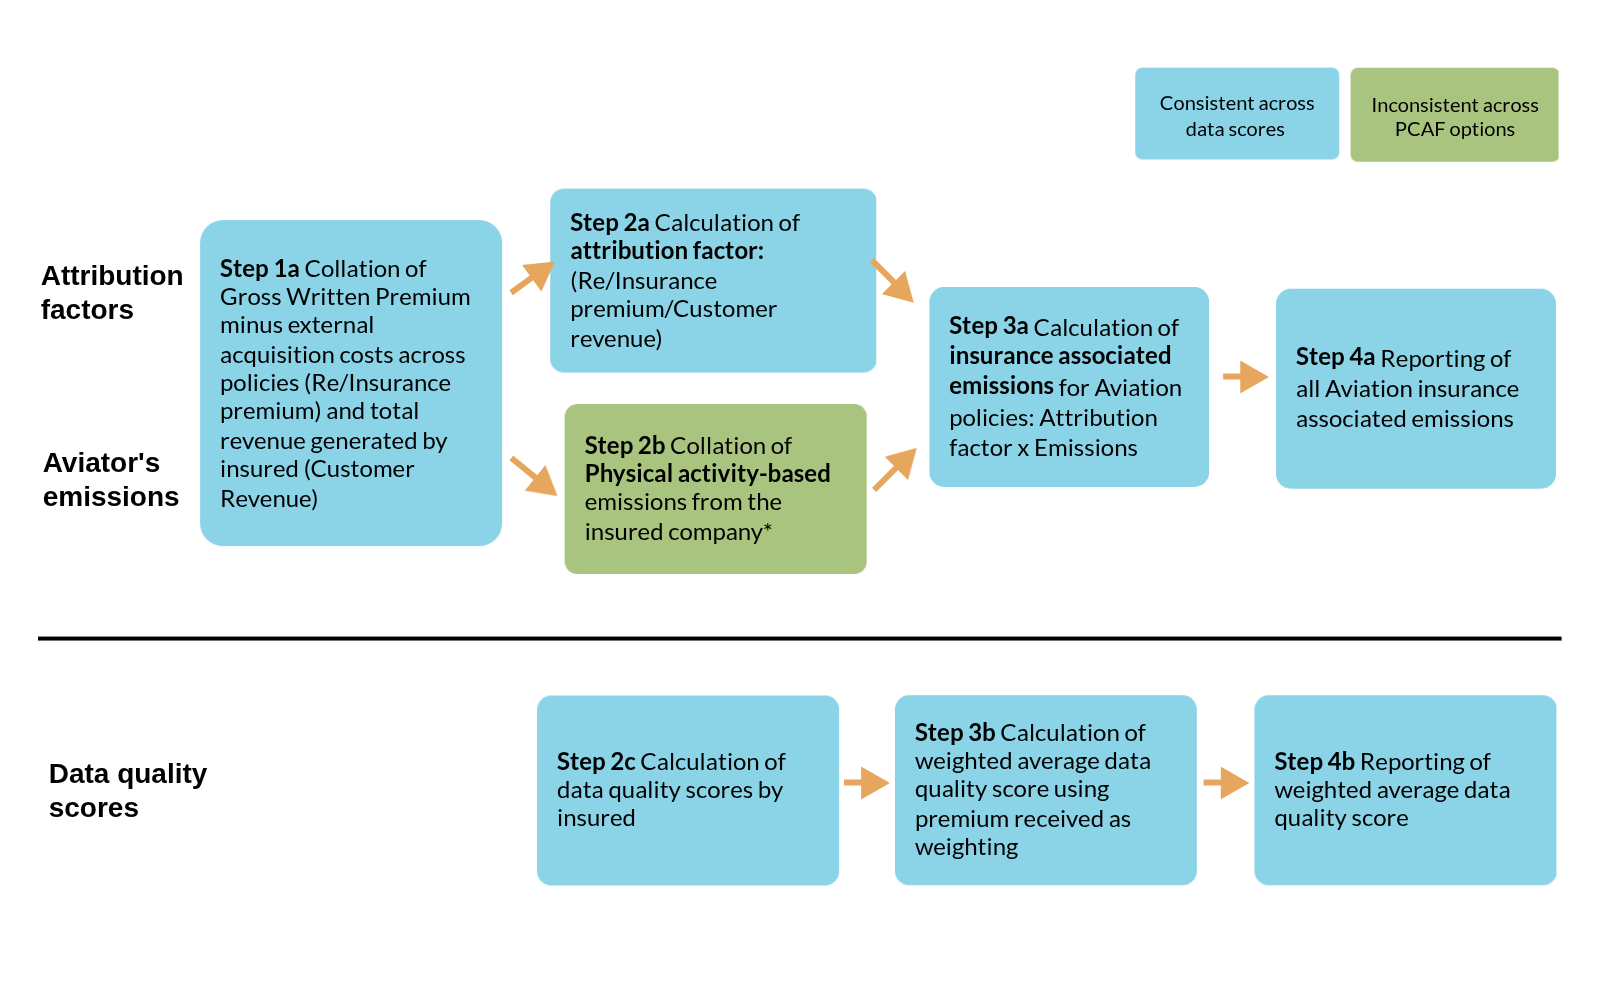
Overall process flow
This figure outlines the overall process flow for the calculation of insurance associated emissions from commercial lines - aviation (across all PCAF options).

Key source: PCAF Standard Part C - The Global GHG Accounting and Reporting Standard - Insurance Related Emissions.
Data quality scores
Within its Global GHG Accounting and Reporting Standard Part C, the PCAF further splits possible data quality scores into three different 'options' depending on data availability which are outlined in the table below. Further details on the attribution factors are available on p34 of Part C.
More support
Read more case studies and a list of common challenges facing financial services organisations when reporting and assuring scope 3 emissions.
Case studiesChallengesOption 1: reported emissions
Figure 2 outlines the process flow for calculations using reported emissions to calculate insurance associated emissions from commercial lines - aviation.

Key source: PCAF Standard Part C - The Global GHG Accounting and Reporting Standard - Insurance Related Emissions.
Notes:
- Data quality score 1 uses Scope 1 and 2 reported emissions.
- Data quality score 2 where both the Scope 1 and 2 reported emissions are not verified.
- Data quality score 4 where the reported Scope 1 and 2 emissions do not align with the ensured entities.
Option 2: physical activity-based emissions
Key source: PCAF Standard Part C - The Global GHG Accounting and Reporting Standard - Insurance Related Emissions.
Notes: As discussed by the transition pathway initiative (TPI), revenue tonne kilometres (RTKs) is the recommended activity metric for aviation. RTK is the total number of revenue-generating tonnes of both passengers and freight multiplied by the distance flown.
Reported metric is 'tank-to-wheel' (TTW) CO2 emissions per RTK. TTW is the GHG emissions produced during the operation of an aircraft.
Metric differs from those show in the table above due to suitability of methodology for the aviation industry.
- Data quality score 3 where physical activity-based emissions are used from the insured activities.
- Data quality score 4 where physical activity-based emissions do not align with the ensured entities.
Option 3: economic activity-based emissions

Key source: PCAF Standard Part C - The Global GHG Accounting and Reporting Standard - Insurance Related Emissions.
Note: Emissions data is estimated from official statistical data to obtain sector specific average emission factors expressed per economic activity (tCO2 / £ of revenue or tCO2 / £ of assets).
- Data quality score 5 where economic activity-based emissions are used.
Insured revenue data
For some commercial lines, customer revenues are automatically captured during submission. However, insurers may face challenges if the revenue data is not gathered during submission.
The preferred method is to use revenue reported by clients or third-party providers. If unavailable, estimated revenue based on industry, country, or employee numbers can be used, utilising internal models.
Relevance of PCAF guidance
There may be circumstances where the advised PCAF metric isn’t appropriate to the line of business. In these circumstances, the PCAF advise that the emissions data should be estimated using an appropriate calculation methodology issued or approved by a credible independent body.
Insurers must remain flexible to adapt their emissions’ calculations approach for different business lines and ensure that such an approach is not inconsistent with the PCAF methodology.
These challenges need to be appropriately navigated by reporting companies such that assurance practitioners are able to reach a conclusion on the data.
ISAE 3000 (Revised) is the typical assurance standard under which sustainability-related assurance is obtained at present, with ISAE 3410 the standard for assurance engagements on greenhouse-gas statements.
However, the International Standard on Sustainability Assurance (ISSA 5000) is effective for assurance engagements on sustainability information reported for periods beginning on or after 15 December 2026; or as at a specific date on or after 15 December 2026.
This will see ISAE 3000 (Revised) and ISAE 3410 withdrawn, and no longer applicable for sustainability assurance engagements after that effective date.
Many firms may already be in the process of updating methodology so that they can deliver assurance engagements under ISSA 5000.
The UK version of the standard, ISSA (UK) 5000, was published by the FRC in November 2025, and, as with the international version of the standard, early adoption of ISSA 5000 is permitted – IAASB encourage this, and ICAEW is supportive.
Guidance created with permission from PCAF
This guidance is based, with permission, upon the work of the Partnership for Carbon Accounting Financials (PCAF) including the data quality score tables from The Global GHG Accounting and Reporting Standard for the Financial Industry. Any discussion of implementation challenges, lessons learned, interpretations, or other commentary are the views and experiences of contributors and not those of PCAF. Please refer to the PCAF Standard for complete guidance. In the event of any inconsistency between the guidance and the PCAF standard, the standard should be considered the authoritative source and take precedence.