This case study aims to support those in the banking sector considering how to approach the reporting and assurance of scope 3, category 15 emissions in relation to residential mortgages. It outlines estimation methodologies and common challenges faced by preparers and assurers.
ICAEW's Financial Services Faculty has worked with members from within the sector and experts from the Partnership for Carbon Accounting Financials (PCAF) to outline estimation methodologies for those reporting and assuring on greenhouse-gas emissions relating to residential mortgages.
Estimation methodologies
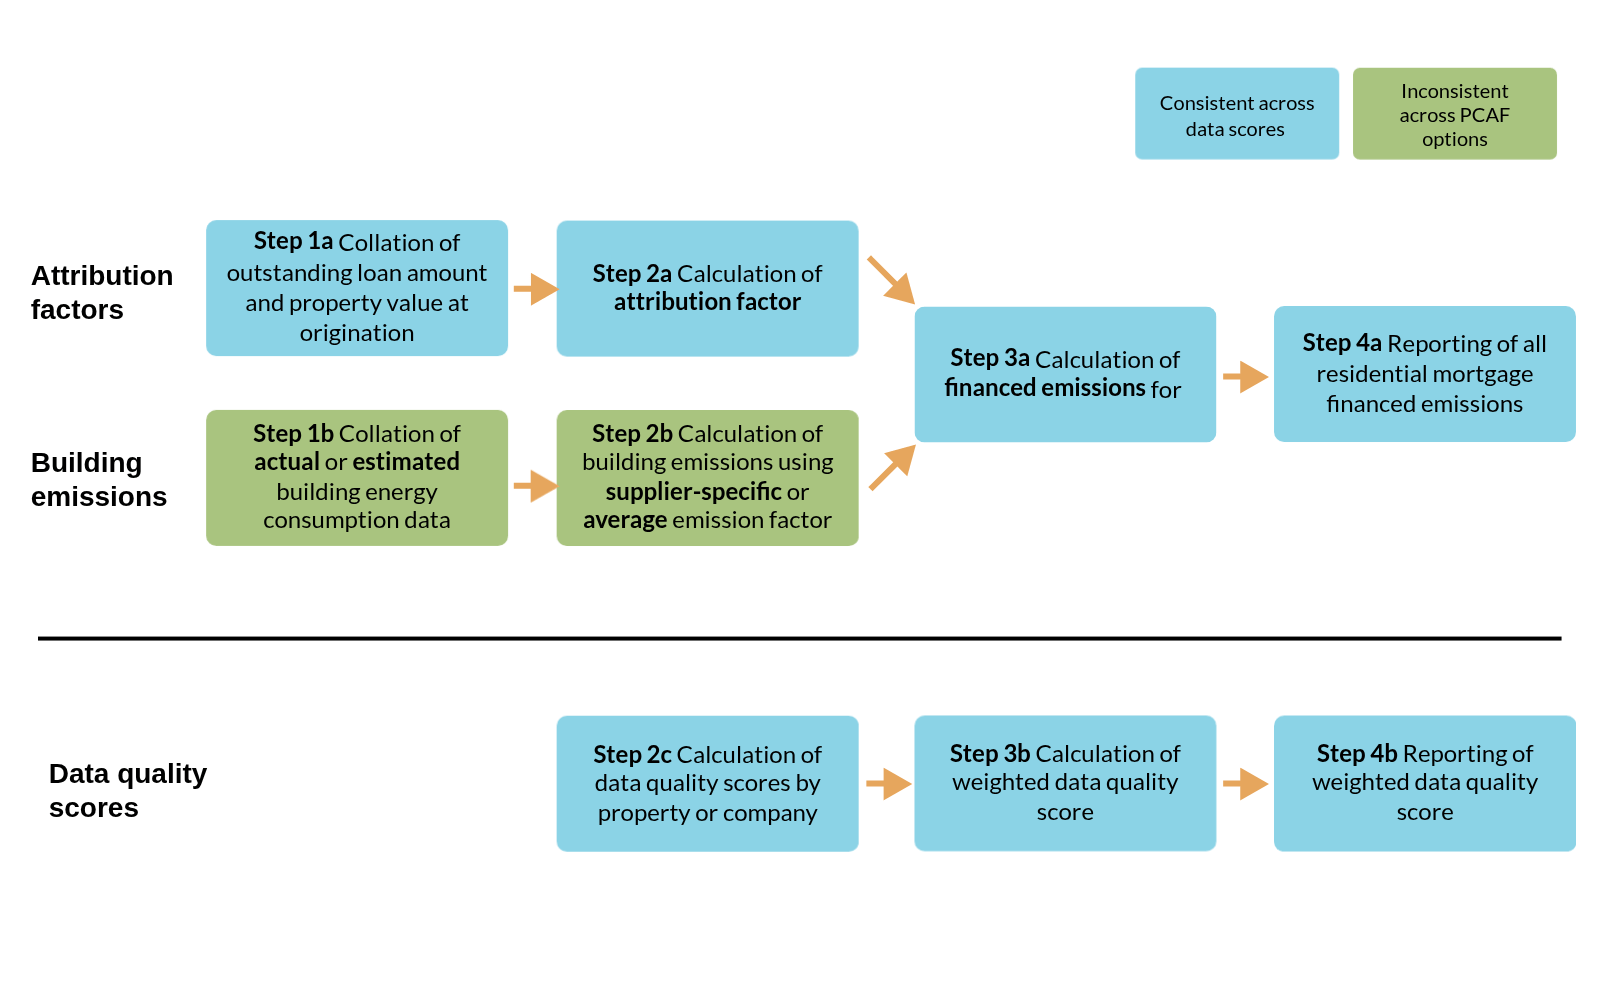
Overall process flow
This figure outlines the overall process flow for the calculation of financed emissions from residential mortgages (across all PCAF options).
Data quality scores
Within its Global GHG Accounting and Reporting Standard for the Financial Industry, the PCAF further splits possible data quality scores into three different 'options' depending on data availability which are outlined in the table below:
Data quality |
Options to estimate the financed emissions |
When to use each option |
|
|---|---|---|---|
Score 1 |
Option 1: Actual building emissions |
1a |
Primary data on actual building consumption (ie metered data) is available. Emissions are calculated using actual building energy consumption and supplier-specific emission factors specific to the respective energy source. |
Score 2 |
Option 1: Actual building emissions |
1b |
Primary data on actual building energy consumption (ie metered data) is available. Emissions are calculated using actual building energy consumption and average emission factors specific to the respective energy source. |
Score 3 |
Option 2: Estimated building emissions based on floor area |
2a |
Estimated building energy consumption per floor area based on official building energy labels AND the floor area are available. Emissions are calculated using estimated building energy consumption and average emission factors specific to the respective energy source. |
Score 4 |
Option 2: Estimated building emissions based on floor area |
2b |
Estimated building energy consumption per floor area based on building type and location-specific statistical data labels AND the floor area are available. Emissions are calculated using estimated building energy consumption and average emission factors specific to the respective energy source. |
Score 5 |
Option 3: Estimated building emissions based on number of buildings |
3 |
Estimated building energy consumption per building based on building type and location-specific statistical data AND the number of buildings are available. Emission are calculated using estimated building energy consumption and average emission factors specific to the respective energy source. |
Actual building emissions
Figure 2 outlines the process flow for calculations using actual building emissions.
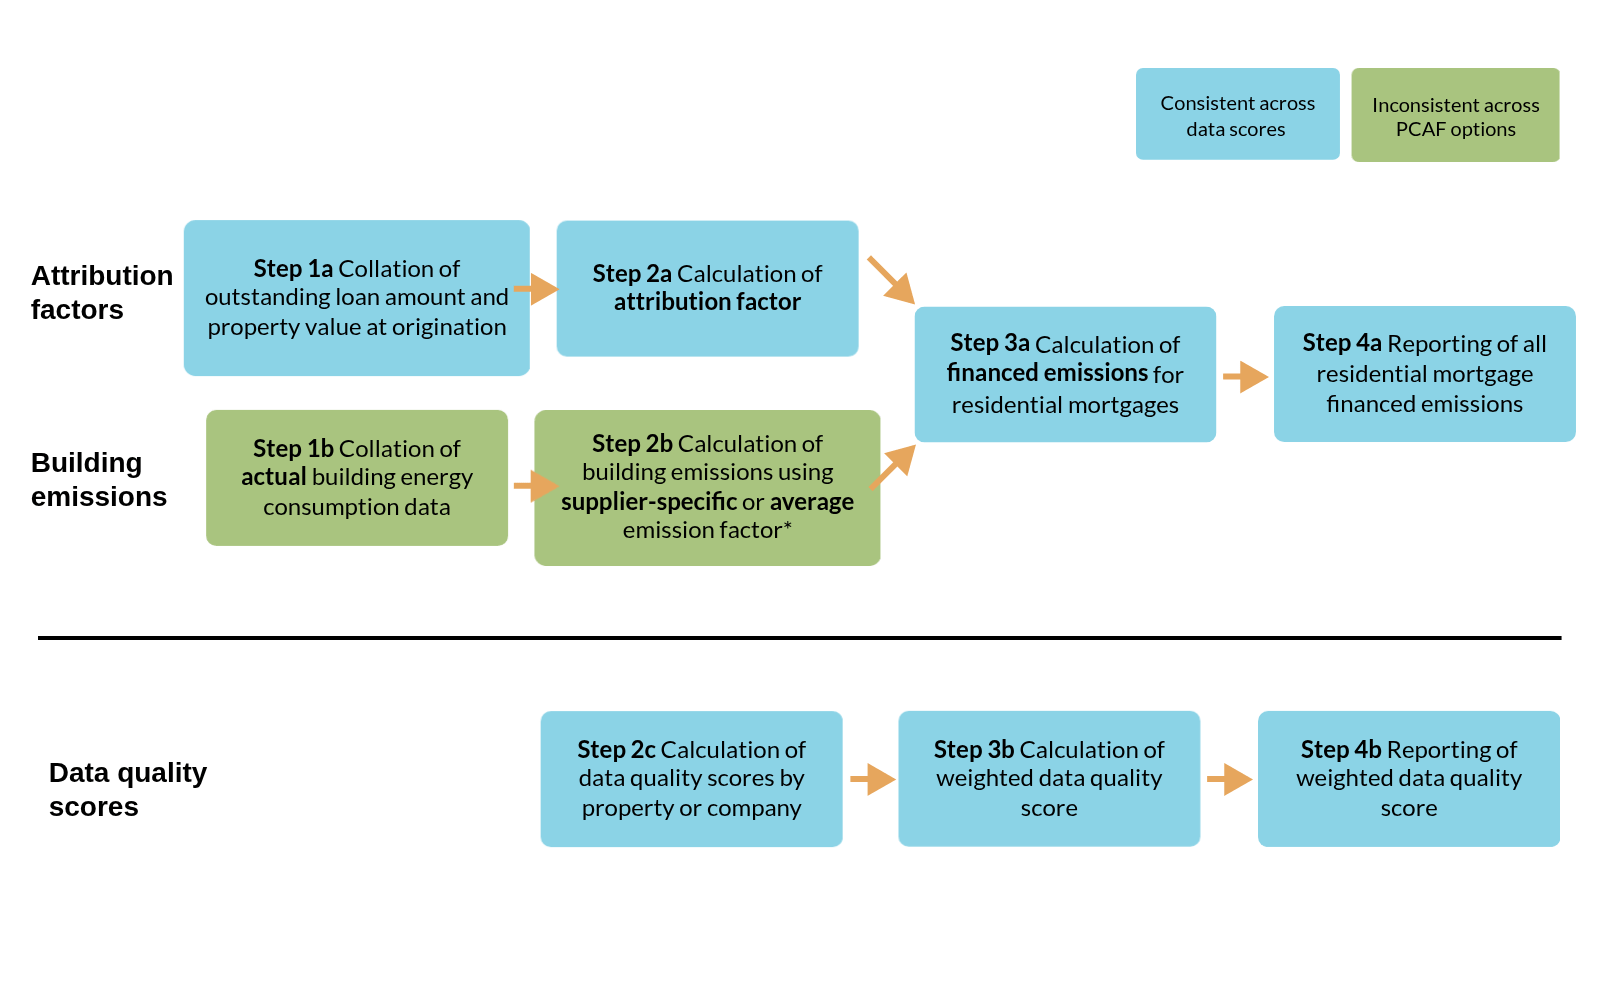
Notes:
- Data quality score 1 uses supplier-specific emission factors.
- Data quality score 2 uses average emission factors.
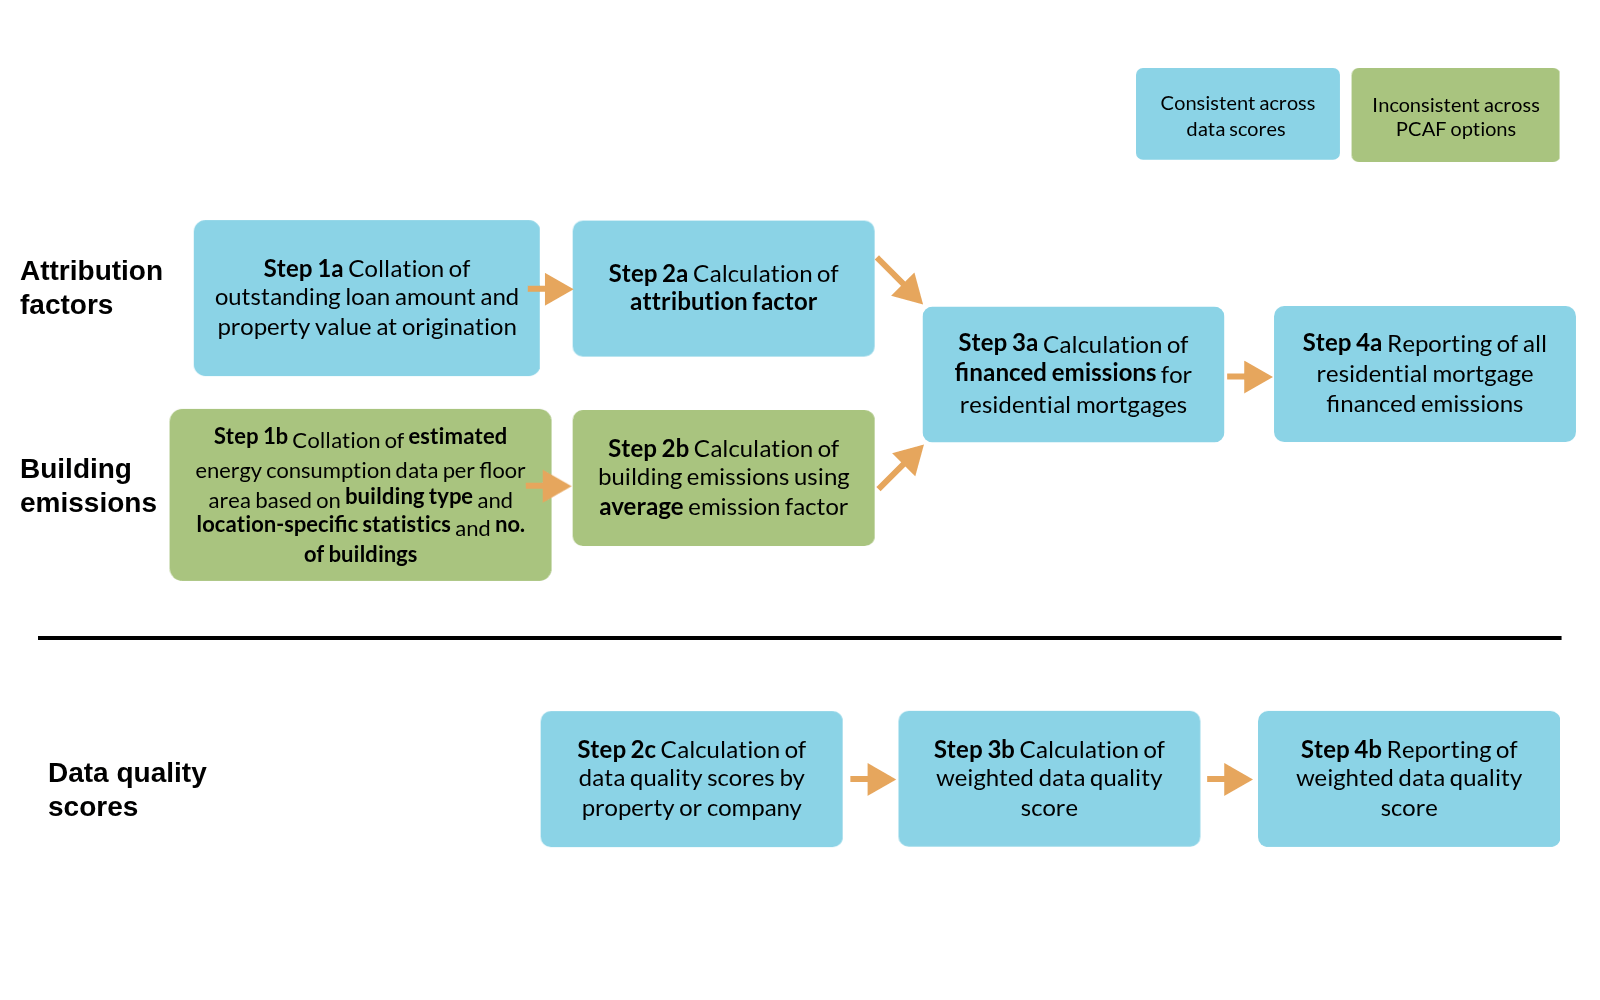
Estimated emissions based on floor area
Figure 3 outlines the process flow for calculating emissions for residential mortgages using estimated building emissions based on floor area.

Notes:
- Data quality score 3 uses estimated building energy consumption per floor area based on official building energy labels and floor area.
- Data quality score 4 uses estimated building energy consumption per floor area based on building type, location-specific statistical data and floor area.
Emissions based on number of buildings
Figure 4 outlines the process flow calculating emissions for residential mortgages using estimated building emissions based on the number of buildings.
Note:
- Data quality score 5 uses estimated building energy consumption per building based on building type and location-specific statistical data and number of buildings.
Common challenges
Obtaining and sourcing data
It can be difficult to gather accurate data from various financed assets, insured assets and investments. This often involves dealing with multiple data sources and varying data quality. While larger counterparts may produce Scope 1 and 2 data, many small and medium-sized companies do not.
Practical considerations for assurance providers
- Clarity and completeness of data inputs in the model.
- Importance of walkthroughs up front – do they stack up with documented model?
- Third parties and management oversight – how are management comfortable with information from these sources?
Use of proxies and estimates
As a result of the lack of direct data available relating to certain financed assets, insured assets and investments, reporting companies frequently rely on proxies and estimates, often from third-party data providers. This can lead to inconsistencies and less reliable reporting.
There may be a time lag in data availability given that emissions data will typically be available 12-15 months after the calendar year-end. This can lead to a mismatch between financial holdings and underlying emissions.
Practical considerations for assurance providers
- Ensure hierarchy of data, proxies and estimates are adequately disclosed in the model.
- Clarity of estimation uncertainty in model and disclosures.
- Clarity of data quality in model and disclosures.
Diverse portfolios
Different types of assets and investments require different approaches to data collection and estimation, adding complexity to the process. For example, fixed income and sovereign assets are a particularly difficult asset class to calculate the emissions for.
The treatment of portfolio changes—specifically divestments and new investments - and the timing of what is reported and when remains a significant challenge. In the absence of clear guidance, this often results in inconsistent practices across reporting entities, undermining comparability and transparency
Disclosures often exclude the Scope 3 emissions of underlying investees - something that may be less relevant for residential mortgage portfolios but becomes a significant gap when assessing broader investment activities.
Consistency and comparability
Ensuring that the presentation of emissions data is consistent and comparable across different reporting periods and entities is a significant challenge. Given the evolving standards relating to Scope 3 emissions, prior year adjustments and re-baselining exercises are often required. There is also the challenge of assessing how material prior-year errors and adjustments are and whether these need to be re-reported or not.
Given the multiple different data inputs and variables in financed emissions calculations, it can be difficult to understand whether movements are due to portfolio decisions, movements in financial data, improving data quality or other factors.
Guidance created with permission from PCAF
This guidance is based, with permission, upon the work of the Partnership for Carbon Accounting Financials (PCAF) including the data quality score tables from The Global GHG Accounting and Reporting Standard for the Financial Industry. Any discussion of implementation challenges, lessons learned, interpretations, or other commentary are the views and experiences of contributors and not those of PCAF. Please refer to the PCAF Standard for complete guidance. In the event of any inconsistency between the guidance and the PCAF standard, the standard should be considered the authoritative source and take precedence.
More support
Read more case studies and a list of common challenges facing financial services organisations when reporting and assuring scope 3 emissions.
Case studiesChallenges