
Following on from using conditional formatting in a Power BI report to highlight our 500th tips and tricks article, this time we are looking at adding stars to our on-demand courses resource page to highlight the most relevant posts for each of our 6 modules. As part of allocating stars to articles, we will look at different ways of relating tables to each other in a relational database.
Introduction
Last month, we used the excuse of the posting of number 500 in our Excel Tips and Tricks series to see how to add a star to an item in our article archive portal. This time, using our on-demand course resource page in the Power BI archive article as an example, we are going to look at how we can use a special type of data table to deal with a many-to-many relationship between database tables. The table we create will allow us to add stars to our list of posts by module to help highlight the articles that are most relevant to each of the modules in the set of six courses.
Joining tables of data
Being able to combine more than one table of data is a common spreadsheet requirement, even when working with small quantities of data in a single workbook. In a recent Excel Community article, Mark Proctor looked at one of the main principles underlying the way that data should be structured: the first normal form. This principle helps determine how data should be structured within a table and often requires data to be split into multiple tables. Important as using multiple tables is, it does mean that you will often need to combine data from different tables to extract all the information that you require to report on. Using an Excel formula, you would usually use a lookup function such as XLOOKUP() to add a column from one table to another, using a matching field to make the connection. As a simple example, you might want to include client name and address information for each row of a table of orders. Each of the two tables would need to include a client account code. This code would allow you to match each row of the order table to the client table in order to be able to add the correct client details to each row of the order table. Because the client table only includes each client account code and details once, whereas the order table can include many rows that include the same client account code, this is referred to as a one-to-many relationship.
However, not all joins between tables are directly one-to-many. For example, if you had a list of technical articles that were categorised by topic and you wanted to compile a list of the key articles for each category, not only would many articles be relevant to one category, but one article might be relevant to more than one category. This creates a many-to-many relationship between our tables. In order to cope with this, we need to create an additional table that contains at least two columns. One will contain the reference to the unique ID field in our articles table, and the other will contain the reference to the unique ID field in our category table. This new table, sometimes called a junction table, sits between our two main tables.
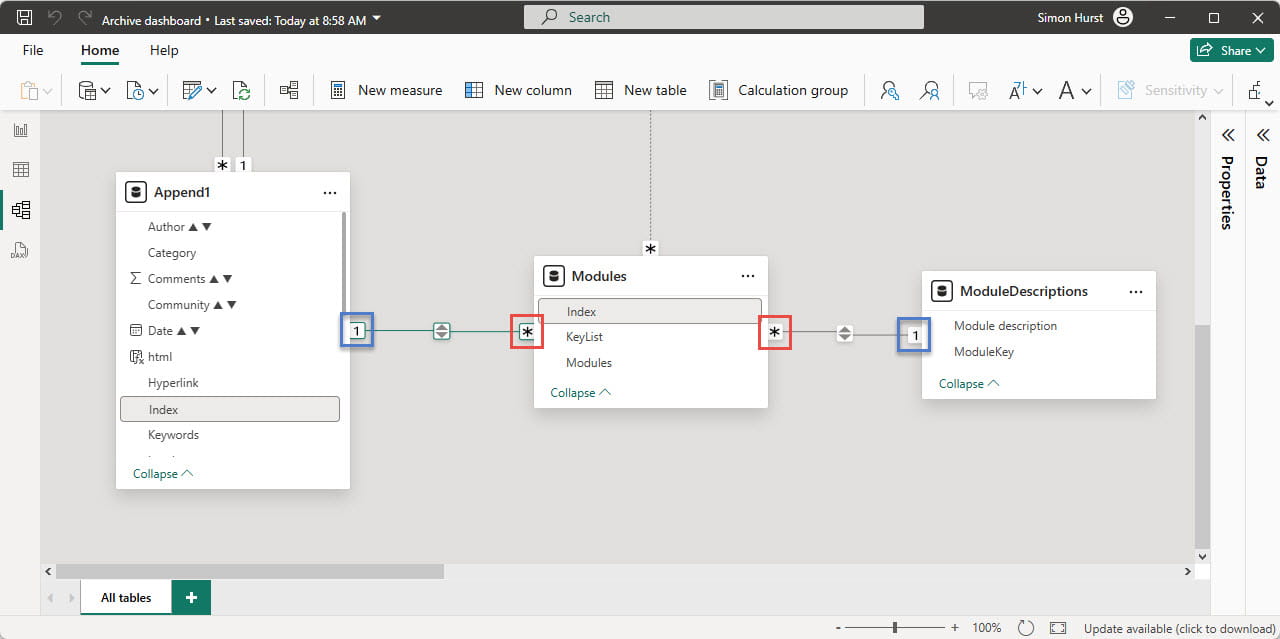
Our junction table can contain many rows with the same article ID, so the relationship between it and the article table is one-to-many. Similarly, the junction table can contain many rows with the same category, so its relationship with the categories table is again one-to-many. The two one-to-many relationships allow us to create our many-to-many relationship. In the Power BI model window below, the 1 icon at the end of the join line represents the ‘one’ end of the join, with the asterisk indicating the ‘many’ side:
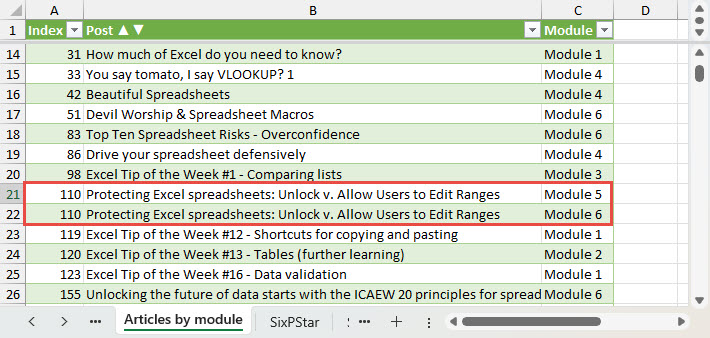
In this extract we can see that article 110 is linked to both Module 5 and Module 6:
Star quality
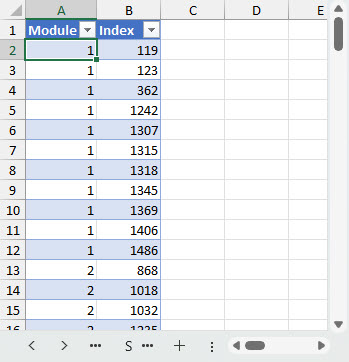
We have used this idea of a junction table to allocate stars to our recommended articles for each of the six modules in our on-demand course series. Our table includes a column for our article index number and another to indicate which module each star relates to. This allows us to include the same article ID on multiple rows if an article was deemed worthy of star status for two or more modules, although it would require some additional work to create the required relationships.
Our initial table is very simple, with just columns for module number and article ID:
We can add this table to our Power BI data model and use it to create a simple graphic that allows us to display just the starred articles for each of our six modules. We have added the Star icon to the post using the same conditional formatting technique that we used in the previous article to add a star to our 500th Tips and Tricks post. Here, we have clicked on Module 4 in our table of modules to display just the starred posts for that module:
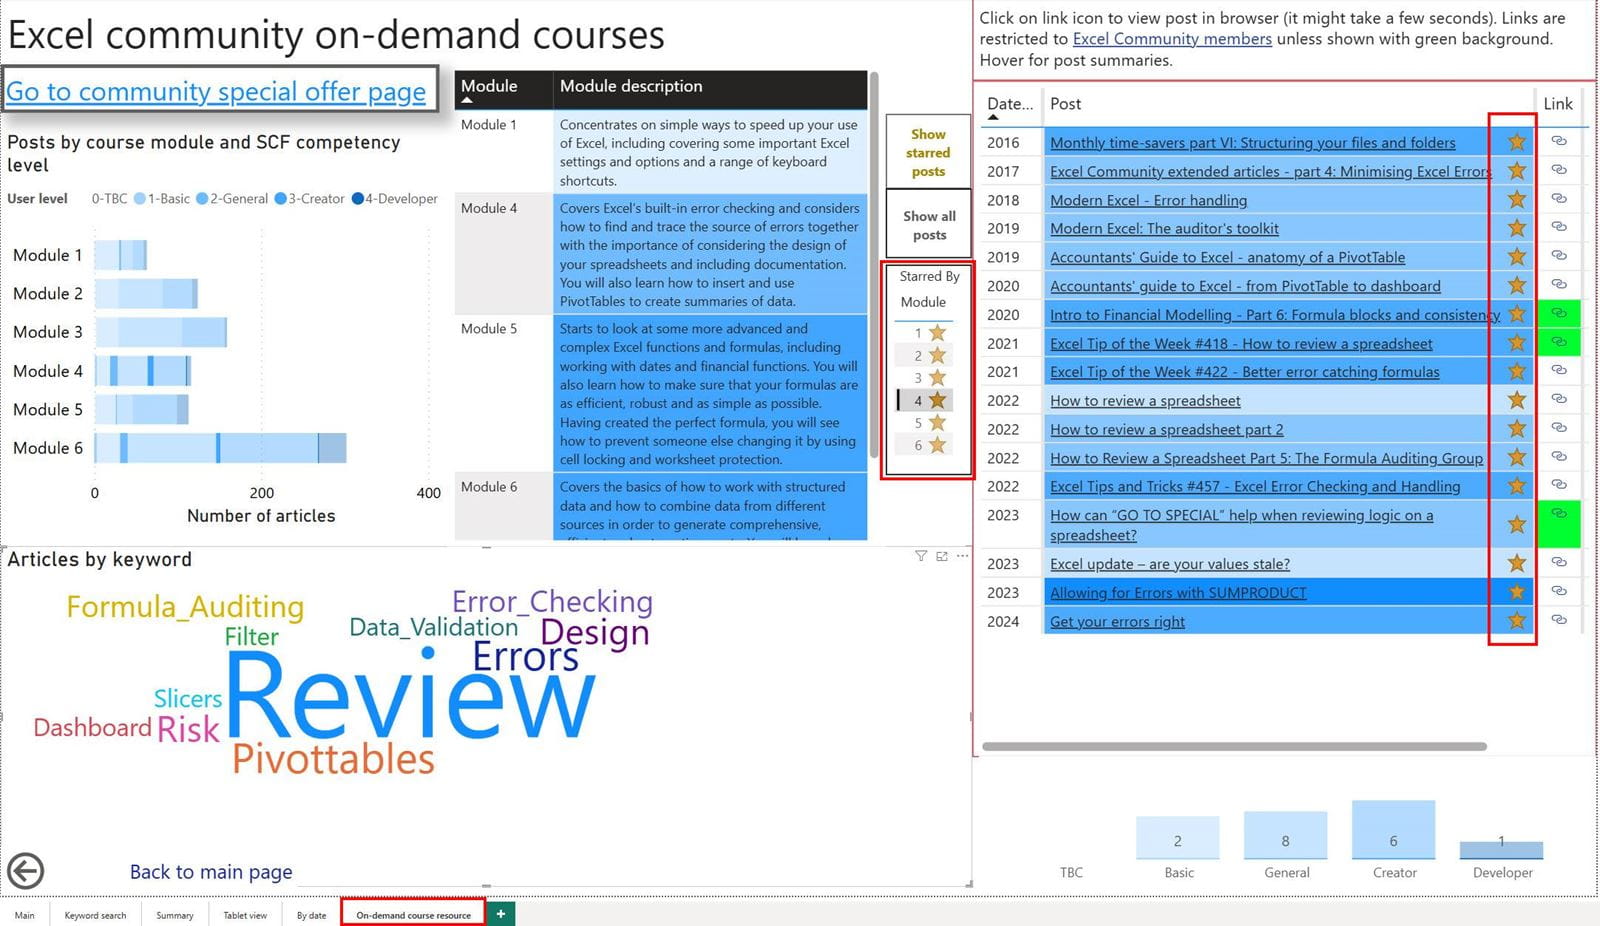
We will look at the techniques used within the Power BI report to filter by star in a future post, including seeing why selecting only starred posts using the ‘Show starred posts’ button, then selecting Module 4 from the bar chart visual, could display a different list of articles compared to selecting the 4 star option in our table.
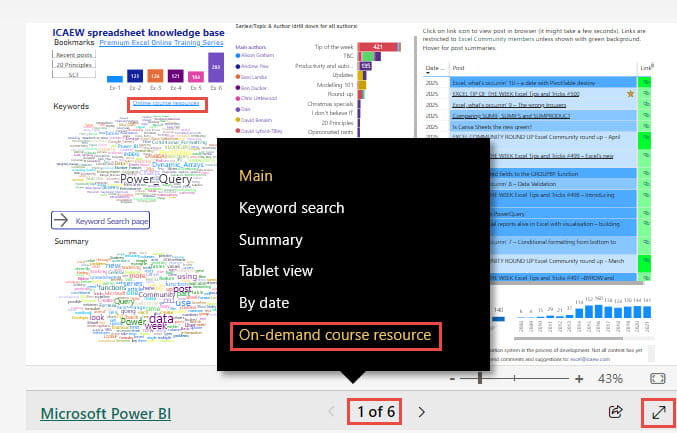
To try the stars out for yourself using the embedded version of the archive portal report in the following section, click on the page numbers and choose the ‘On demand course resource’ page or use the right ‘Next Page’ chevron to navigate to page 6. Alternatively, there is a hyperlink to the page just above the ‘Keywords’ visual on the report’s Main page:
Embedded Power BI report
Note that you can use the full screen icon at the bottom right of the embedded report to change the display to full screen and then the keyboard ‘Escape’ key to return to the embedded view.
Additional resources
You can explore all aspects of Excel, including many articles on Power BI, in the ICAEW archive. Click on ‘Archive project’ in the ‘Series/Topic & Author’ graphic to see the list of articles that detail the creation of the archive portal and its subsequent development:
Archive and Knowledge Base
This archive of Excel Community content from the ION platform will allow you to read the content of the articles but the functionality on the pages is limited. The ION search box, tags and navigation buttons on the archived pages will not work. Pages will load more slowly than a live website. You may be able to follow links to other articles but if this does not work, please return to the archive search. You can also search our Knowledge Base for access to all articles, new and archived, organised by topic.
