
In our short series on Power BI and conditional formatting we have so far added a star to highlight our 500th Tips and Tricks article and then created a table to identify key articles for our on-demand course modules so that we can add a star to each of those articles too. This has given us the opportunity to look at data structures and joins between tables as well as conditional formatting itself. This time we will investigate the table joins in a bit more detail.
Introduction
Last time, we used our on-demand course resource page in the Power BI article archive as an example of using a special type of data table to deal with a many-to-many relationship between database tables. The table was used to add stars to our list of posts by module, to help highlight the articles that are most relevant to each of the modules in the set of six courses. This time, we are going to look in detail at the joins between tables, including editing and creating joins manually.
Table joins in Power BI
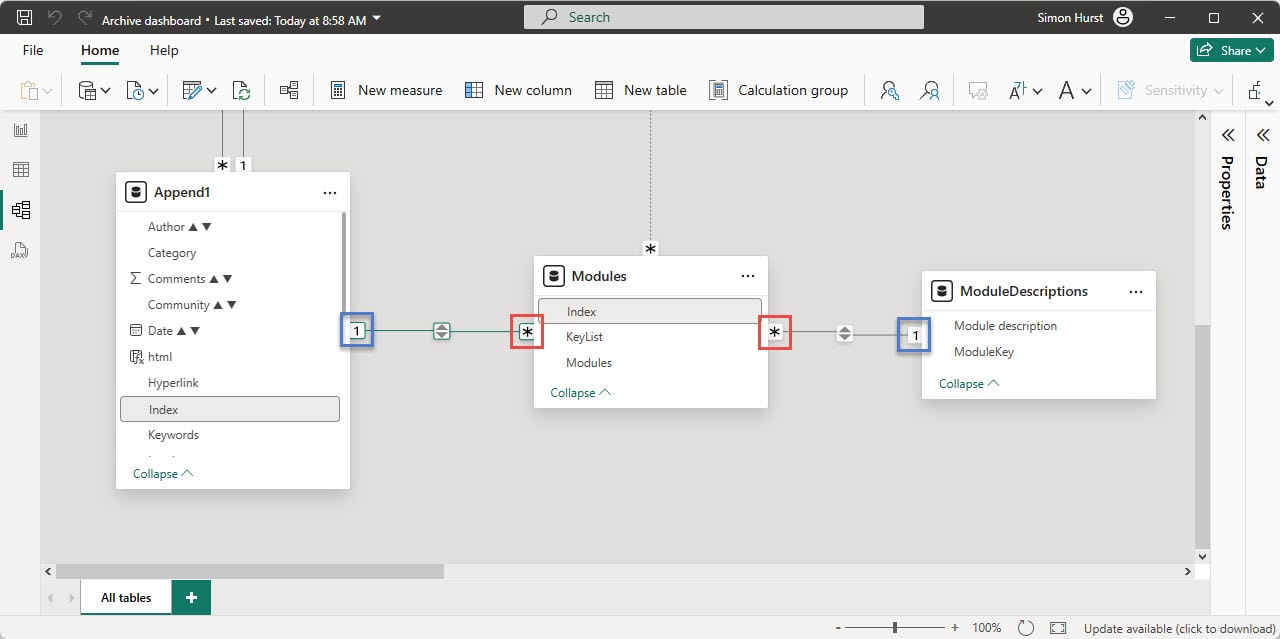
In the previous example, we used the example of the one-to-many join between Append1 and Modules, and the many-to-one join between Modules and ModuleDescriptions to show how to create a many-to-many relationship between Append1 and ModuleDescriptions. In the Power BI model window below, the 1 icon at the end of the join line represents the ‘one’ end of the join, with the asterisk indicating the ‘many’ side:
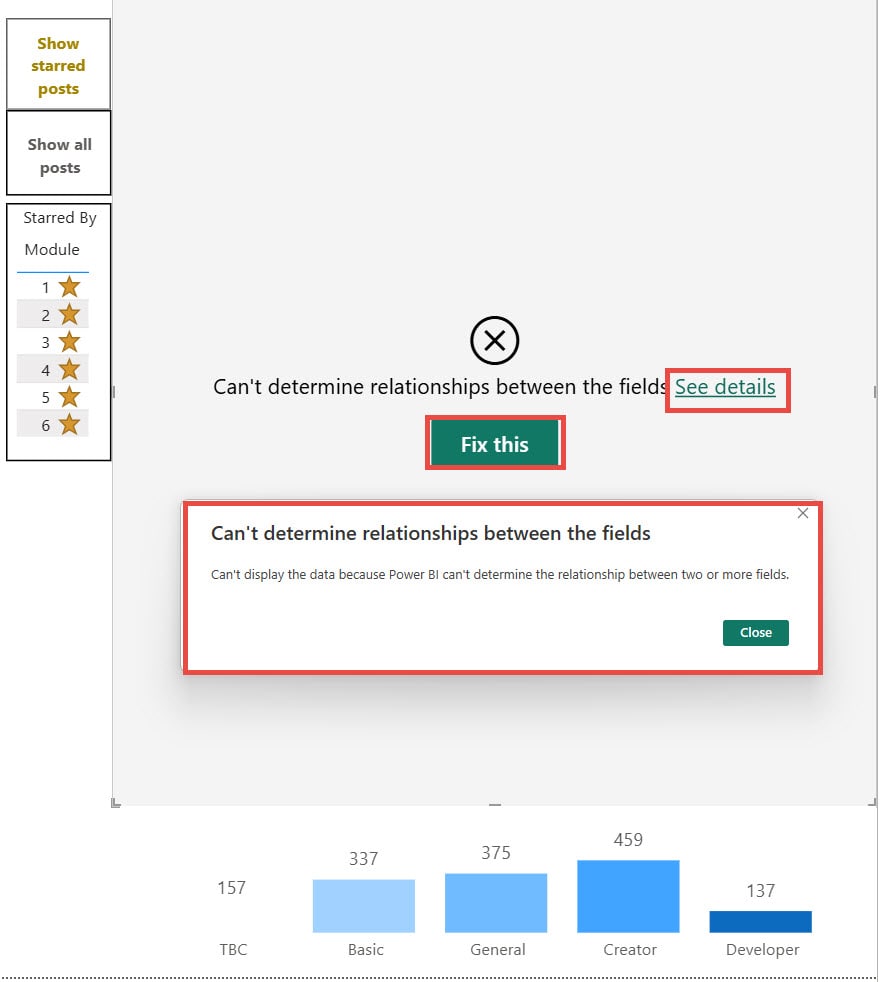
For straightforward joins, Power BI will often manage to create the required joins automatically. If Power BI finds that a join is needed, it will prompt to create one:
The ‘Fix this’ button will display the Relationship Detection dialog allowing you to choose between Autodetect to create a relationship automatically, or Create Relationship to allow you to create the relationship manually:
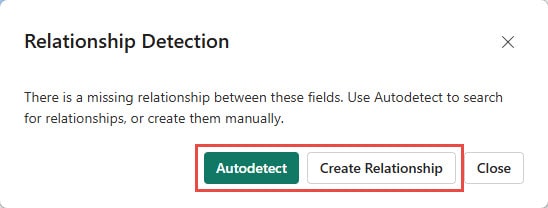
In our case, Autodetect is unable to find a relationship, so we will need to use the Create Relationship button to open the Manage relationships dialog:
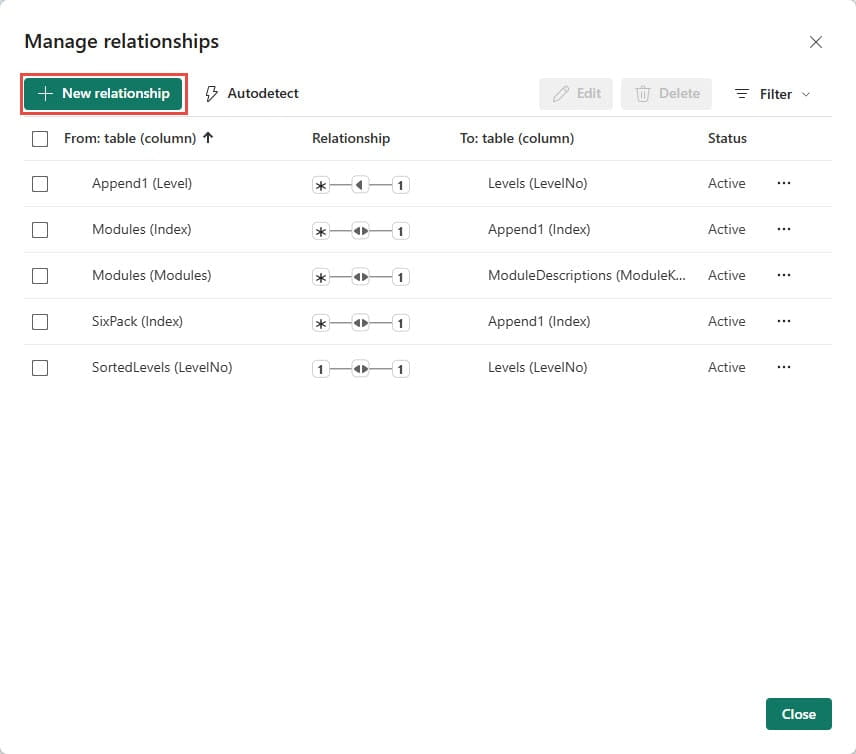
The New relationships button opens the dialog to create the required relationship, by choosing each table from the ‘From table’ and ‘To table’ dropdowns, and then choosing the specific columns that create the relationship:
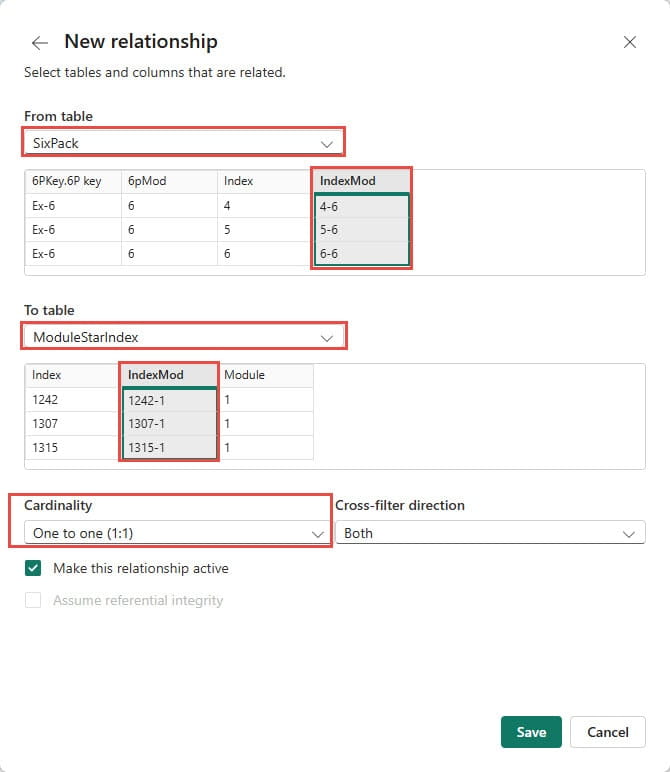
It is also possible to choose the type of join or ‘Cardinality’. In the case of our Stars, our relationship is the relatively unusual one-to-one because we have created IndexMod columns in both of our tables to hold the concatenation of our article Index and module identifiers, separated by a dash. Our IndexMod columns hold a unique identifier allowing a single article to be attached to any of our six modules, meaning that a single article can be ‘starred’ for multiple modules.
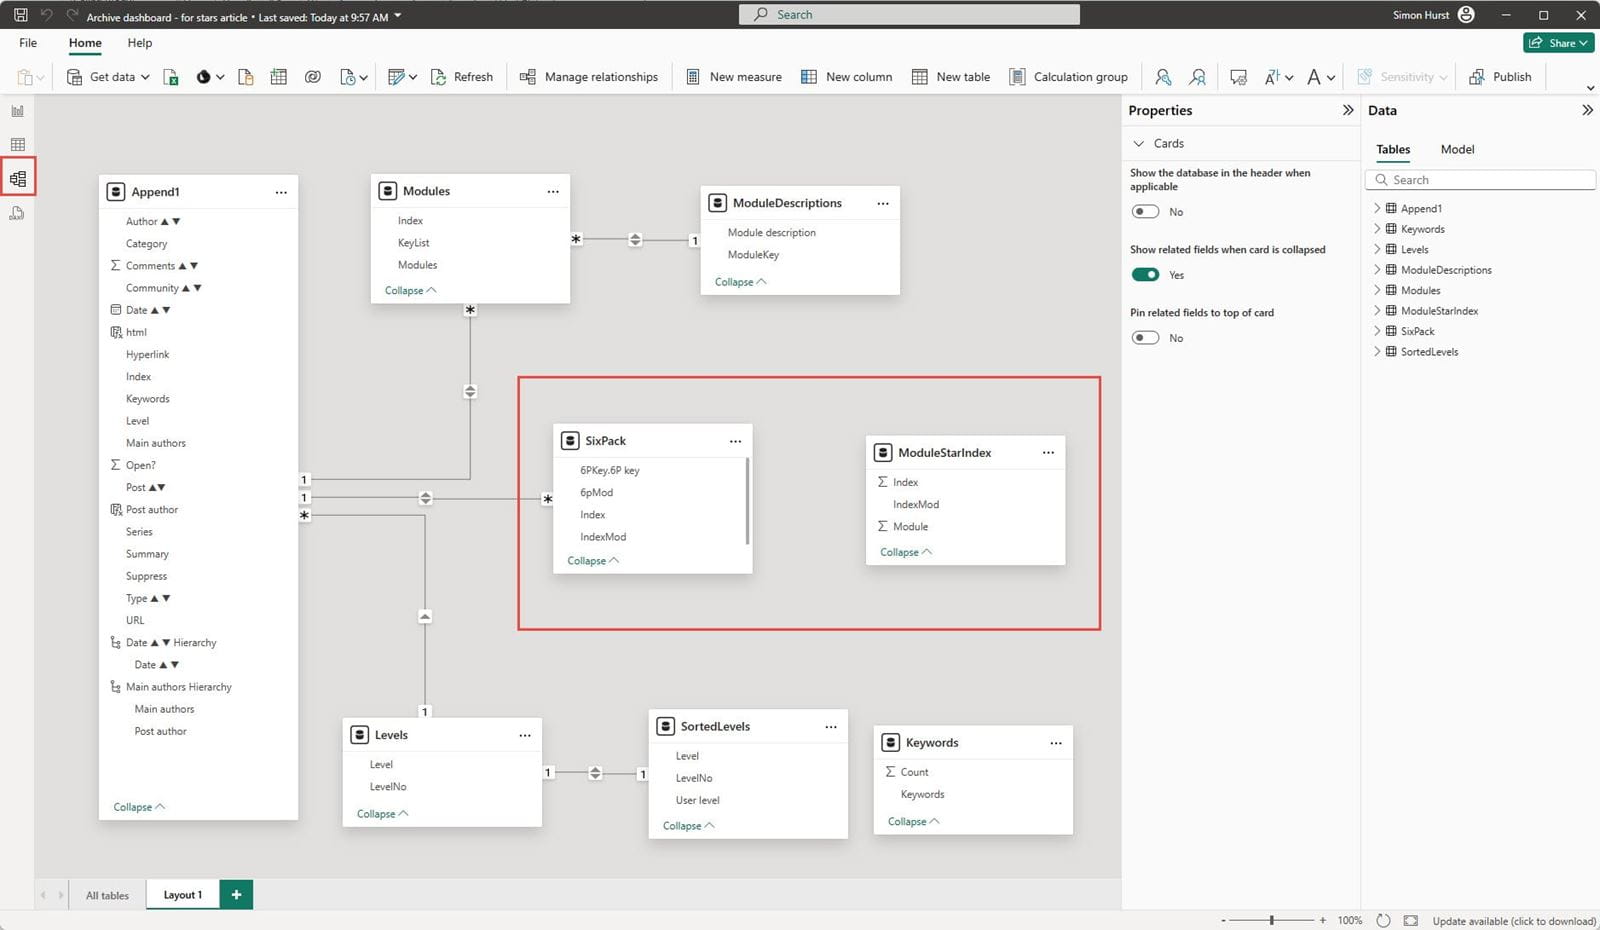
As an alternative, and more visual, way of creating our relationship, we can go to the model view of our tables and their relationships by clicking on the ‘Model view’ button at the left of our Power BI window:
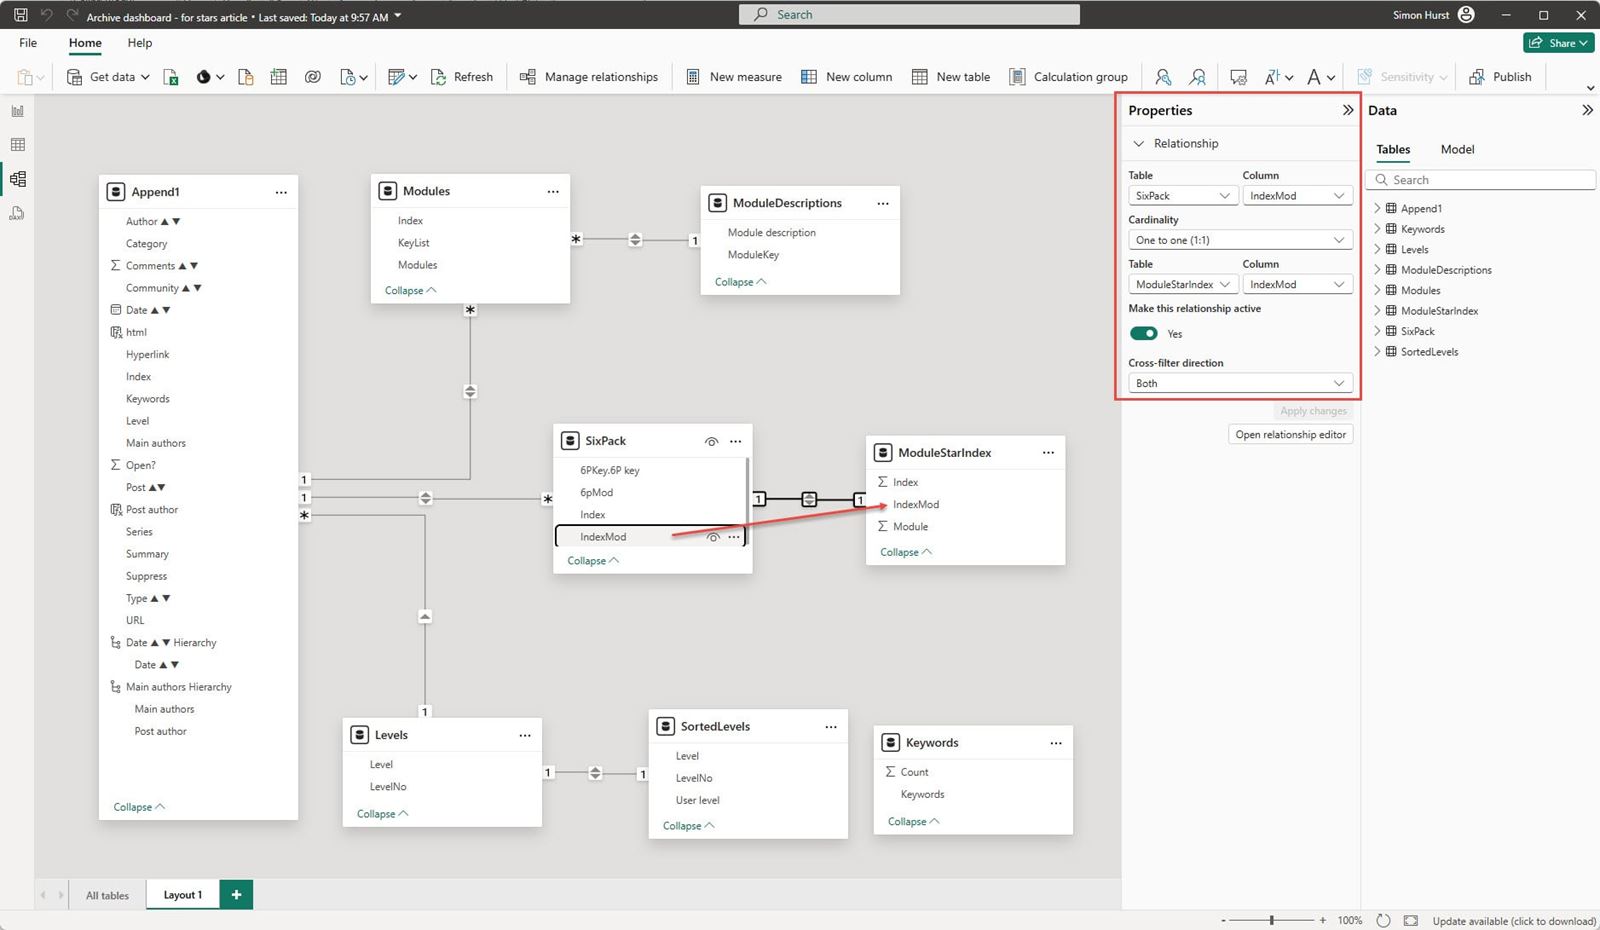
We can then drag the IndexMod column heading from our SixPack table to the IndexMode column heading in our ModuleStarIndex table to create our join. The Properties pane, or right-clicking on the join line and choosing Properties, will then display the details of our join:
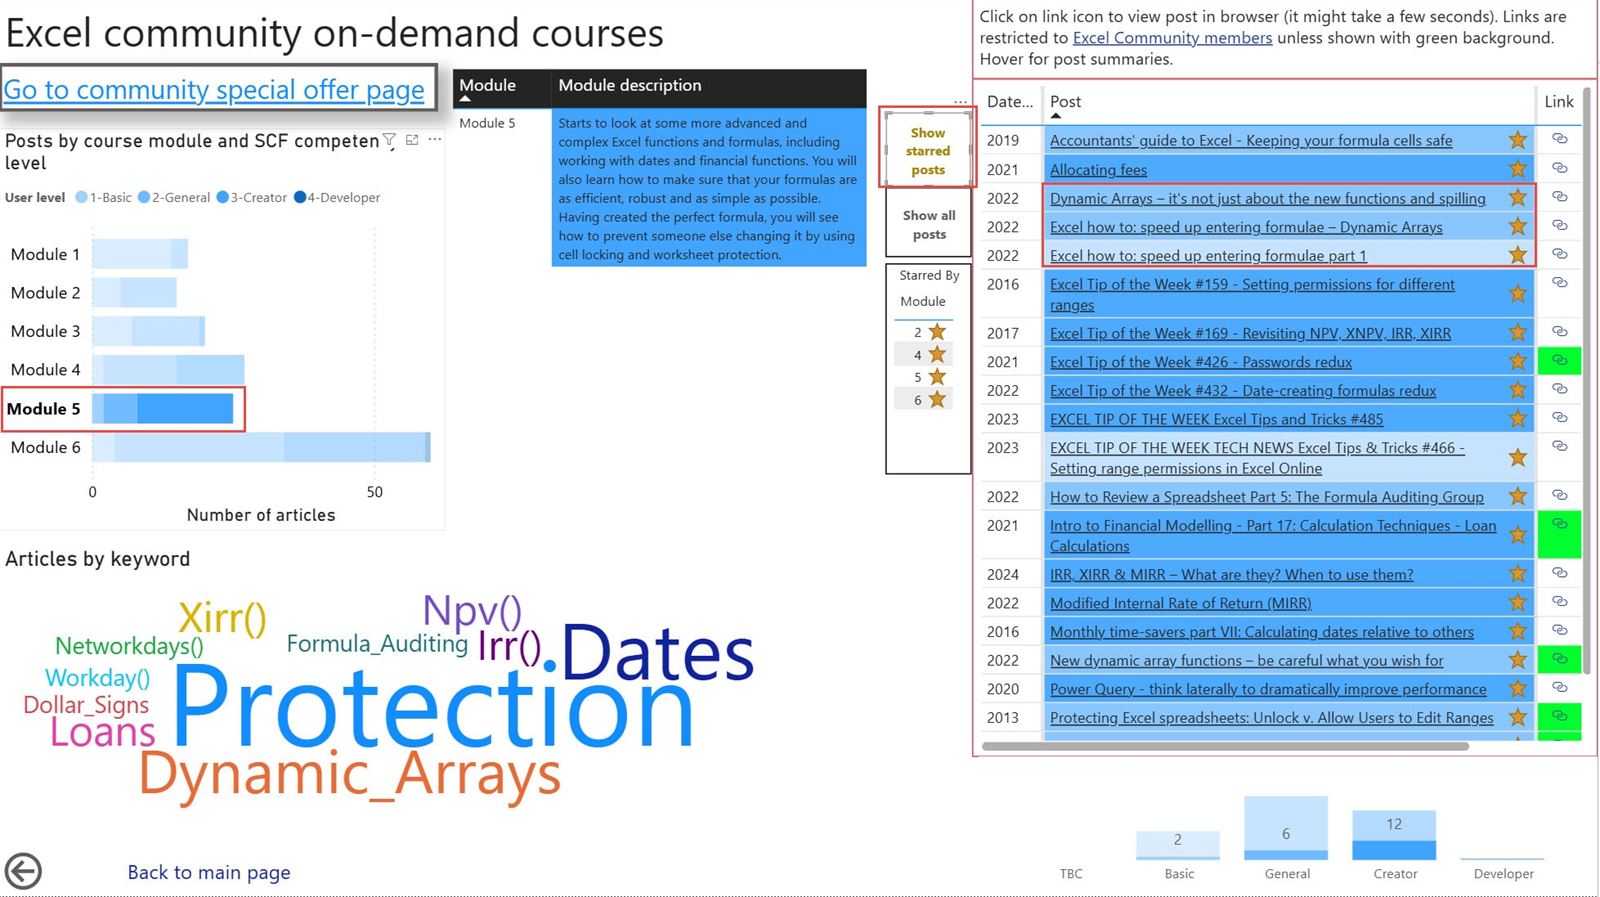
With our relationship created, our Power BI report now shows our list of articles with conditional formatting displaying a Star for our starred articles. We have added a simple table that displays our list of module numbers and again uses conditional formatting to add a star, solely for cosmetic purposes. Clicking on a row of this table will filter our list of articles so that it just shows the articles that have been starred for that module:
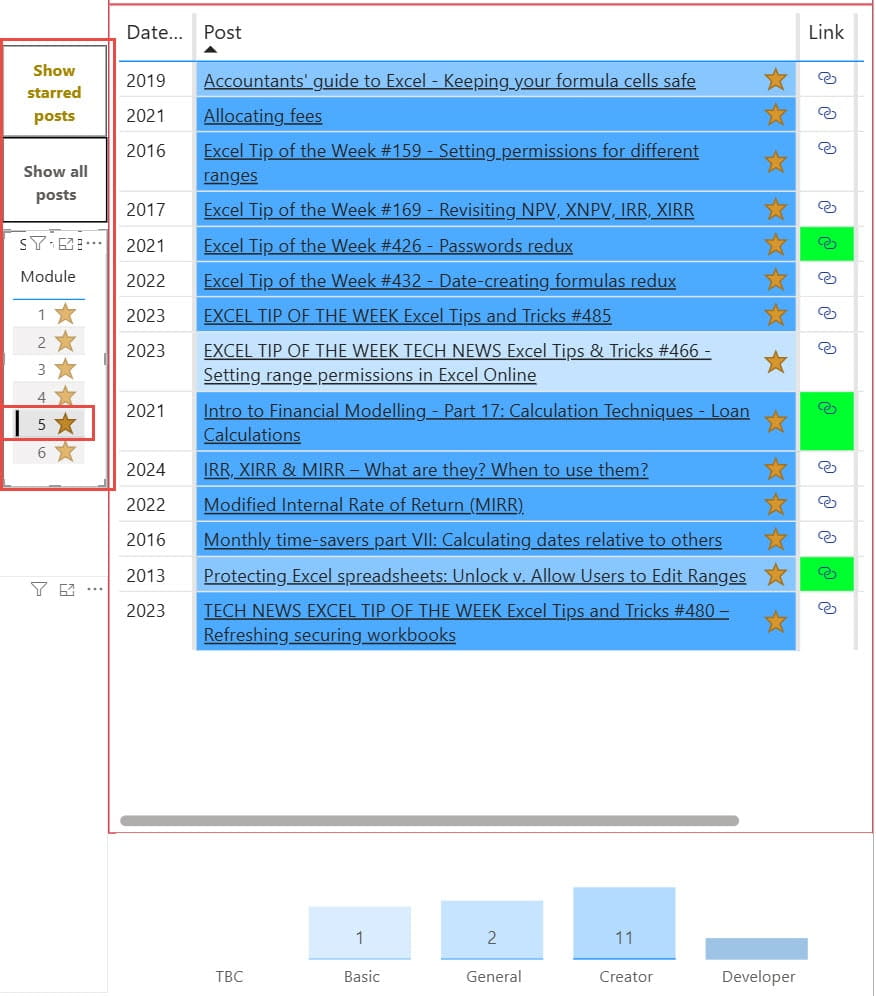
You might be wondering why we can’t just choose the module from our bar chart visual and then use the ‘Show starred posts’ button to do the same thing. As we see below, this displays any articles that are allocated to Module 5 and have been marked as starred modules. However, this would include any module 5 articles that have been starred for any other module, as well as specifically for module 5:
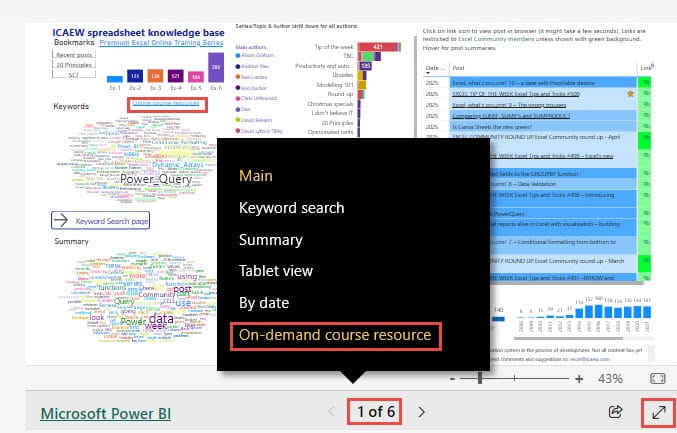
To try the stars out for yourself using the embedded version of the archive portal report in the following section, click on the page numbers and choose the ‘On demand course resource’ page or use the right ‘Next Page’ chevron to navigate to page 6. Alternatively, there is a hyperlink to the page just above the ‘Keywords’ visual on the report’s Main page:
Embedded Power BI report
Note that you can use the full screen icon at the bottom right of the embedded report to change the display to full screen and then the keyboard ‘Escape’ key to return to the embedded view.
Additional resources
You can explore all aspects of Excel, including many articles on Power BI, in the ICAEW archive. Click on ‘Archive project’ in the ‘Series/Topic & Author’ graphic to see the list of articles that detail the creation of the archive portal and its subsequent development:
Archive and Knowledge Base
This archive of Excel Community content from the ION platform will allow you to read the content of the articles but the functionality on the pages is limited. The ION search box, tags and navigation buttons on the archived pages will not work. Pages will load more slowly than a live website. You may be able to follow links to other articles but if this does not work, please return to the archive search. You can also search our Knowledge Base for access to all articles, new and archived, organised by topic.
