
We’re going to look at how to use Excel’s inbuilt statistical functions to compute some other statistical measures based on just the mean and standard deviation, and then will compare with the actual values computed directly from our dataset. It’s important to remember that the values computed directly from the data are the ones for this sample only; the values from the computations are the ones for our best estimate of the true global distribution of all of the data.
Percentiles
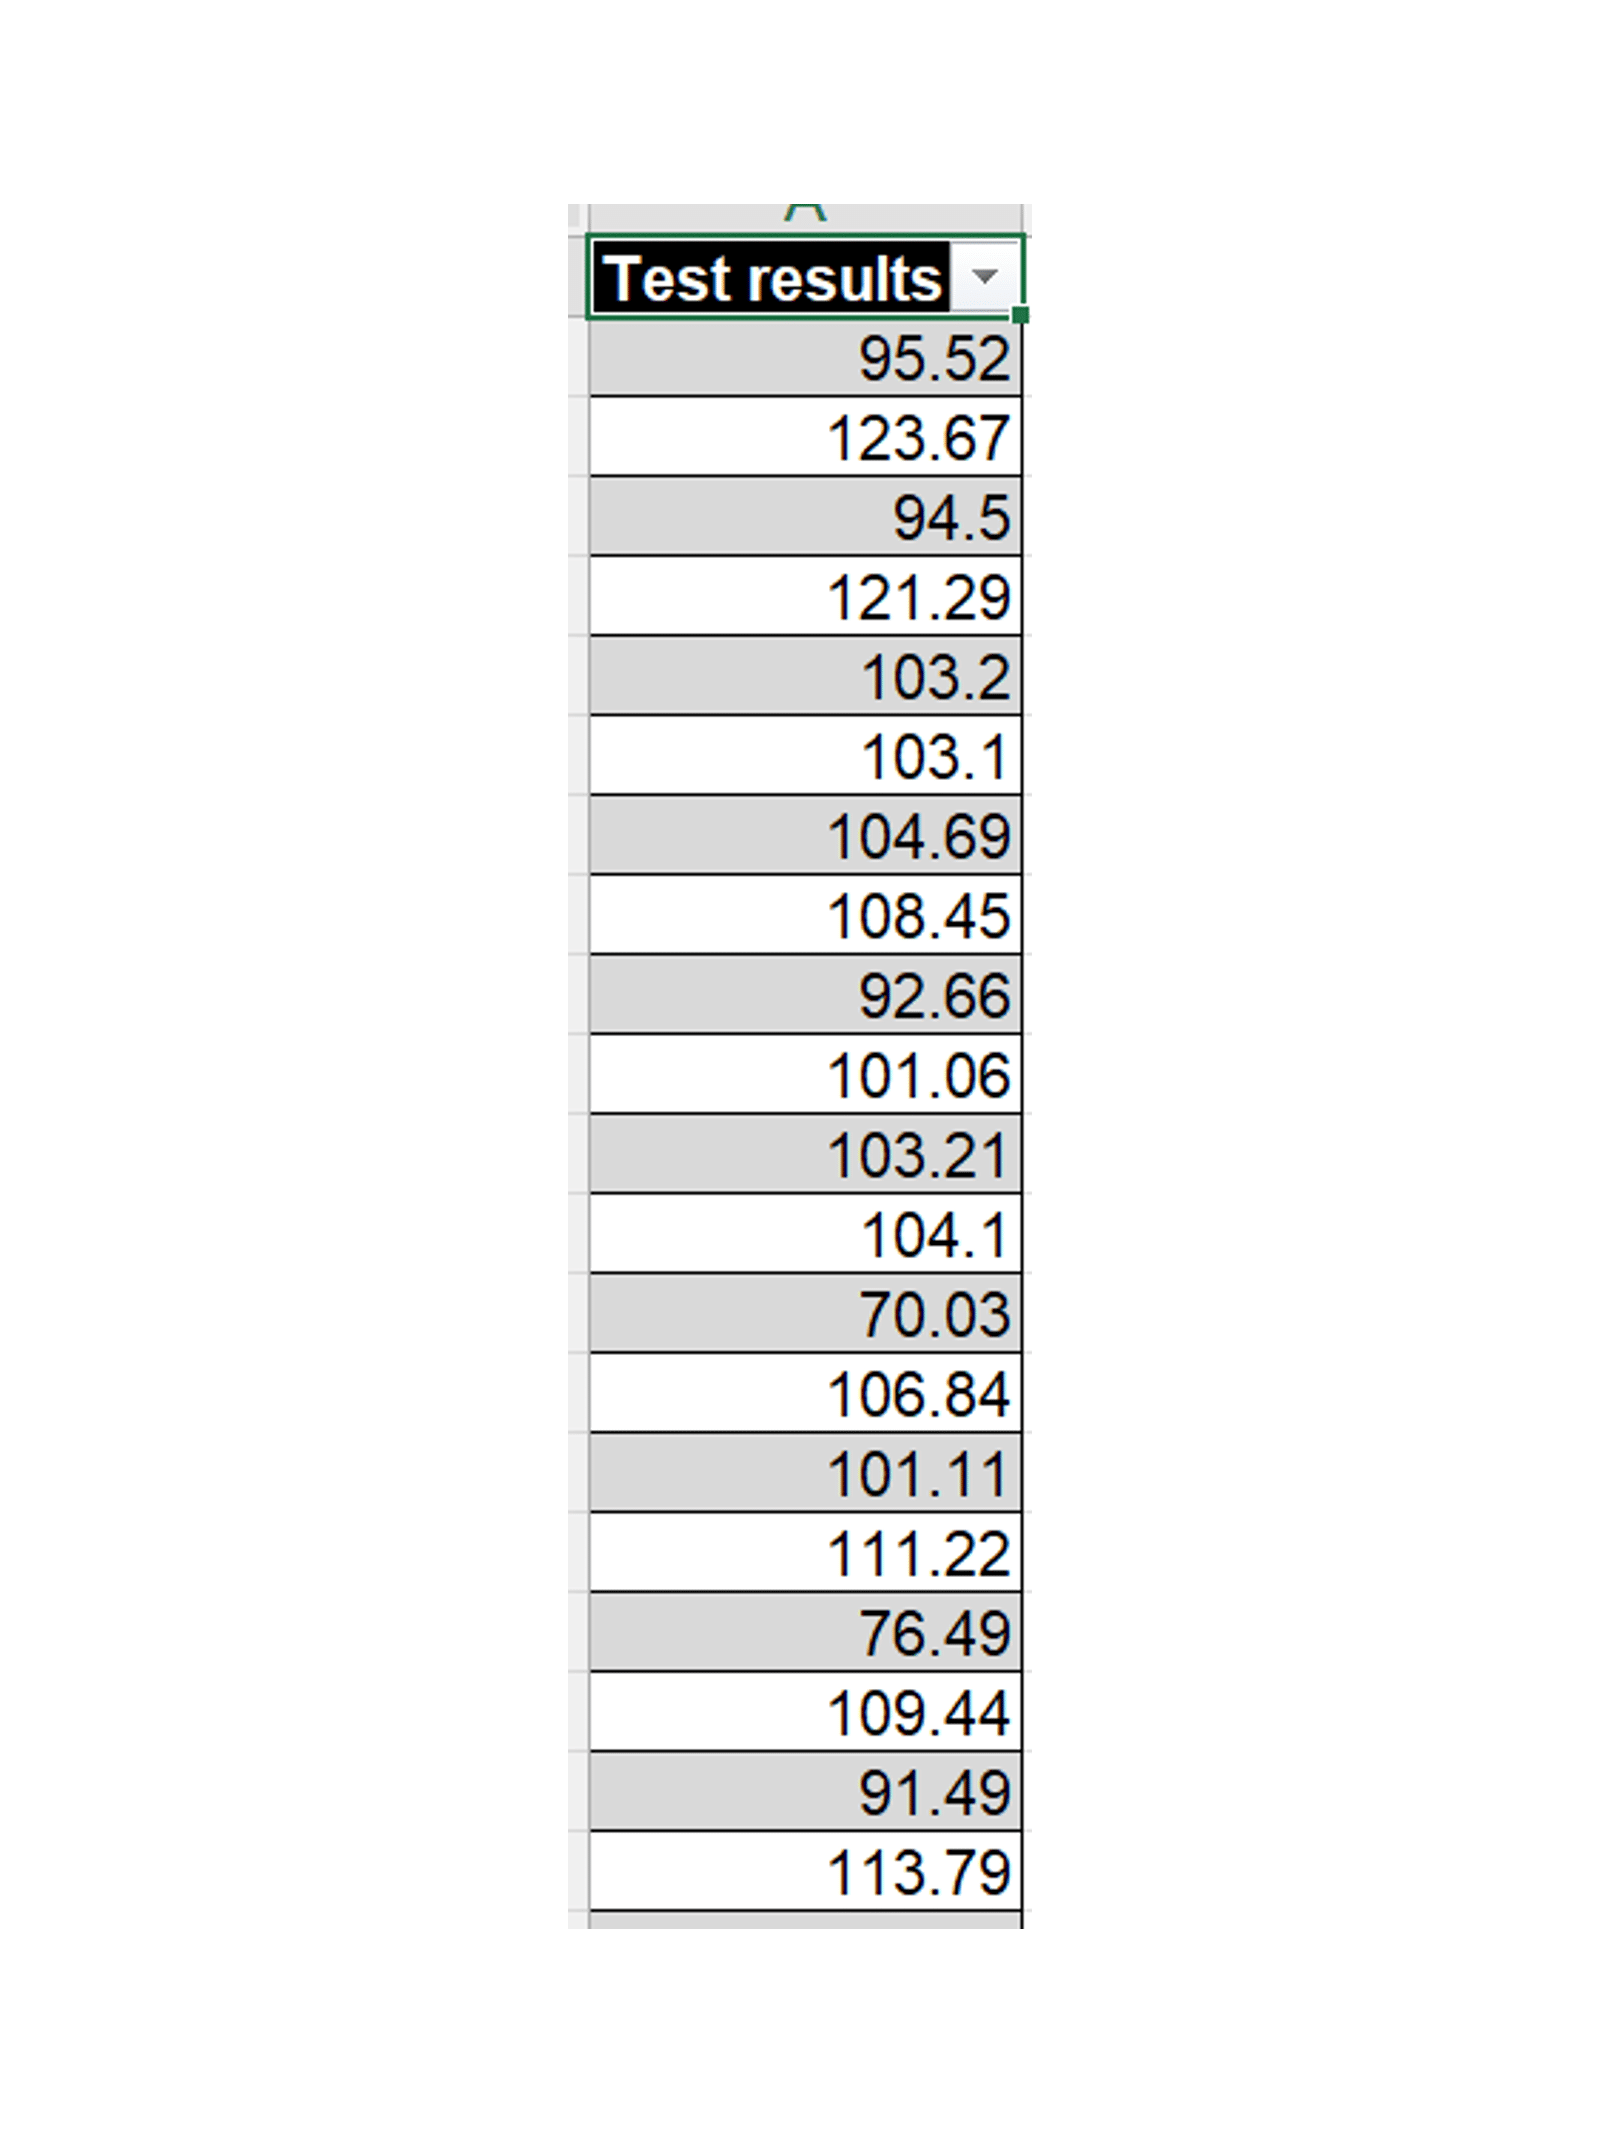
Let’s see we want to compute the 35th percentile for our data, just from the mean and standard deviation. The definition of the 35th percentile is “the value beneath which 35% of the data lies”. We can compute that directly in Excel with:
=NORM.INV(35%, average, standard deviation)
We can check the result of this calculation against the actual figure calculated from the source data using PERCENTILE.INC – they will be close together but, because of the imperfections of using a distribution, won’t be identical:
Confidence intervals
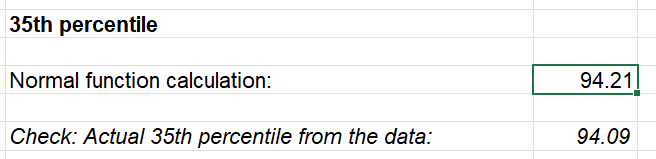
Another common measure that’s particularly popular for projections is that of a confidence interval – that is, a range where we can reasonably confident that the next value will fall into. A common one is a 95% confidence interval, so let’s look at that.
Conceptually, let’s think about what a 95% confidence interval represents for a normally distributed variable:
A 95% confidence interval is a range where we expect 95% of the data to fall. Because the range is centred on the mean, we would expect 2.5% of the data to fall beneath the lower bound and 2.5% to be above the upper bound.
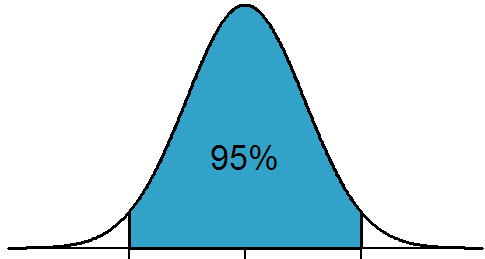
We will need to compute how wide the 95% confidence interval is in standard deviations. We can start by finding how many standard deviations below the mean we need to go to cover 2.5% of the data, which we can compute for the standard normal distribution (mean 0, standard deviation of 1) with:
=NORM.S.INV(2.5%)
This returns a value very closed to -1.96, which tells us that 1.96 standard deviations below the mean is where the interval starts. We can then multiply our standard deviation by this figure to find out where the limits lie for our example:
Again, you can see that the two measures are very close (in fact for this specific calculation they are identical).
Probabilities
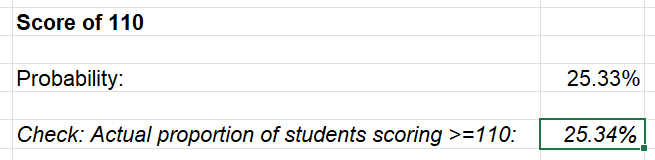
If we want to know the probability of a test-taker reaching a particular mark (or a financial measure hitting a specific target), we can compute it as follows. Let’s say our target is a score of 110 or better. Then the probability is:
=1-NORM.DIST(110, mean, standard deviation, TRUE)
Essentially, we calculate the proportion of scores that are 110 or lower, and then subtract that from 1 to find the proportion that are higher. Because the normal distribution is symmetrical, this calculation gives the same result, but it’s less intuitive to read and understand:
=NORM.DIST(2*mean-110, mean, standard deviation, TRUE)
Once again, our sample closely follows the idealised statistical value:
In the real world, you might know one of these statistics but not know the standard deviation – but the same approaches can be used to work backwards to identify the standard deviation and from there the rest of the analyses. And don’t forget to check out all the examples from today’s post in this file.
Archive and Knowledge Base
This archive of Excel Community content from the ION platform will allow you to read the content of the articles but the functionality on the pages is limited. The ION search box, tags and navigation buttons on the archived pages will not work. Pages will load more slowly than a live website. You may be able to follow links to other articles but if this does not work, please return to the archive search. You can also search our Knowledge Base for access to all articles, new and archived, organised by topic.
