
Hello all – a very happy New Year, and welcome back to the Excel Tip of the Week! This week we have a Creator level post in which we’re going to take a look at how to do a word frequency analysis using Power Query. This builds on some PQ unpivoting techniques which we recently covered in TOTW #425, so check that one out if you want a refresher.
Basic word frequency analysis
We’ll be using this dataset of customer reviews of hotels:
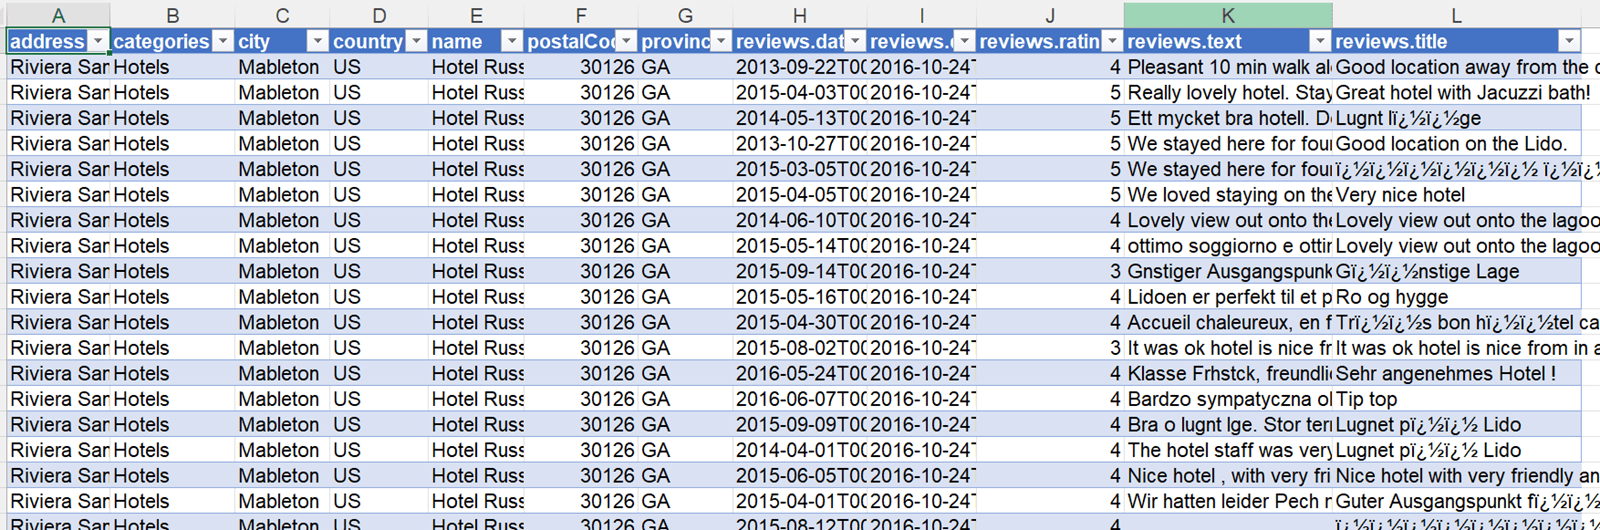
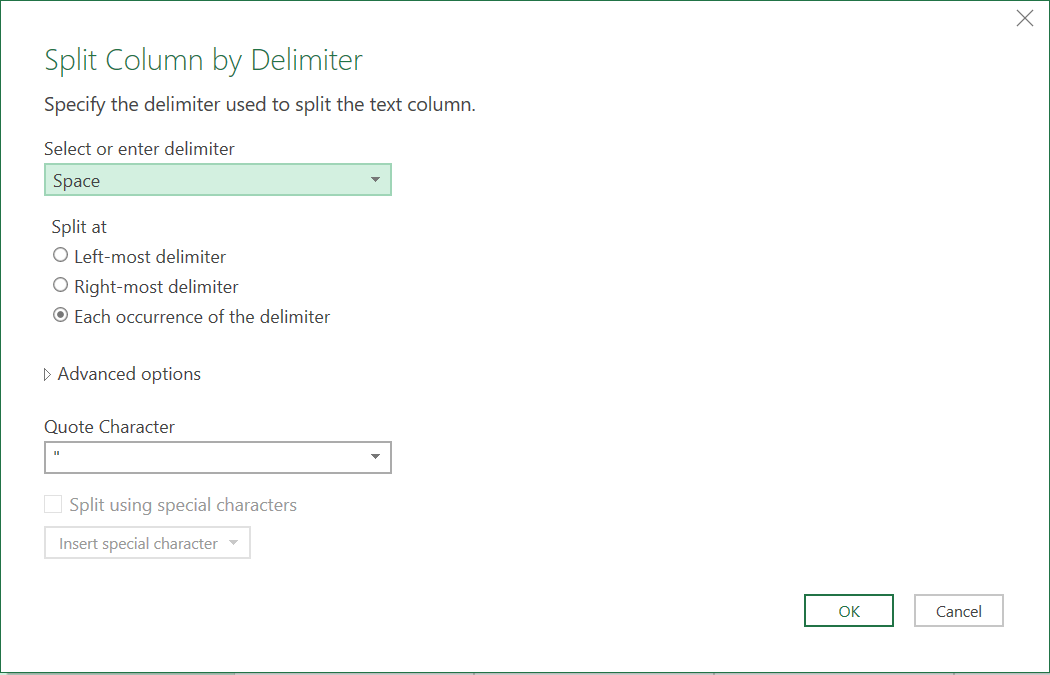
As you can see, the review text column isn’t 100% in English – but it is mostly English, and we’ll be focusing on the most common words, which should cut out most of the noise. We’ll start with just a simple word frequency table. We load our table into Power Query and Remove Other Columns to leave us with just the “reviews.text” column. The next step is to split this column by delimiter, using space as the delimiter:
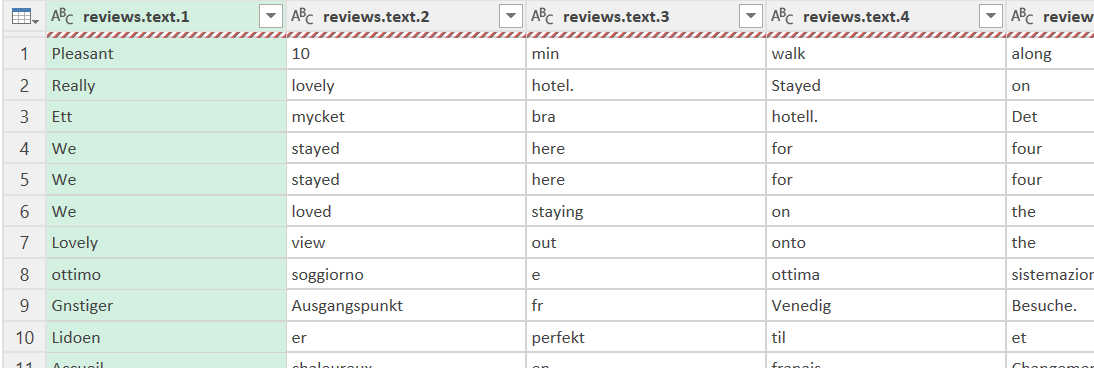
This gives us a wide table:
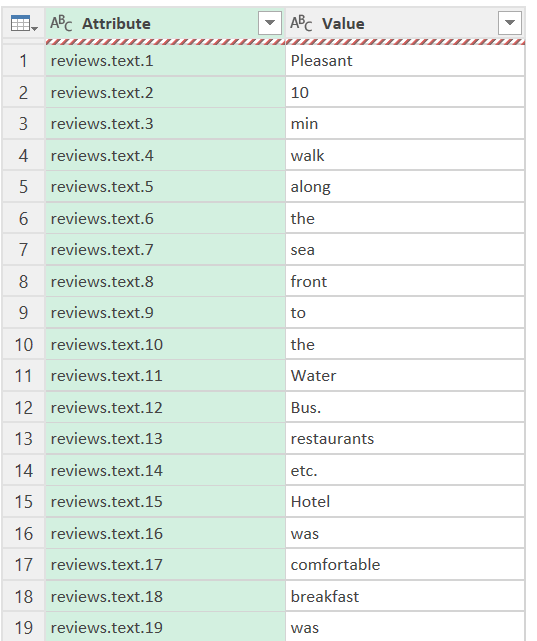
We then need to select the entire table and unpivot the whole thing. This will leave us with one column of words and one of labels:
This is a good time to do Home => Remove Rows => Remove errors on the “Value” column, just in case there are any issues in that column. As PQ is case sensitive, we’ll also want to include a step here to make the words column all lowercase.Then we can Group By the Value column to get a list of words and their frequencies, and sort that by most frequent:
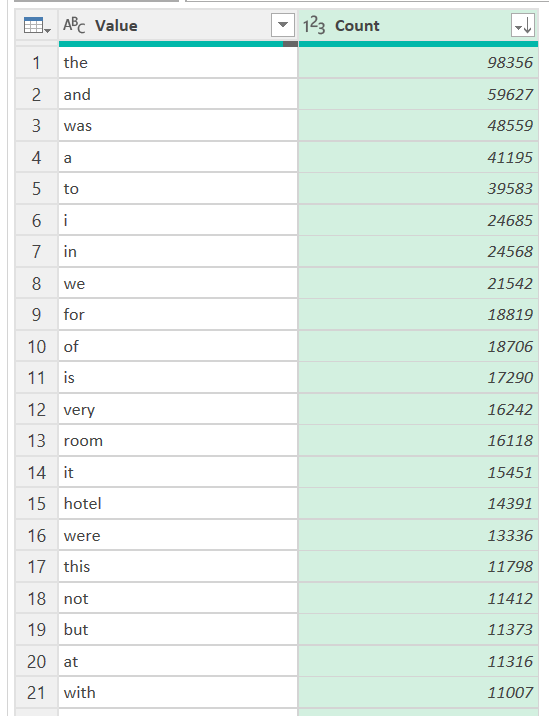
Before exporting to Excel we will also filter to only the words with ≥100 appearances, as otherwise we are going to be dealing with a very large table indeed!
Improving the table
This basic approach works, but it has two major issues:
- Common grammatical words like “the” or “and” are clogging up the top spots of the table, making any analysis less useful
- Because we have only split by spaces, the table includes “words” such as ‘fantastic.’ – with a full stop on the end – separately from ‘fantastic’ and ‘fantastic,’ – which is misleading.
We’ll look next at how to clean up these two issues, starting with (2).
It’s not possible to be 100% perfect on grouping like words together, because of misspellings, unusual punctuation, and other quirks of real, human-typed language. But we can do a decent bit by removing common punctuation from the end of words. The best place to insert this is just after the split columns have been unpivoted and the errors removed. We will use ‘Extract text before delimiter’ to remove any ending full stops:
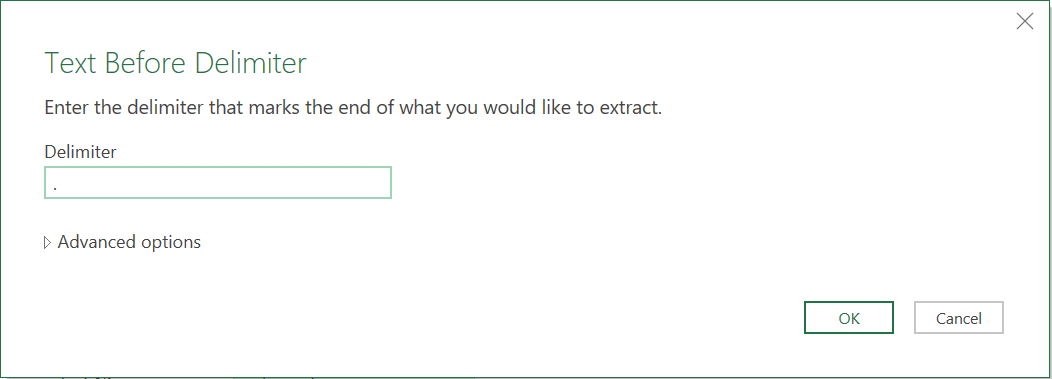
We can then repeat this step for any other end characters we want to remove, such as commas, close-brackets, dashes, semicolons, question and exclamation marks, and so on. We will also filter out any blanks that are left after this – e.g. the sentence “nice hotel – shame about the staff!” would leave a dash on its own, and after this process that will be just a blank.
Next we will consider how to exclude the various common and unhelpful words. To do this, we need to make another table, listing the words we want excluded:
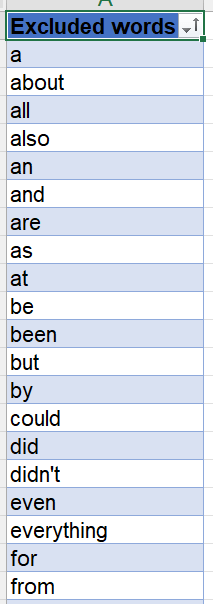
If you’re doing this sort of thing a lot, you will probably build up a standard list of words, but in this case I just took the top 100 words and listed anything that wasn’t a specifically useful word like “hotel” or “breakfast”.
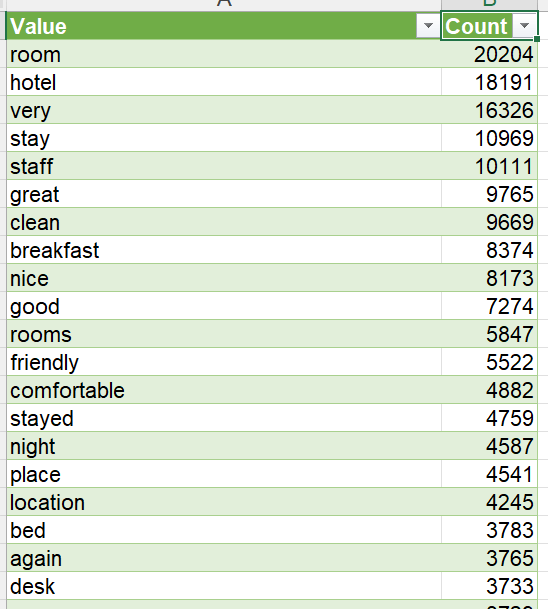
We can now load this table into PQ as a connection only. The next step is to merge this table into our advanced word frequency table. We are going to use a Left Anti merge, which will return the rows that are only in the word frequency table and not in the exclusions list – and that gives us our final list!
You can take a look at the dataset and queries yourself in the attached file.
Excel community
This article is brought to you by the Excel Community where you can find additional extended articles and webinar recordings on a variety of Excel related topics. In addition to live training events, Excel Community members have access to a full suite of online training modules from Excel with Business.

- Excel Tips and Tricks #506: Creating a single master list after merging data
- Excel Tips and Tricks #505 – 3 ways of converting US Dates into UK formats
- Excel Tips and Tricks #504 - Accessing accessibility checkers for good spreadsheet practice
- Excel Tips and Tricks #503 – Printing under pressure, super quick presentation tips
- Excel Tips and Tricks #502
Archive and Knowledge Base
This archive of Excel Community content from the ION platform will allow you to read the content of the articles but the functionality on the pages is limited. The ION search box, tags and navigation buttons on the archived pages will not work. Pages will load more slowly than a live website. You may be able to follow links to other articles but if this does not work, please return to the archive search. You can also search our Knowledge Base for access to all articles, new and archived, organised by topic.
