
It might have taken you hours, or even days, to turn your data into an interactive Excel dashboard, driven by multiple Slicers, but investing just a few more minutes on improving the presentation of your dashboard can give it greater impact and help it communicate its message even more effectively.
Introduction
Over the past few years, one of the most significant developments in the way that Excel can be used has been the move from producing static reports using text and numbers with the occasional chart, to being able to produce interactive dashboards based largely on multiple charts and other graphics. As trivial as it might seem, ensuring that everything on your dashboard is aligned and presented as professionally as possible can make a big difference to the overall impact.
Sizing and Alignment
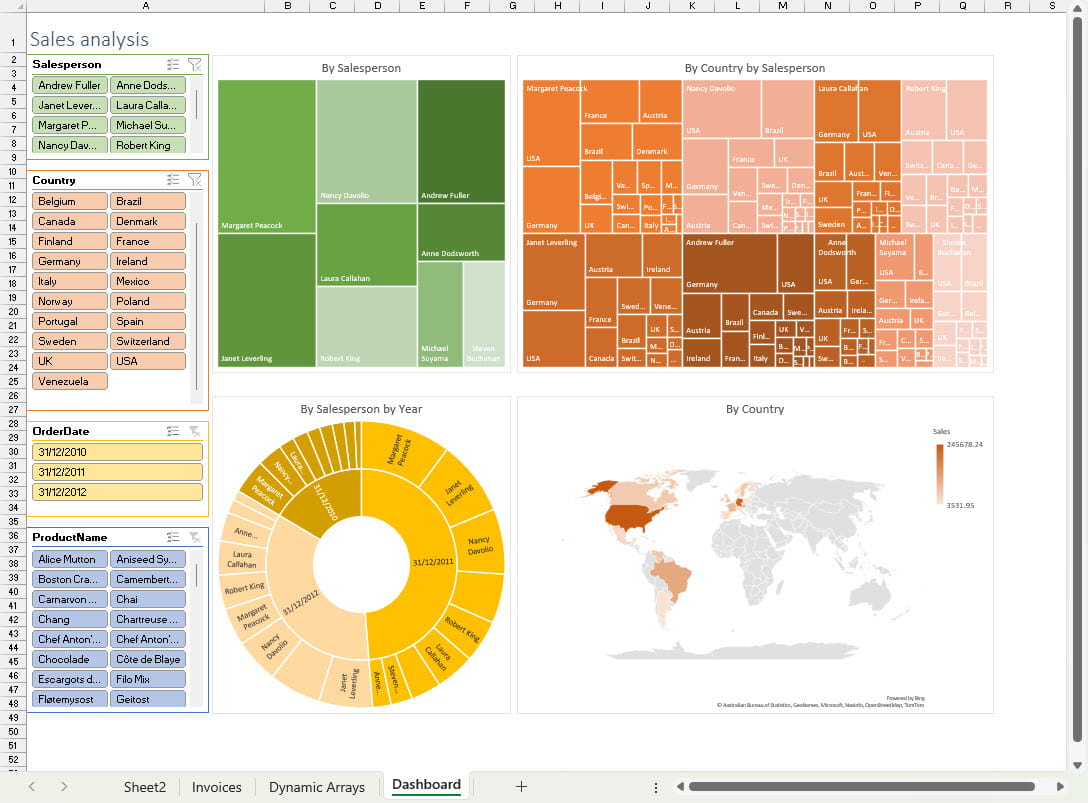
Here is an example dashboard that uses the latest capabilities of Dynamic Arrays to link Slicers to multiple charts based on a single Excel Table, rather than multiple PivotTables, in order to support the use of the most recent chart types:
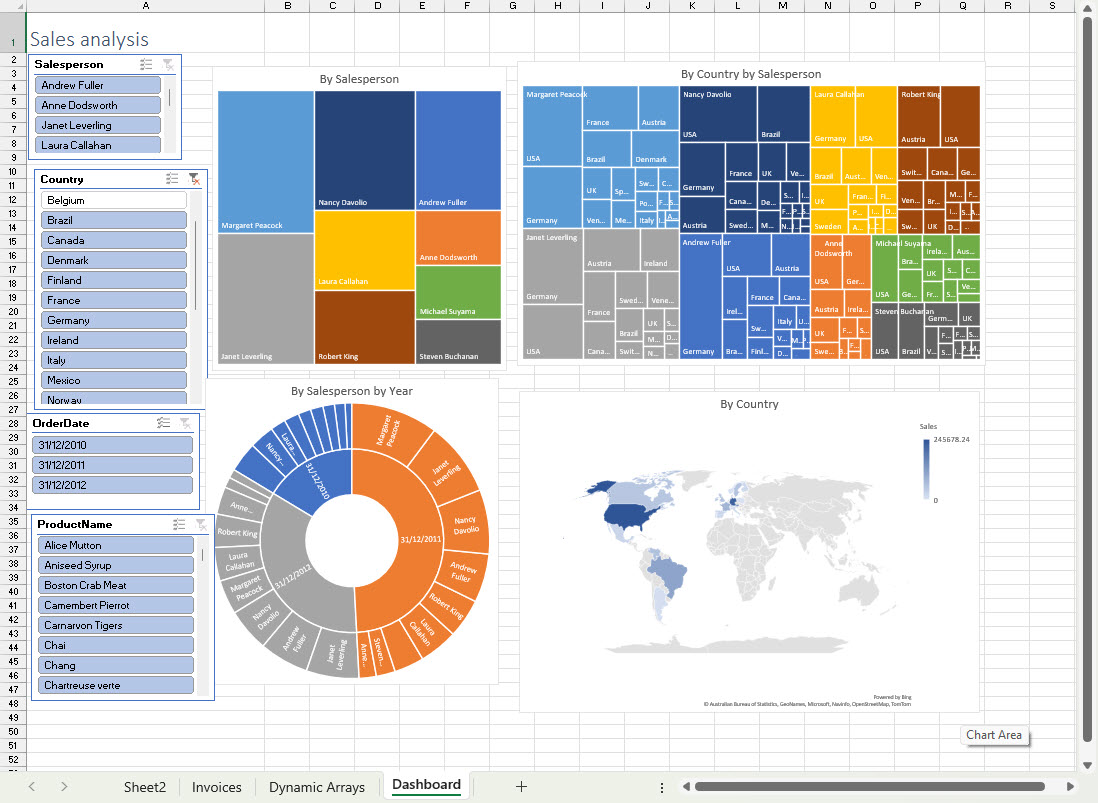
Although the hope would be that users will focus on the implications of our sales analysis for future financial decisions, there is a risk that they will be distracted by the inconsistent sizing of our graphics and the untidy alignment.
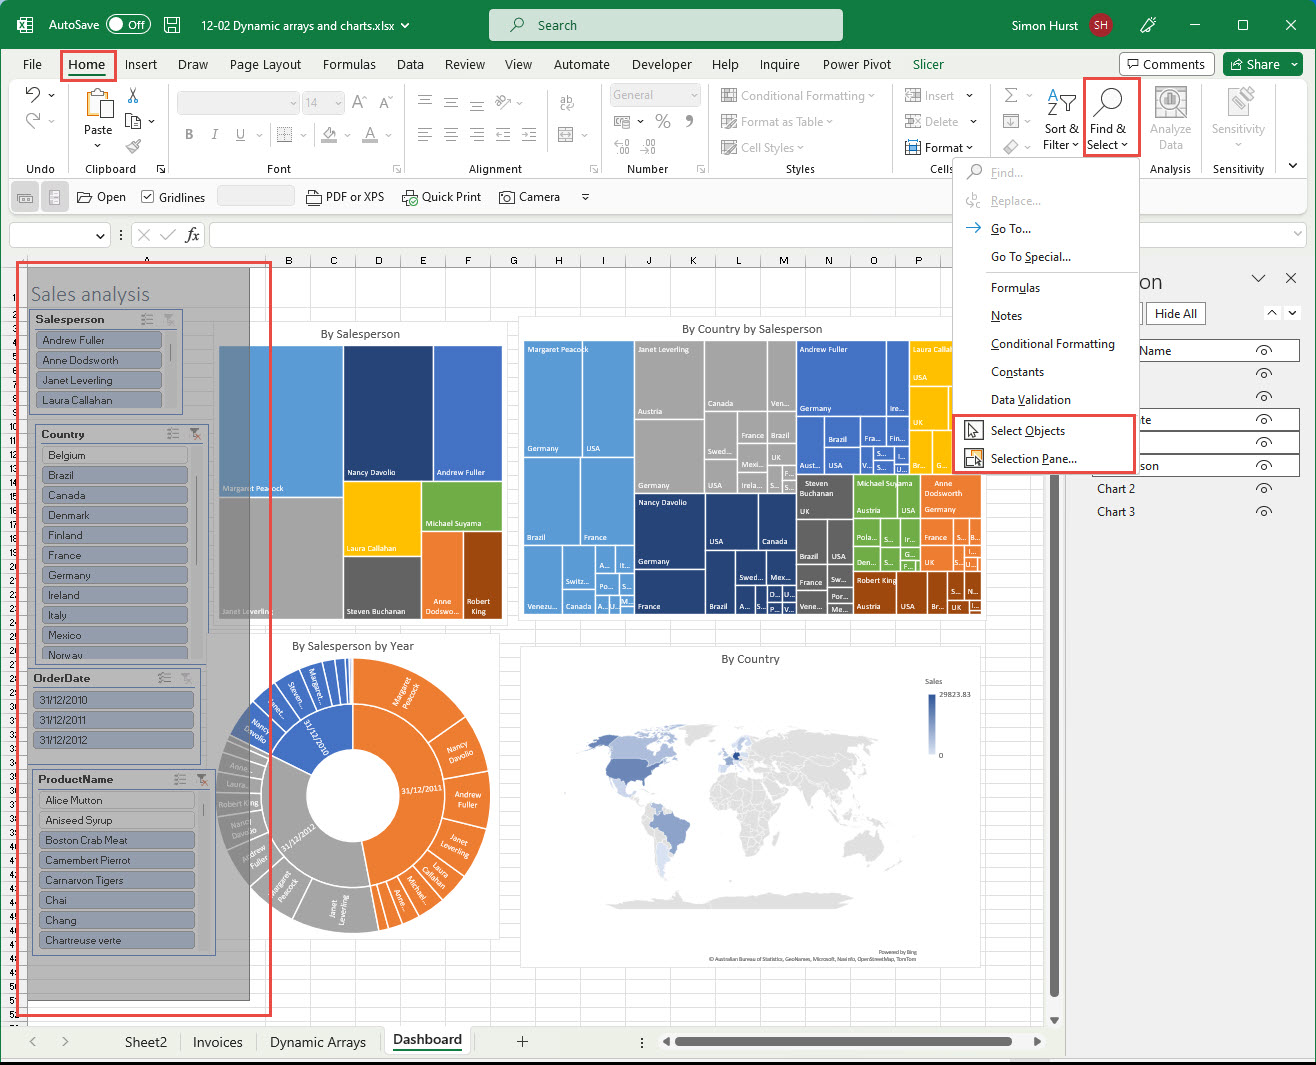
The first task is to be able to select multiple graphic objects. We can do this by holding down the Shift or Control key as we click individually on multiple objects. Alternatively, we can go to the Home Ribbon tab, Editing Group, Find & Select dropdown and click on the Selection Pane… command to display the Selection pane at the right of the Excel window. In the Selection Pane can click on objects individually to select them, or use the Control key to select multiple objects. Also, in the Find & Select dropdown, we can switch to Select Objects. With Select Objects turned on, we can use the mouse to ‘draw’ a box that completely encloses any objects that we want to select:
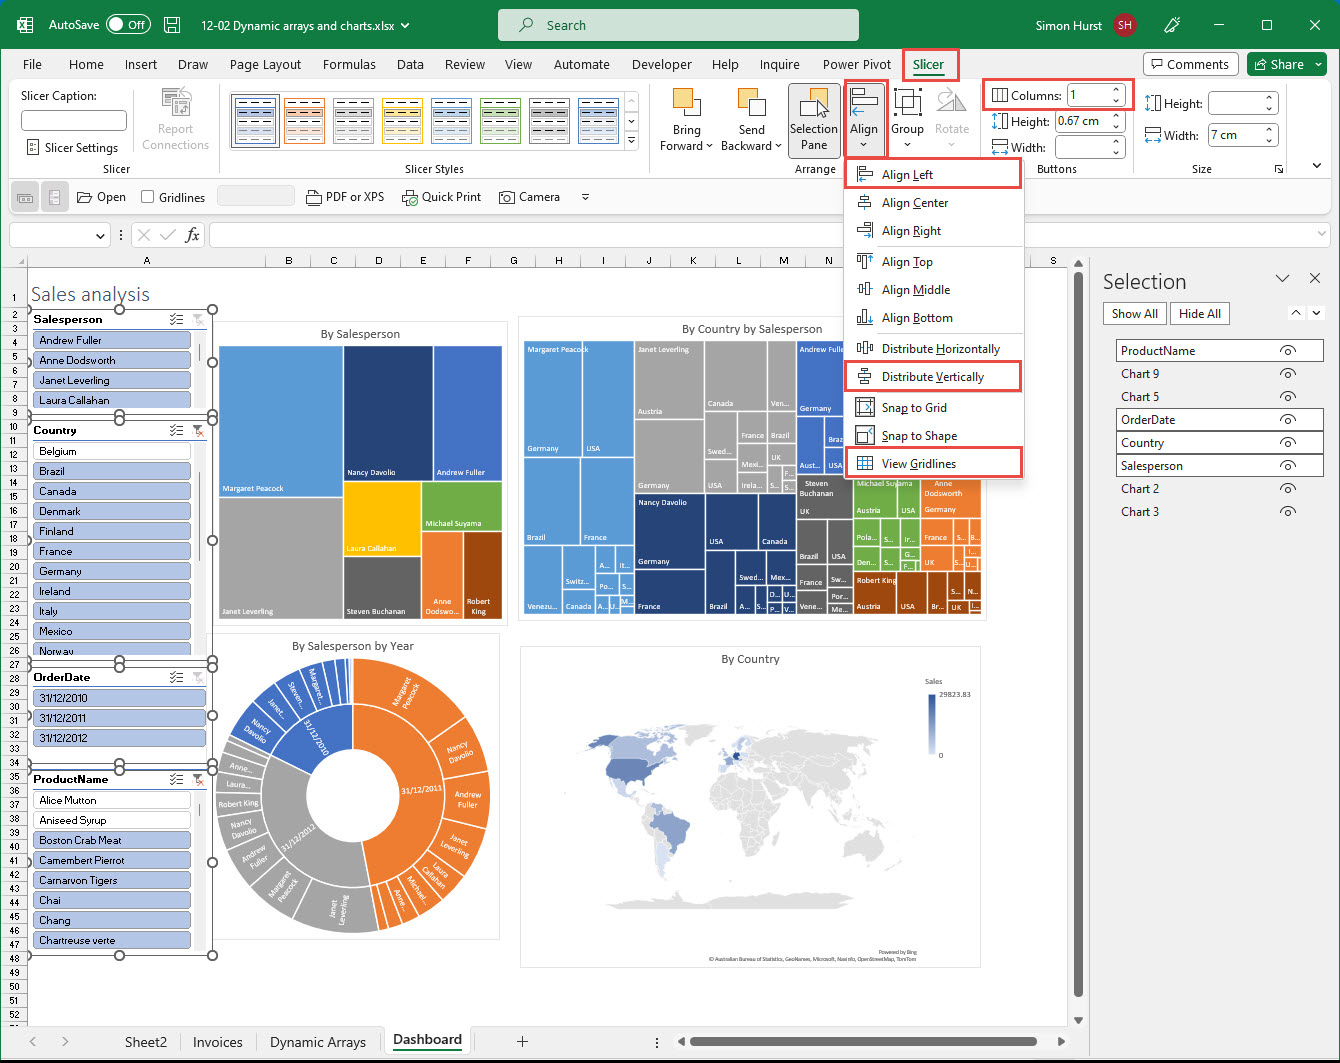
With all four of the Slicers selected, we can apply many of the commands in the Slicer Ribbon tab to all of our Slicers in one go. Here, we have used the Arrange group, Align dropdown to choose Align Left. We have used another alignment option: Distribute Vertically to make the spacing between our Slicers consistent. We have then set a value in the Width text box of the Size group to make our Slicer widths consistent. We can also turn off the display of Gridlines from the same dropdown. We might also want to select some of our Slicers and increase the number of columns that they display in order to be able to see as many of the available items as possible:
Next, we can click our top two charts and top Slicer and use the Align Top command in the Slicer Ribbon tab, or the similar Align dropdown in the Shape Format Ribbon tab. We can do the same with our bottom Slicer and bottom charts. Using the same alignment and sizing techniques we can make the presentation of our charts more consistent as well. Generally, it’s best to make the sizes of our objects consistent before aligning them, in order to ensure that sizing changes don’t upset the alignment we have just set.
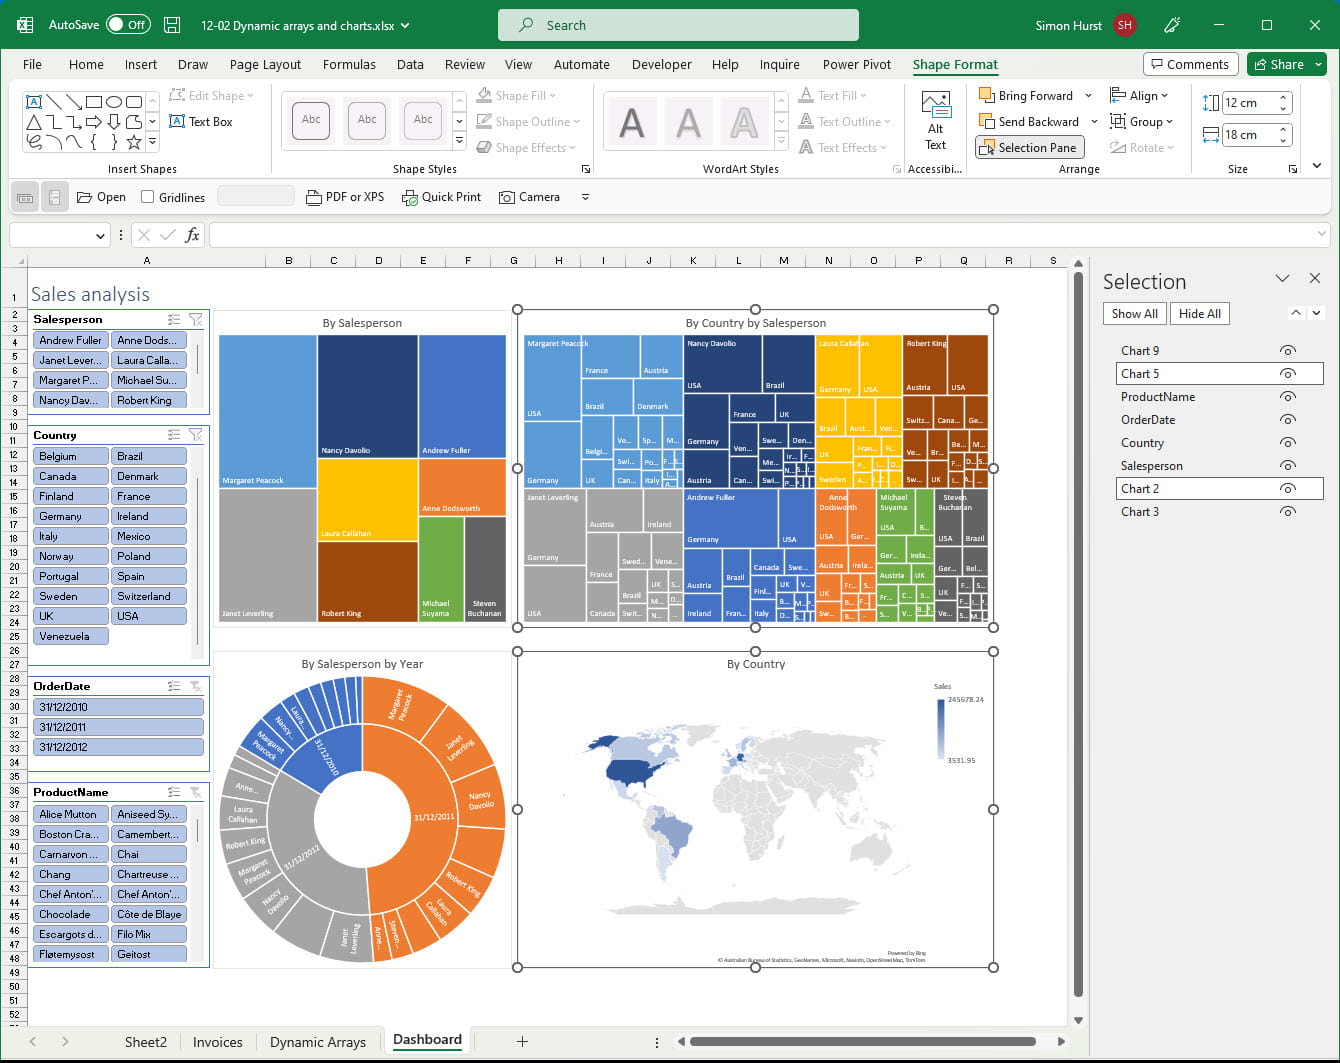
There are other changes that we can make to improve the impact of our dashboard. For example, we could choose colours that emphasise the relationship between our different Slicers and charts:
Related links:
Archive and Knowledge Base
This archive of Excel Community content from the ION platform will allow you to read the content of the articles but the functionality on the pages is limited. The ION search box, tags and navigation buttons on the archived pages will not work. Pages will load more slowly than a live website. You may be able to follow links to other articles but if this does not work, please return to the archive search. You can also search our Knowledge Base for access to all articles, new and archived, organised by topic.
