
In today’s data-driven environment, organisations are not lacking data - they are often constrained by how quickly they can turn that data into meaningful insight. In this article, we explore practical examples of using Copilot in data analytics, where effective use of AI-assisted prompting can help streamline analysis, surface insights more quickly, and improve decision-making.
Tools like Excel remain central to everyday analysis, finance and business teams continue to spend a significant portion of their time on manual activities such as data cleansing, reconciliation, and report preparation. At the same time, emerging AI capabilities are beginning to reshape how analysis is performed. Rather than executing each step manually, users can increasingly guide workflows through structured instructions, shifting the role of the analyst from performing tasks to directing them. The effectiveness of this approach depends not just on the tool itself, but on how clearly business questions can be translated into analytical prompts.
This shift also highlights an ongoing challenge: bridging fragmented workflows across data preparation, analysis, and reporting. Many organisations still operate these steps in isolation, which slows down insight generation and limits the ability to respond quickly to business needs.
In this article, we cover common finance scenarios where effective use of AI-assisted prompting in Copilot can help streamline analysis, surface insights more quickly, and improve the overall quality of decision-making.
Putting it into practice: Everyday Copilot prompts in Excel
1. Data cleaning and reconciliation
Prompt:“Review the dataset and identify duplicates, missing values, inconsistent formats, abnormal discounts, and premium outliers.
Clean the data and summarise what changed.”
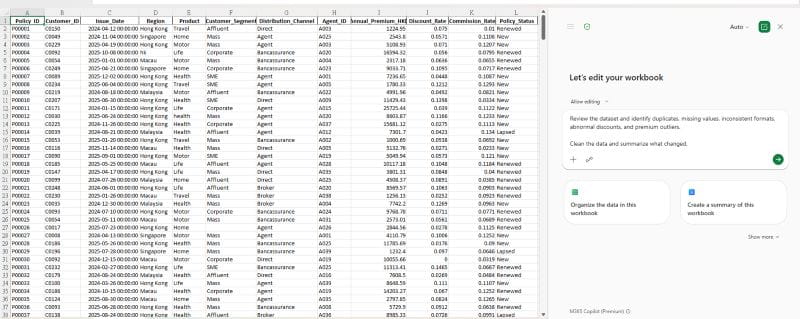
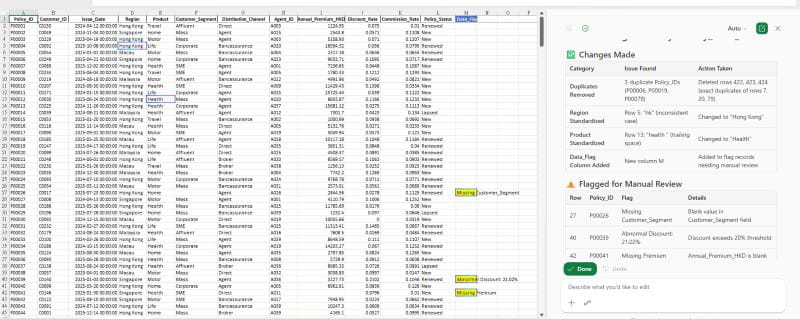
The images above show a Microsoft Excel worksheet containing a table of transactional records with multiple columns, including customer details, dates, categories, and financial values. A Copilot prompt is entered asking Copilot to identify potential data quality issues such as duplicate records, missing values, inconsistent formatting, outliers, and unusual transactions. Copilot reviews the selected dataset and generates a summary of identified issues together with suggested remediation actions. This helps users improve the accuracy and consistency of data before further analysis, reporting, or decision-making activities.
2. Variance analysis
Prompt:
“Compare Actual_HKD vs Budget_HKD by Month and CostCategory.
Add absolute and percentage variance columns, then identify the top 5 variance drivers."
Tips:
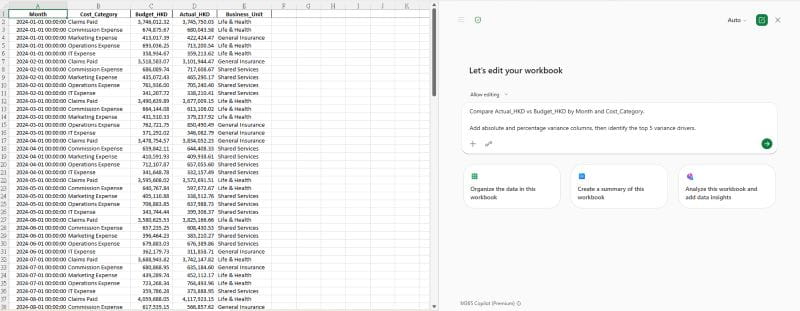
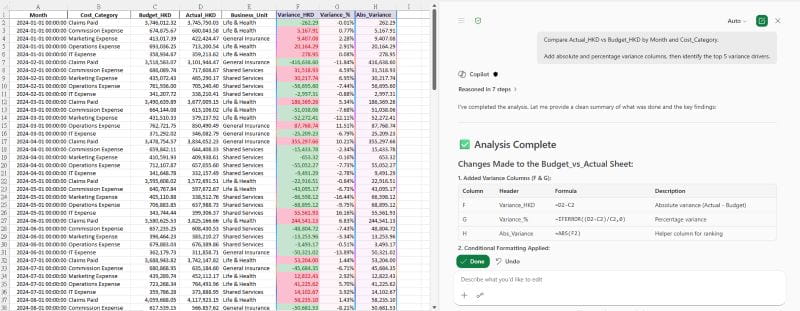
The images above show a financial dataset containing actual and budget values across multiple reporting periods and expense categories. The user asks Copilot to calculate variances between actual and budget amounts and identify the most significant differences. Copilot generates variance calculations, highlights areas with the largest deviations, and provides a written summary explaining key financial drivers. The output enables users to quickly focus on material variances and areas that may require management attention or investigation.
3. Trend and insight generation
Prompt:
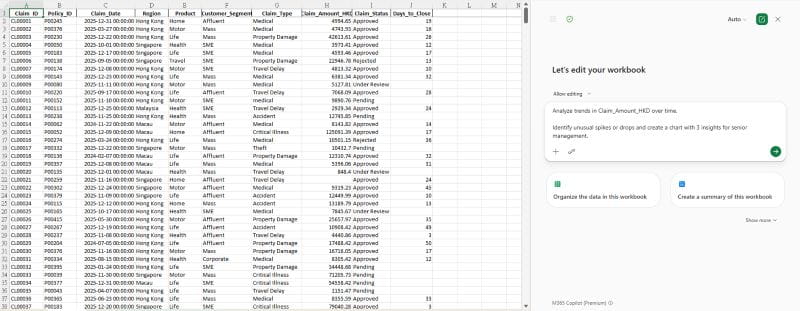
“Analyse trends in Claim_Amount_HKD over time. Identify unusual spikes or drops and create a chart with 3 insights for senior management.”
In a separate tab, Copilot created key insights for senior management, including a summary table and an executive chart as supporting.
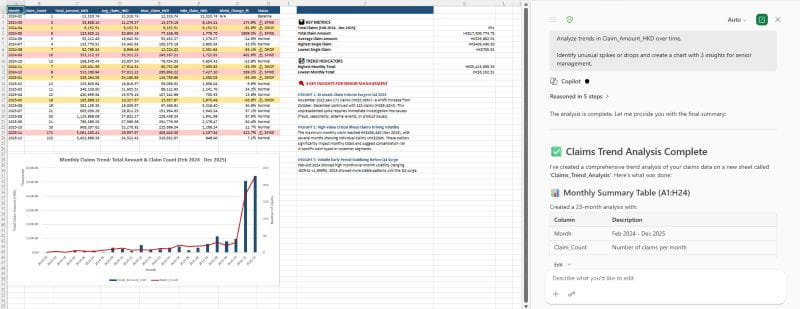
The images above show a dataset containing claim amounts recorded over a series of periods. The user prompts Copilot to analyse trends, identify unusual movements, and provide observations that can be shared with management. Copilot examines the historical data, identifies patterns and anomalies, and generates visualisations together with narrative insights explaining changes over time. The output reduces the need for manual trend analysis while making business performance easier to interpret and communicate.
4. Formula generation
Prompt:
“Suggest formulas to calculate:
- target achievement percentage
- year-to-date premium
- performance vs target
Explain each formula.”
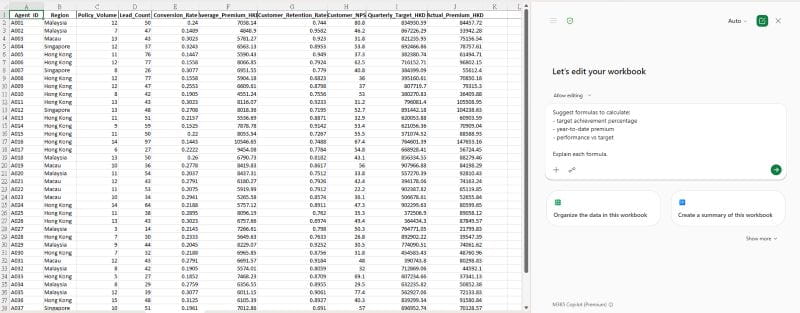
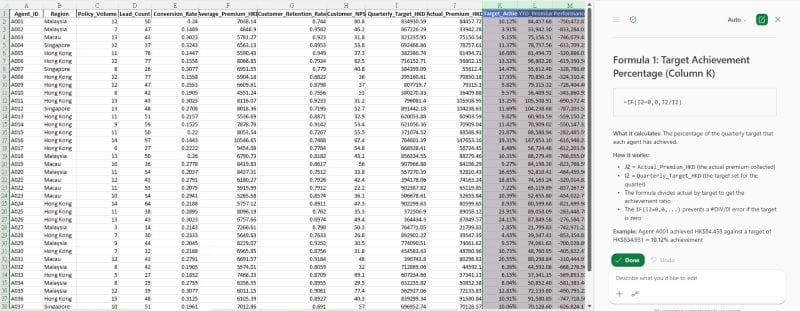
The images above show an Excel worksheet containing sales, premium, or performance data. The user requests assistance from Copilot to create formulas for calculations including target achievement percentages, year-to-date totals, and performance against plan. Copilot recommends the relevant Excel formulas and explains the purpose of each calculation. This helps users create accurate calculations more efficiently while reducing the likelihood of manual formula errors.
5. Pivot table and dashboard
Prompt:
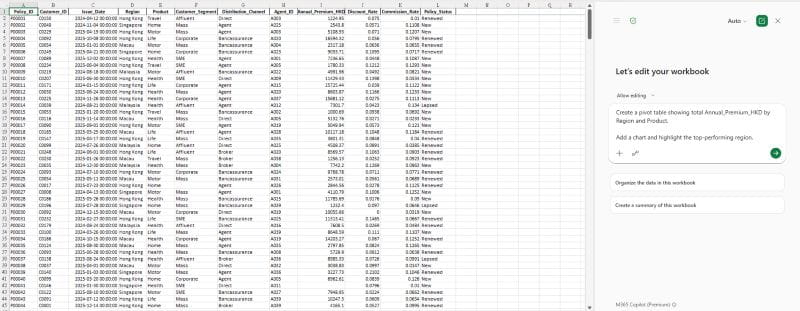
“Create a pivot table showing total Annual_Premium_HKD by Region and Product. Add a chart and highlight the top-performing region.”
In a separate tab:
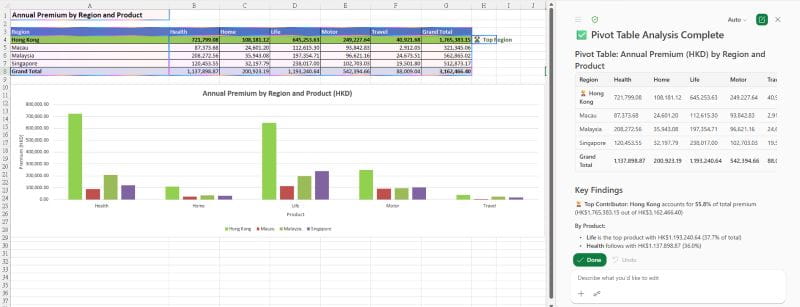
The images above show detailed transactional data stored in an Excel worksheet. The user asks Copilot to summarise the data by dimensions such as region, product category, or time period, and to create supporting visualisations. Copilot generates a pivot table, creates charts, and provides observations regarding key performance indicators and top-performing segments. The resulting dashboard transforms large volumes of detailed data into a concise and actionable management view.
Scenario 1: Monitoring cash levels
Business problem
Treasury teams spend significant time consolidating monthly cash balances across multiple countries and currencies. Reporting often requires manual currency conversion, regional aggregation, chart creation, and drafting management commentary, making the process time-consuming and prone to errors.
Copilot hackInstead of manually preparing the monthly treasury report, use Copilot to:
- Automate currency conversion at scale
- Aggregate balances by region and generate summary tables
- One-click management-ready chart creation
- Draft executive commentary highlighting variances and drivers
- Surface key insights such as surplus cash, FX constraints, and remittance issues
- Reduced manual reporting effort
- Faster treasury close and management reporting
- Improved accuracy through automated calculations
- More time for strategic cash management and analysis
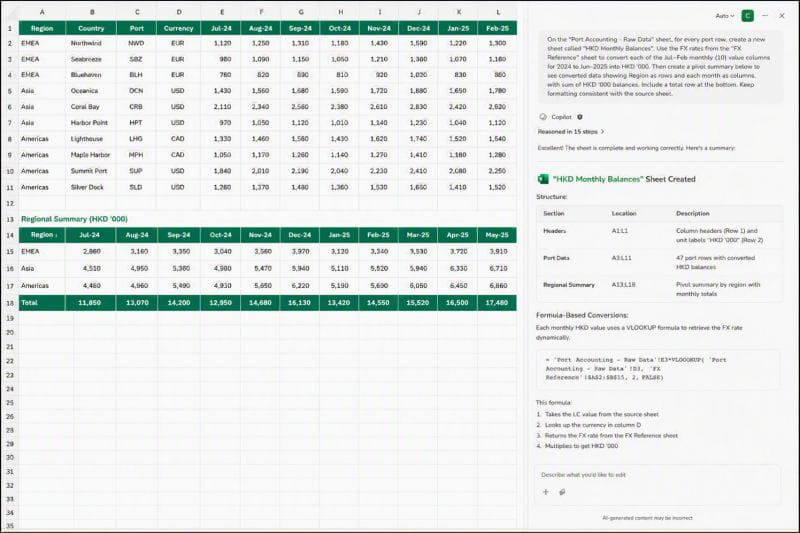
This image shows monthly cash balance information recorded across multiple geographic regions. The user asks Copilot to consolidate the data, compare actual balances against target levels, and identify significant movements. Copilot analyses the balances, generates trend visualisations, and provides written commentary explaining notable increases, decreases, or exceptions. This helps finance teams monitor liquidity positions and identify areas that may require additional review.
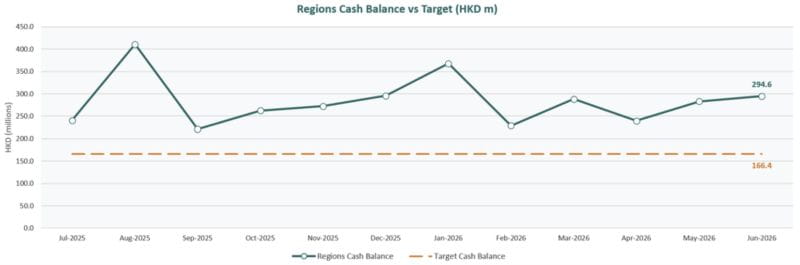
Once the consolidated dataset is prepared, Copilot can help visualise trends and highlight key variances, making it easier for stakeholders to understand cash positions at a glance.
This image above shows a line chart displaying regional cash balances over time alongside a target or benchmark value. The chart allows users to compare actual performance against expected levels and identify trends across different reporting periods. Copilot assists by generating the visualisation and highlighting notable fluctuations in the data. The chart supports management reporting by presenting complex financial information in a format that can be quickly understood.
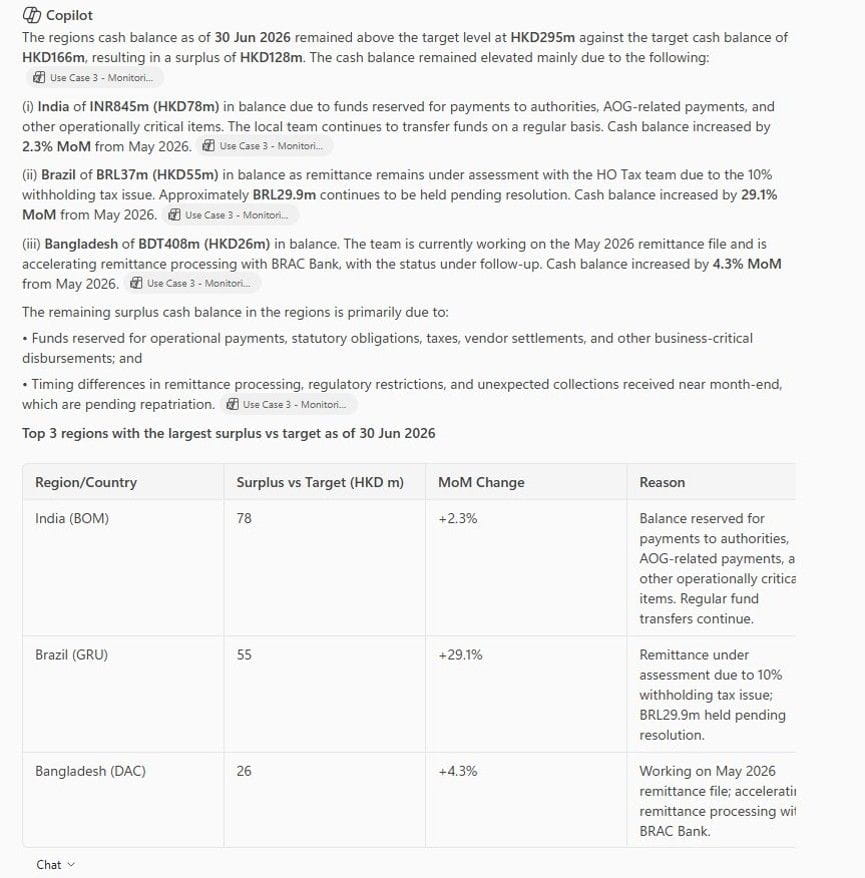
The image above shows Copilot generating a written executive summary based on financial data and trend analysis. The output explains significant movements in cash balances, highlights potential business drivers, and identifies areas that may require management attention. Rather than reviewing detailed spreadsheets manually, users receive a concise narrative that can be incorporated into management reports and presentations.
Scenario 2: Collation of market analyst’s sentiments on stock (public data)
Business Problem
Convert analyst sentiment screenshots into a structured Excel-based market consensus view for faster review of forecast metrics, target prices, and ratings.
Copilot Hack
- Extract analyst data directly from screenshots
- Consolidate firm, analyst, forecast, target price, and rating into Excel
- Standardise inconsistent market data into one clean table
- Highlight BUY / HOLD / SELL sentiment for quick comparison
Impact / Value
- Speeds up market consensus review
- Improves consistency of analyst sentiment reporting
- Makes key investment signals easier to compare
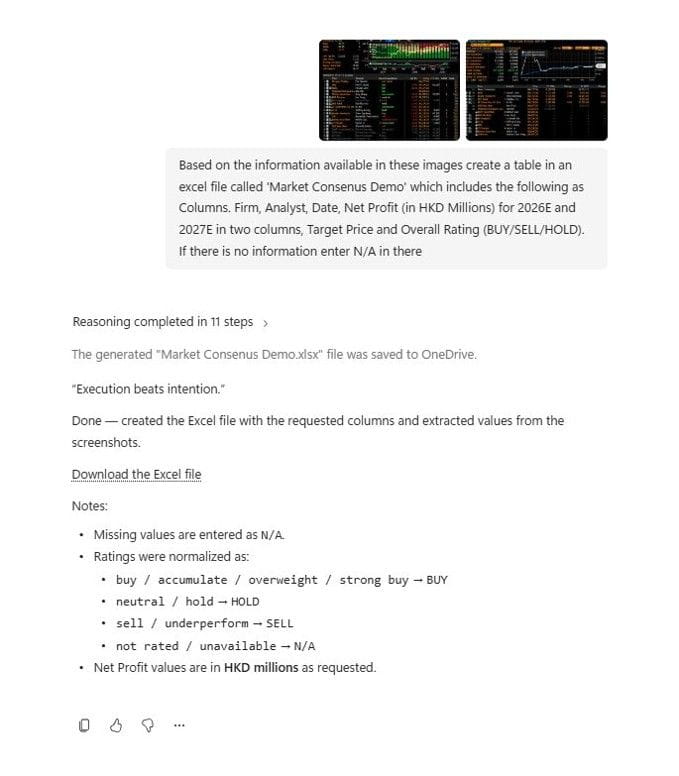
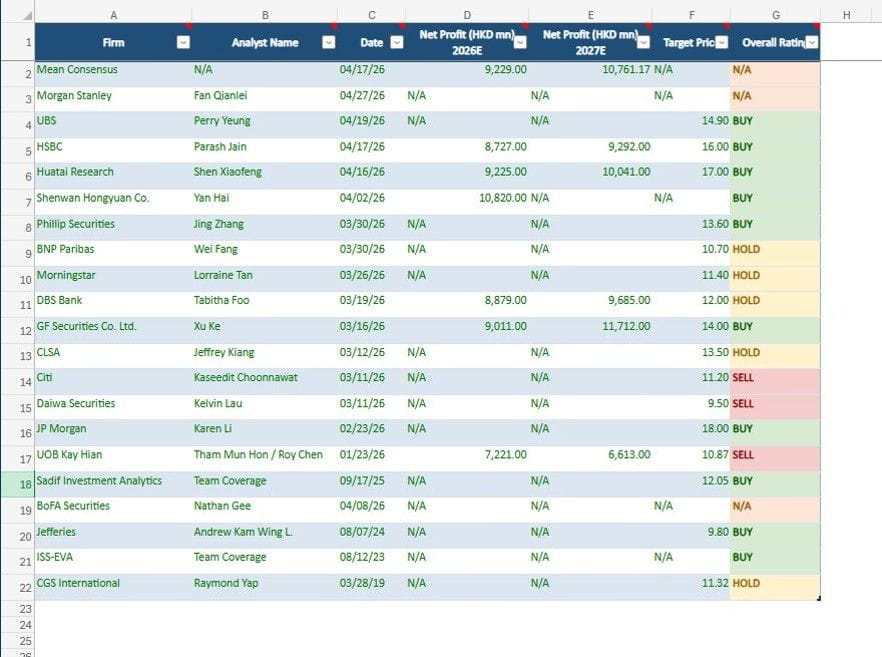
The image above shows market analyst information presented in image or screenshot format. The user asks Copilot to extract relevant details and organise them into a structured Excel table. Copilot converts unstructured information into columns containing details such as analyst name, institution, target price, recommendation, forecast information, and publication date. This significantly reduces manual data entry effort while making analyst sentiment easier to analyse and compare.
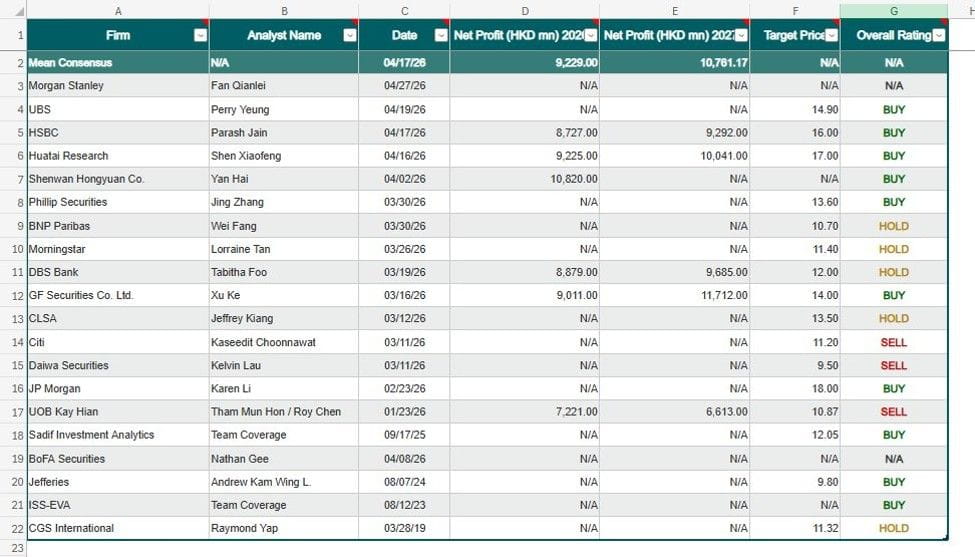
The image above shows a consolidated Excel table containing analyst research information sourced from multiple reports. The table enables comparisons of recommendations, forecasts, and target prices across different analysts and financial institutions. Copilot assists by standardising the information into a consistent format and making key differences easier to identify. This improves the efficiency and accuracy of market intelligence analysis.
Scenario 3: Data cleaning & reconciliation
Business Problem
Finance teams spend significant time identifying inconsistencies across datasets (eg, mismatched records, missing values, duplicate entries).
Copilot Hack
Instead of manually filtering and comparing, use Copilot to:
- Automatically identify anomalies
- Highlight inconsistencies
- Suggest data cleaning steps
Impact / Value
- Improves data accuracy
- Frees up analyst time for root cause analysis
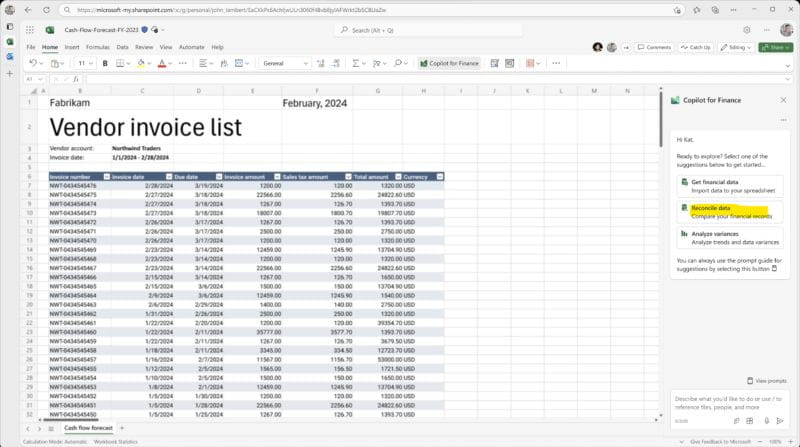
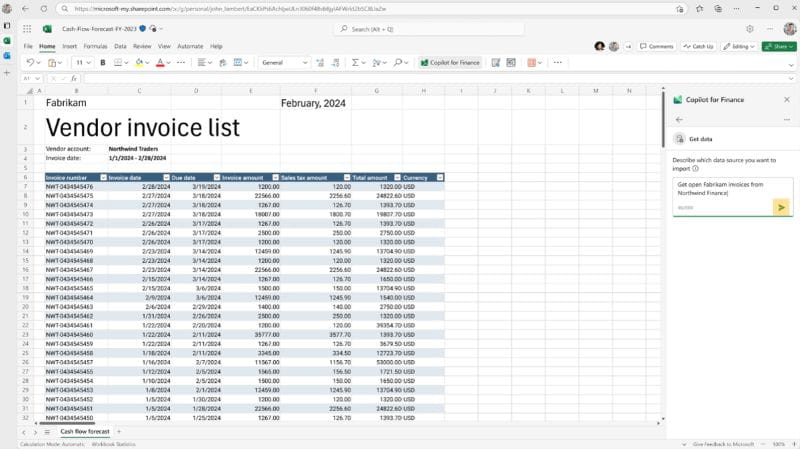
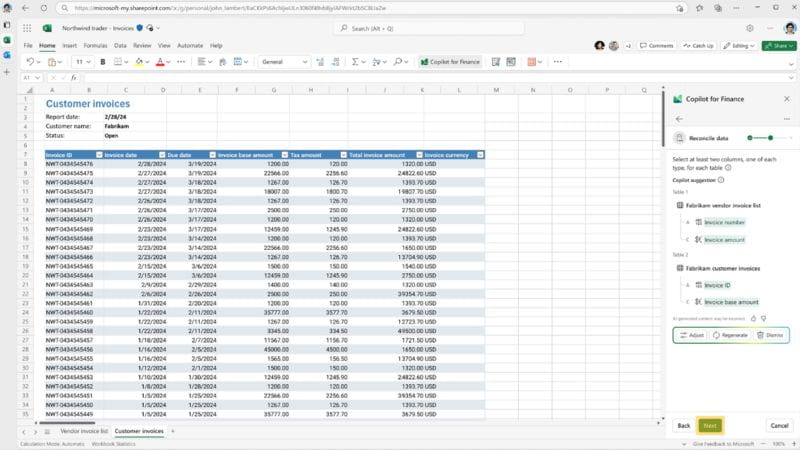
The images above show invoice and transaction data used as input for a reconciliation process. The user initiates a reconciliation workflow using Finance Agent and selects the relevant records to compare. Finance Agent analyses the source data, identifies matching and unmatched transactions, and prepares a reconciliation summary. This reduces manual reconciliation effort while improving transparency and accuracy in the financial close and review process.
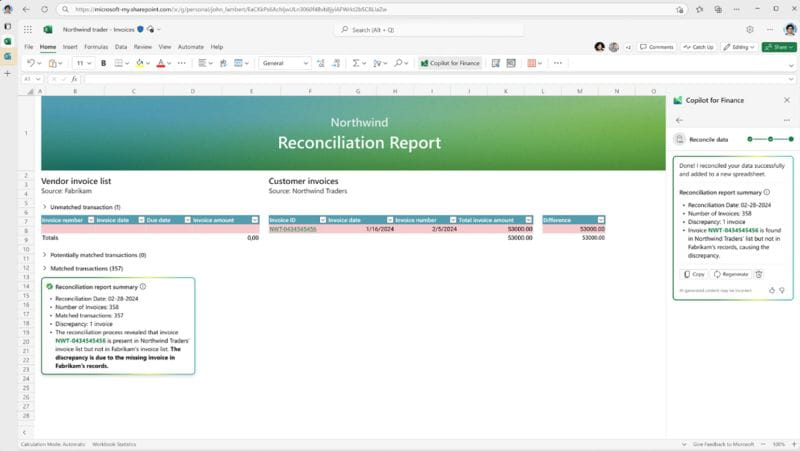
The image above shows the results of an automated reconciliation process. Matched transactions are identified and categorised, while exceptions and unmatched records are highlighted for further review. Finance Agent summarises the reconciliation status and provides supporting information to help users investigate discrepancies. The output enables finance teams to resolve exceptions more efficiently and maintain greater confidence in financial records.
The image above shows an Excel-based profitability dashboard containing financial metrics, performance indicators, and supporting calculations. The user asks Copilot to analyse the available information and generate observations regarding business performance. Copilot reviews the dashboard data, identifies trends and significant contributors, and produces written insights that support decision-making. This allows users to move beyond static reporting and obtain meaningful business intelligence from existing financial data.
Key prompting tips
As these scenarios illustrate, the effectiveness of Copilot is not just about what it can do - but how users guide it. Three practical tips can significantly improve the quality of outputs:
As organisations continue to invest in AI, the competitive advantage will not come from access to tools, but from the ability to apply them effectively in daily workflows.
Copilot enables finance and business users to move beyond manual data processing and focus on higher-value activities such as interpretation, decision-making, and strategic planning.
The key question is no longer “Can we analyse the data?” but “How fast can we turn it into actionable insight?”
