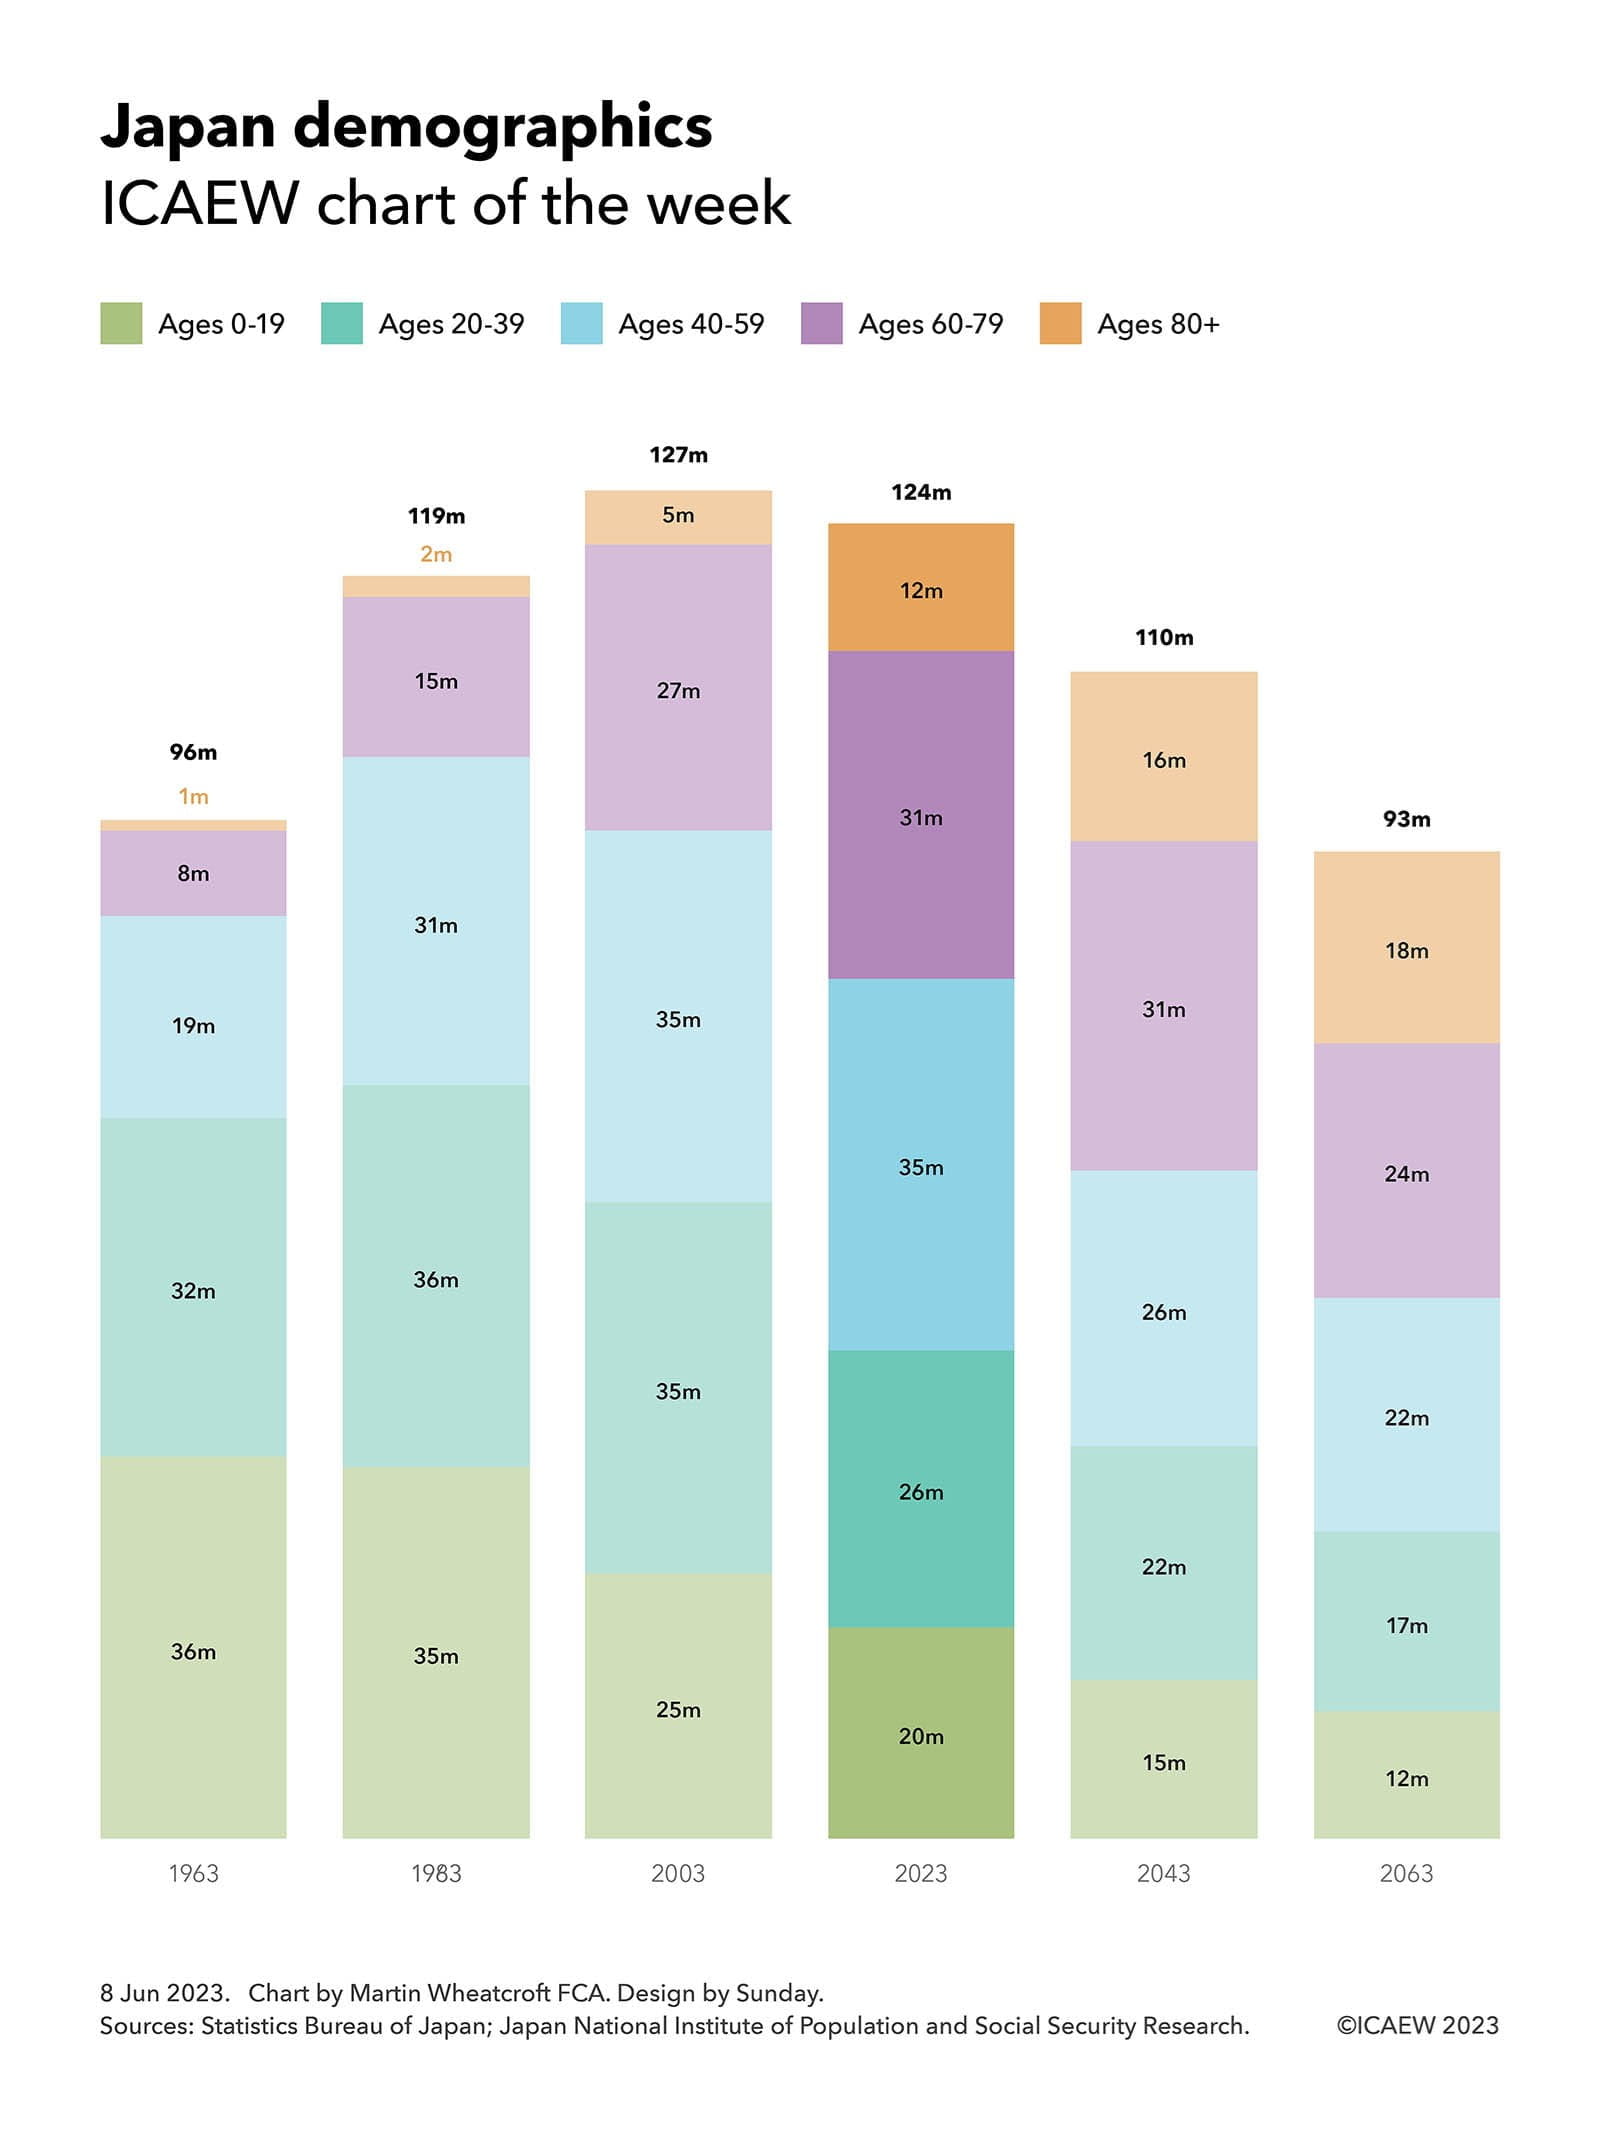
Our chart this week is on the demographics of Japan, looking at how its population grew rapidly from 96m in 1963 to 119m in 1983 and then 127m in 2003, before falling to 124m this year, to a projected 110m in 20 years’ time, and to 93m in 40 years’ time.
Our analysis starts with the 96m people who lived in Japan in 1963 and shows how increased longevity saw the population increase to 119m in 1983 (an increase of 24m from 36m births and 2m migrants less 14m deaths), before increasing to 127m in 2003 (a further 8m increase from 25m births less 17m deaths).
The population has been relatively stable since then, peaking at 128m in 2010 (not shown in the chart), before dropping to 124m this year as the number of births (20m over the last 20 years) fell below the number of deaths (25m). This was offset by a small amount of net inward migration, with the non-Japanese component of the population amounting to 3m in 2023.
Fewer younger people means that the number of births is expected to be even smaller over the next 20 years to 2043 at around 15m, at the same time as deaths are expected to increase in line with an older population. According to the latest medium-variant projections of Japan’s National Institute of Population and Social Security Research, the population is projected to drop by 14m to 110m in 2043 (15m births + 3m migrants - 32m deaths) before falling by a further 17m to 93m in 2063 (12m births + 3m migrants - 32m deaths).
The primary purpose of the chart is to illustrate how the age profile has shifted and continues to change as Japan gets older. Grouped into five age segments: 0-19, 20-39, 40-59, 60-79 and 80+, the population was, is, and is projected to be as follows:
1963 – 36m, 32m, 19m, 8m and 1m – 96m total
1983 – 35m, 36m, 31m, 15m and 2m – 119m total
2003 – 25m, 35m, 35m, 27m and 5m – 127m total
2023 – 20m, 26m, 35m, 31m and 12m – 124m total
2043 – 15m, 22m, 26m, 31m and 16m – 110m total
2063 – 12m, 17m, 22m, 24m and 18m – 93m total
The contrast in the age profile in the 20th century compared with 21st century Japan is dramatic, with the proportion of population aged 60 or over increasing from 9% in 1963 to 35% today and to a projected 45% in 2063, at the same time as the share aged under 40 has fallen from 72% in 1963 to 37% in 2023 and to a projected 31% in 2063.
Also not shown in the chart is Japan’s median age, which was 26 in 1963, 33 in 1983, 42 in 2003 and 49 this year, before being projected to reach 53 in 2043 and 56 in 2063 – more than double that of a century earlier.
These demographic shifts have and will continue to present a major fiscal challenge for the Japanese government. The continued growth in size of older generations (who typically consume the most in public services and welfare), accompanied by a shrinking working-age population (the group that typically pays most of the taxes that fund public services and welfare), will not be an easy dynamic to manage. At the same time, Japan already has one of the largest national debts of any country at in excess of 250% of its GDP.
One action Japan could take is to increase the pace of net inward migration even more than it already has, given it is currently at a much lower level than in many other developed countries such as the UK. This would have the benefit of bringing in more tax-paying individuals of working age and potentially assist in driving up the birth rate, slowing the rate of fall in the size of the population. However, there would be significant political challenges to overcome for such a route to be successful.
The good news for Japan is that it can still borrow at very low interest rates, with the effective interest rate payable on 10-year government bonds currently at 0.4%, much lower than in many comparable countries with much lower levels of external debt. This is both a threat, in that interest rates could go up significantly in the future, but also an opportunity in that the Japanese government is able to invest in adapting itself for a very different future.
Latest charts
Recommended content
ICAEW Community

Public Sector Community
The go-to place for guidance on issues affecting finance professionals working in and with the public sector. With a range of dynamic services, ICAEW provides valuable tools, resources and support tailored to the public sector.
Resource

More economic insight
ICAEW works with Oxford Economics to provide useful insight and timely intelligence for finance professionals and their clients.
Read moreResource

Energy crisis hub
Analysis of how supply difficulties, rising electricity prices and sanctions against Russia are contributing to turmoil in energy markets. Find out what business can do to lessen the impact.
Find out more