The Office for Budget Responsibility (OBR) published its latest fiscal risks and sustainability report on 7 July 2026, setting out how public sector net debt in relation to the size of the economy could increase from 94% of GDP on 31 March 2026 to 300% of GDP on 31 March 2076.
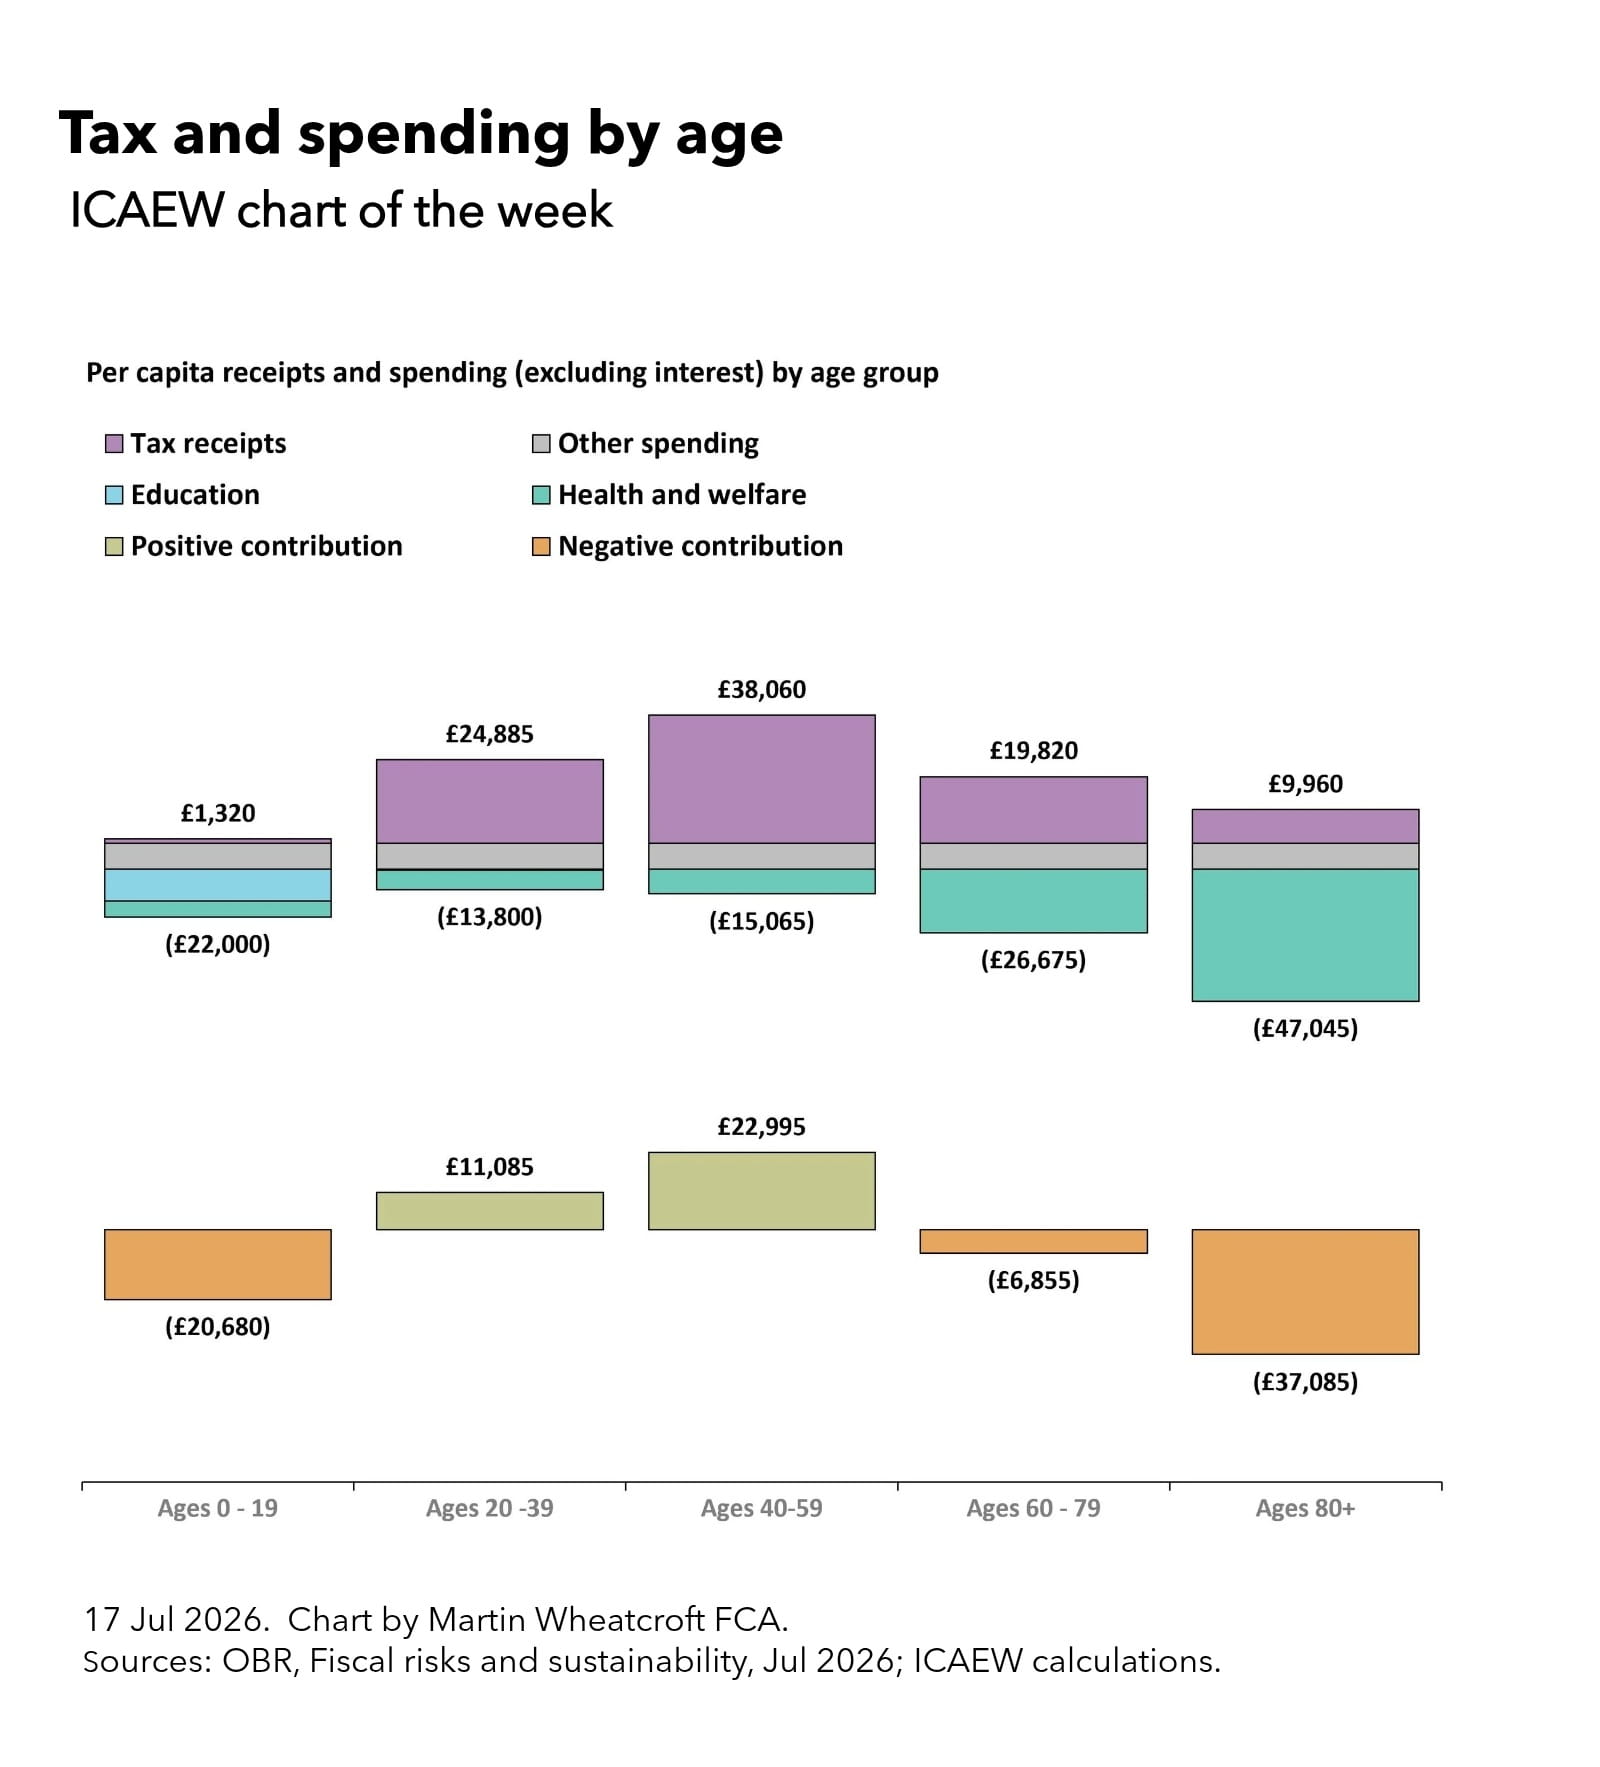
A key driver of this increase relates to a significant change in the age profile of the population, and our chart attempts to illustrate the issue by looking at per capita receipts and spending (excluding interest) across five age groups: 0-19, 20-39, 40-59, 60-79, and 80+ as calculated by the OBR.
Our principal chart this week starts by showing estimated average net fiscal contributions by age group, with net positive contributions by the 20-39 and 40-59 age groups and net negative contributions for the 0-19, 60-79, and 80+ age groups. These estimates are based on average tax receipts per person less spending per person as follows:
- Ages 0-19: £1,320 - £22,000 = -£20,680 per person.
- Ages 20-39: £24,885 - £13,800 = +£11,085 per person.
- Ages 40-59: £38,060 - £15,065 = +£22,995 per person.
- Ages 60-79: £19,820 - £26,675 = -£6,855 per person.
- Ages 80+: £9,960 - £47,045 = -£37,085 per person.
Our chart splits spending between education, health and welfare, and other spending, with education estimated to cost approximately £9,935, £265, £60, £20 and £30 per person on average for each age group respectively. Health and welfare costs (including adult social care) are estimated to amount to £4,750, £5,820, £7,290, £18,490 and £39,300 for each of the five groups, while the OBR has allocated average per capita other spending of £7,715 evenly across all ages.
The numbers are based on primary receipts and spending, which excludes interest.
The picture presented in the chart may seem obvious – that those of working age contribute more tax receipts to the exchequer than they take out in public services and welfare in order to fund the education of the young and the pensions, health and social care of the old. This is especially the case in a country like the UK with unfunded state pensions, unfunded health and social care provision in retirement, and (mostly) unfunded public sector pensions.
Population change over the next 50 years
Our supplemental chart this week sets out what is happening to the UK’s demographics, based on the 2024-based principal population projection published by the Office for National Statistics (ONS) early this year.
The UK population is now expected to stabilise at around 71m over the next 50 years, rising from 69.5m in 2025 to 71.3m in 2075 – a rise of 2.6% over that period or 0.05% a year on average. This contrasts with the 24% increase in the population from 56.2m to 69.5m over the previous 50 years, equivalent to growth of 0.4% a year on average.
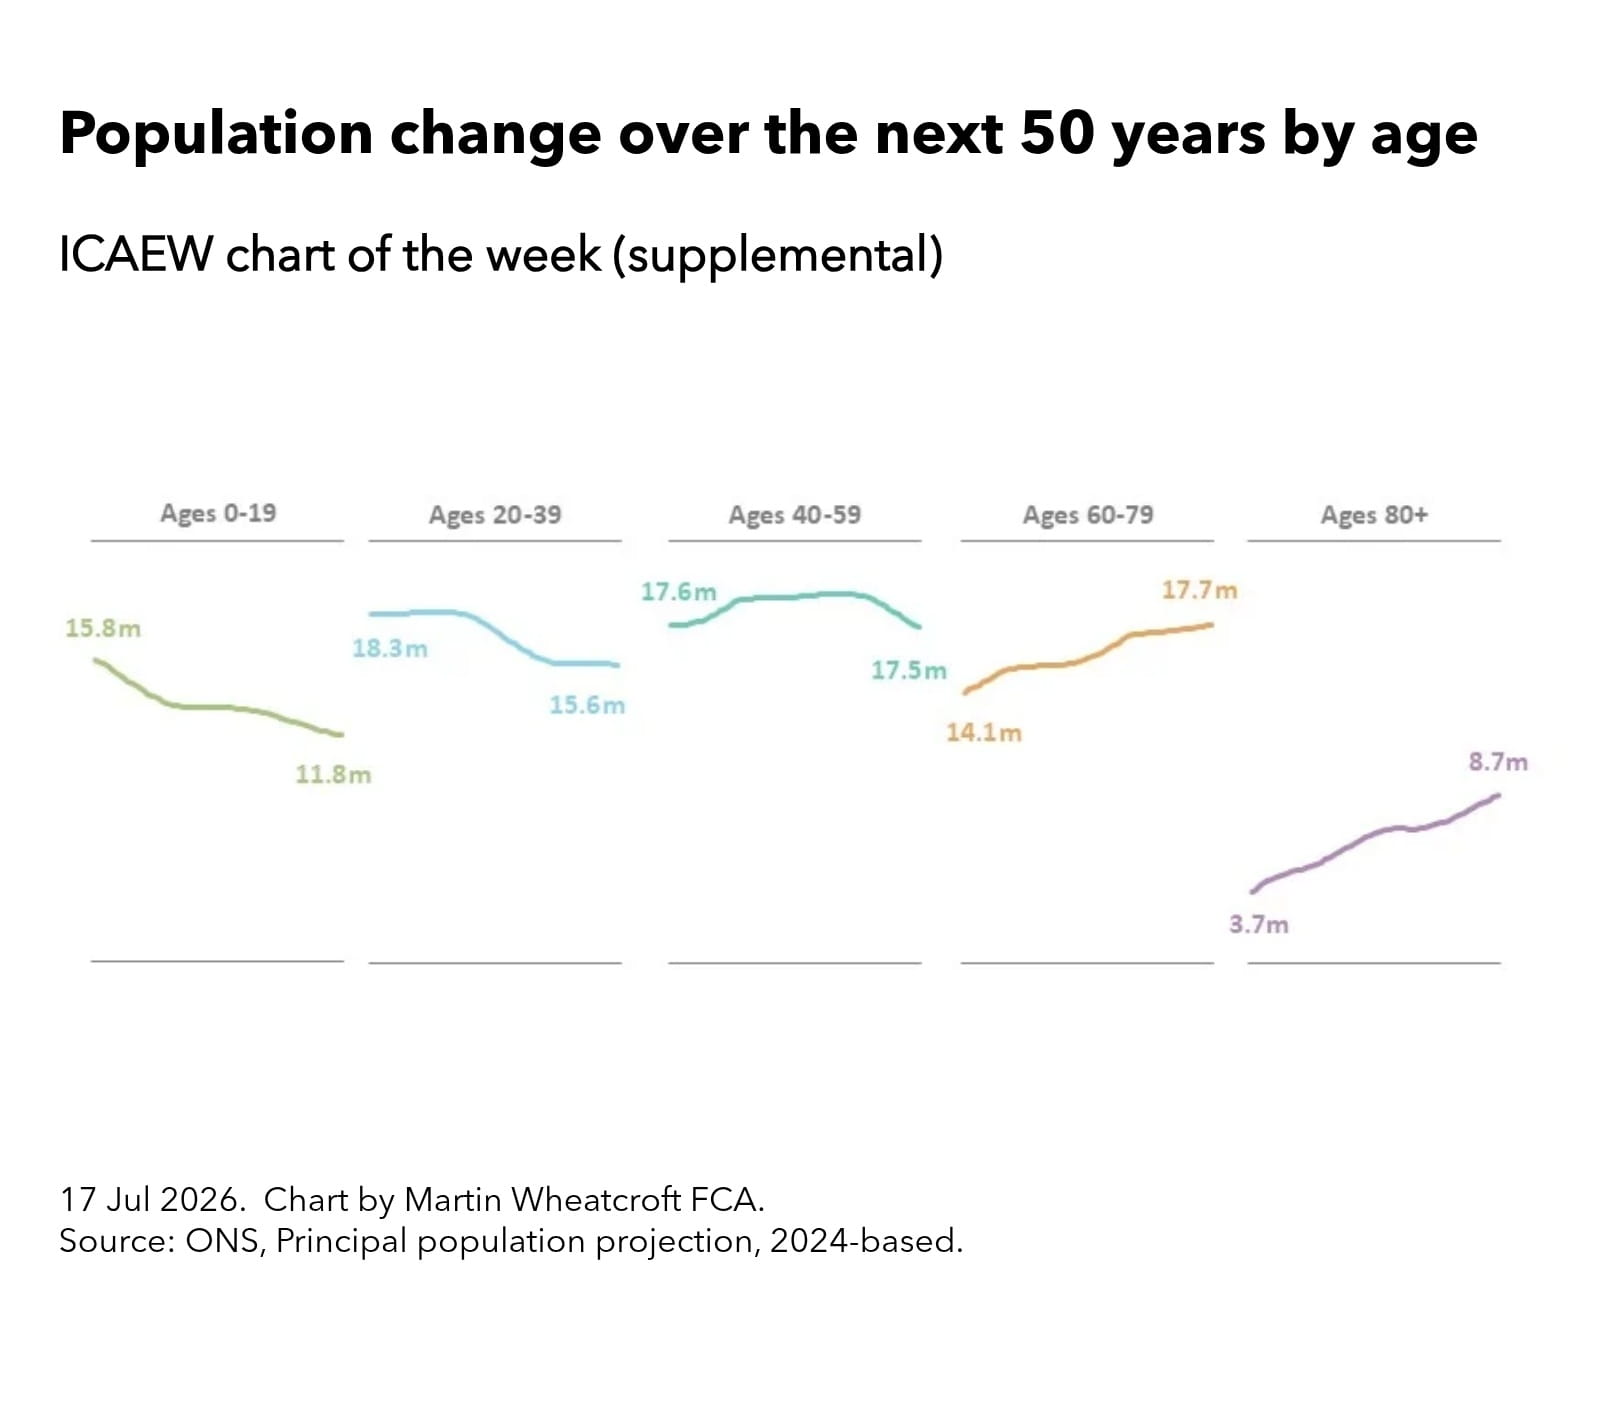
Our supplemental chart shows how each age group is expected to change significantly, with the number of people aged 0-19 falling from 15.8m to 11.8m over 50 years and the 20-39 age group falling from 18.3m to 15.6m, while the 40-59 age group is projected to rise from 17.6m in 2025 but then fall back to 17.5m by 2075.
Meanwhile, the 60-79 age group is expected to rise from 14.1m to 17.7m over 50 years and the number of people age 80 and over is expected to rise from 3.7m in 2025 to 8.7m in 2075.
In other numbers, this is a change of -25%, -15%, -1%, +26% and +135% by age quintile over the next 50 years.
What does this mean for the public finances?
Although the 25% fall in the number of those in the youngest age group should mean a commensurate fall in spending on education in theory, this will be more than outweighed by the higher costs of pensions, health, social care and other welfare costs from the respective 26% and 135% increases in the number of people aged 60-79 and 80+.
This is even before taking account of a triple-lock policy that is expected to ratchet up the value of the state pension, a historically higher rate of healthcare inflation, or the potential for economic shocks to reduce tax receipts over the next 50 years, not to mention the many other issues facing the public finances. The lack of projected population growth is also an issue, as per capita efficiency gains become more difficult to achieve.
The hope will be for much stronger economic growth than is currently predicted by the OBR, as without more money coming in from higher wages and profits, the principal alternative is likely to be a higher tax burden to pay for the cost pressures that come from such a major shift in the demographics of the UK.
And on that cheery note, we would like to welcome incoming First Lord of the Treasury Andy Burnham to his new job in charge of the government and the UK’s public finances.
Further reading
Our main chart this week is a simplification of chart 1.2 on page 21 of the July 2026 OBR fiscal and sustainability report which analyses primary receipts and spending into 10 age groups instead of the five we have used in our charts this week.
Latest charts
Stay up to date
You can receive regular email updates from ICAEW insights, including weekly or monthly enewsletters. Subscribe to whichever works for you.
Sign upFurther resources
ICAEW Community

Public Sector Community
The go-to place for guidance on issues affecting finance professionals working in and with the public sector. With a range of dynamic services, ICAEW provides valuable tools, resources and support tailored to the public sector.
Resources

Economy explainers
ICAEW experts offer simple guides to help understand the technical, economic jargon that is discussed when talking about public finances and the economy.
Find out moreICAEW support

Training and events
Browse upcoming and on-demand ICAEW events and webinars offering support on technical areas, such as assurance, reporting and tax, as well as personal development.
Events and webinars A-Z of courses