According to official statistics released by the Office for National Statistics (ONS) on 29 July 2026, there were 62m people living in England and Wales on 30 June 2025.
Our chart this week analyses how this population estimate is distributed by ONS statistical region, but with the Greater Manchester and West Midlands city-regions shown separately.
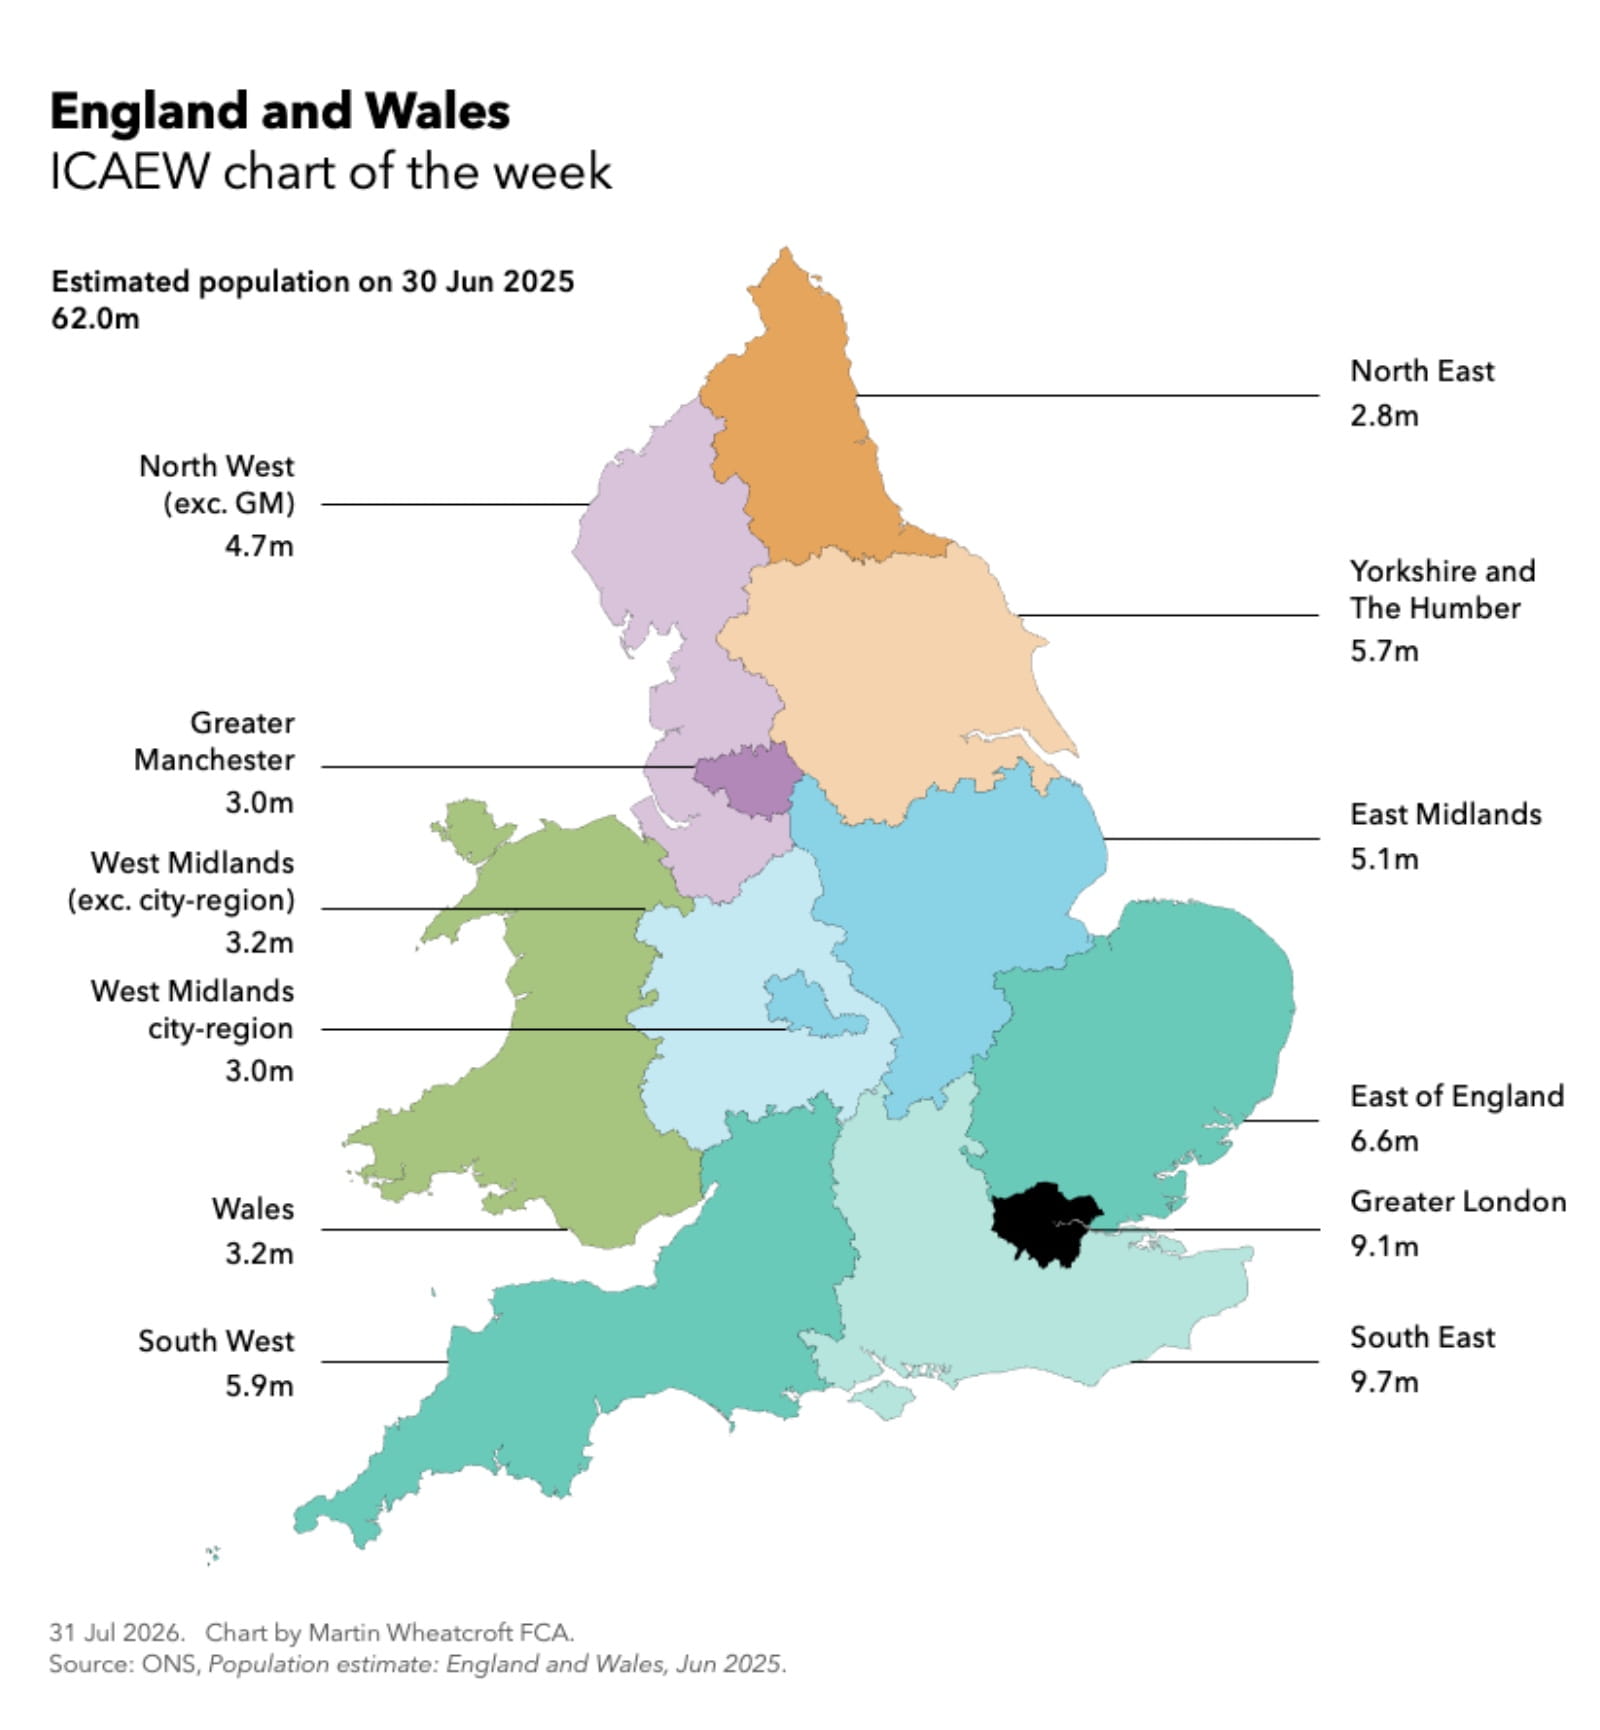
The north of England had a population of 16.2m (26.1%) in mid-2025, comprising:
- 4.7m living in the North West (excluding Greater Manchester);
- 3.0m in Greater Manchester;
- 2.8m in the North East; and
- 5.7m in the Yorkshire and The Humber statistical region.
Wales and central England had a population of 14.5m (23.4%), comprising:
- 3.2m in Wales;
- 3.2m in the West Midlands (excluding the West Midlands city-region);
- 3.0m in the West Midlands city-region (aka Greater Birmingham); and
- 5.1m in the East Midlands statistical region.
The south of England had a population of 31.3m (50.5%), comprising:
- 5.9m people living in the South West;
- 9.7m in the South East;
- 9.1m in Greater London; and
- 6.6m in the East of England statistical region.
These numbers exclude the National Records of Scotland’s estimate of 5.5m people living in Scotland on 30 June 2025 and the approaching 2m people in Northern Ireland on that date for which the Northern Ireland Statistics and Research Agency is yet to publish its final estimate.
The total population for the UK on 30 June 2025 was provisionally estimated to be 69.5m by the ONS last year, with a final estimate expected later this year once the Northern Ireland number has been finalised.
Northern England
The 4.7m population in the North West outside Greater Manchester can be analysed as follows:
- 1.6m in Lancashire;
- 1.6m in the Liverpool City Region (including Halton);
- 1.0m in Cheshire (excluding Halton); and
- 0.5m in Cumberland and Westmoreland and Furness.
Greater Manchester’s population of 3m can be analysed as follows:
- 0.9m in the cities of Manchester and Salford;
- 1.3m in the five metropolitan boroughs north of the centre (Wigan, Bolton, Oldham, Rochdale and Bury); and
- 0.8m in the three metropolitan boroughs south of the centre (Trafford, Stockport and Tameside).
The 2.8m people living in the North East can be split between:
- 2.1m in the North East Mayoral Strategic Authority area (Northumberland, Newcastle, North Tyneside, Gateshead, South Tyneside, Sunderland, and County Durham); and
- 0.7m in the Tees Valley Combined Authority area (Darlington, Hartlepool, Middlesborough, Redcare and Cleveland, and Stockton-on-Tees).
The ONS’s statistical region of Yorkshire and The Humber, includes 0.3m people who live in North Lincolnshire and North East Lincolnshire (which are now part of the Greater Lincolnshire Combined Authority – see below) and 5.4m who live in Yorkshire:
- 2.4m in the West Yorkshire Combined Authority (Leeds, Bradford, Kirklees, Wakefield and Calderdale);
- 1.4m in the South Yorkshire Combined Authority (Sheffield, Doncaster, Rotherham, and Barnsley);
- 0.9m in the York and North Yorkshire Combined Authority; and
- 0.7m in the Hull and East Yorkshire Combined Authority (the city of Kingston upon Hull and the East Riding of Yorkshire).
Wales and central England
The Welsh population of 3.2m people can be analysed as living in one of four regions and 22 local authorities:
- 1.6m in South East Wales (Cardiff, Rhondda Cynon Taf, Caerphilly, Newport, Bridgend, Vale of Glamorgan, Monmouthshire, Torfaen, Blaenau Gwent, and Merthyr Tydfil);
- 0.7m in South West Wales (Swansea, Carmarthenshire, Neath Port Talbot and Pembrokeshire);
- 0.2m in Mid Wales (Ceredigion and Powys); and
- 0.7m in North Wales (Flintshire, Wrexham, Gwynedd, Conway, Denbighshire, and the Isle of Anglesey).
The West Midlands city region population of 3m can be split between:
- 1.2m in the city of Birmingham;
- 1.2m in Sandwell, Dudley, Walsall and Wolverhampton to the west; and
- 0.6m in Solihull and Coventry to the east.
The 3.2m people living in the rest of the West Midlands region comprise:
- 1.7m in Staffordshire and Shropshire to the north and west of Birmingham (including Stoke-on-Trent and Telford and Wrekin);
- 0.8m in Worcestershire and Herefordshire to the south and south west; and
- 0.7m in Warwickshire to the east and south east.
The 5.1m people living in the East Midlands statistical region can be split between:
- 2.3m in the East Midlands Combined Authority area (Derby, Derbyshire, Nottingham and Nottinghamshire);
- 1.1m in Leicester and Leicestershire;
- 0.9m in North Northamptonshire, West Northamptonshire, and Rutland; and
- 0.8m in Lincolnshire (part of the 1.1m in the Greater Lincolnshire Combined Authority – see Yorkshire and The Humber above).
Southern England
The South West’s 5.9m population can be analysed between:
- 1.8m in Devon and Cornwall (including Plymouth, Torbay and the Isles of Scilly);
- 1.0m in the West of England Combined Authority area (the city of Bristol, Bath and North East Somerset, and South Gloucestershire);
- 0.8m in Somerset (excluding Bath and North East Somerset);
- 0.8m in Dorset (including Bournemouth, Christchurch and Poole);
- 0.8m in Wiltshire (including Swindon); and
- 0.7m in Gloucestershire (excluding South Gloucestershire).
The 9.7m people living in the South East can be analysed between:
- 2.1m in Hampshire (including Southampton, Portsmouth and the Isle of Wight);
- 1.9m in Kent (including Medway);
- 1.8m in Sussex (including Brighton and Hove);
- 1.2m in Surrey;
- 1.0m in Berkshire;
- 0.9m in Buckinghamshire (including Milton Keynes); and
- 0.8m in Oxfordshire.
The 9.1m people living in London can be analysed between:
- 3.2m in Inner London (City of London, Westminster, Islington, Camden, Kensington and Chelsea, Hammersmith and Fulham, Wandsworth, Lambeth, Southwark, Lewisham, Greenwich, Tower Hamlets, and Hackney);
- 1.8m in west London (Brent, Ealing, Harrow, Hillingdon, Hounslow, and Richmond upon Thames);
- 1.6m in south London (Kingston upon Thames, Merton, Sutton, Croydon, Bromley, and Bexley);
- 1.5m in north east London (Newham, Barking and Dagenham, Havering, Redbridge, and Waltham Forest); and
- 1.0m in north London (Haringey, Enfield, and Barnet).
The 6.6m people in the East of England are in the following areas:
- 2.0m in Essex (including Thurrock and Southend-on-Sea);
- 1.7m in Norfolk and Suffolk;
- 1.2m in Hertfordshire;
- 0.9m in the Cambridgeshire and Peterborough Combined Authority area; and
- 0.8m in Bedfordshire (including Bedford and Luton).
Change since mid-2024
According to the ONS, the estimated population of England and Wales increased by approximately 224,900 or 0.4% from approximately 61,785,100 on 30 June 2024 to 62,010,000 on 30 June 2025.
The increase comprised births exceeding deaths by approximately 19,600 (588,000 – 568,400) and net inward migration of 211,700 (816,500 – 604,800) less approximately 5,900 net moves to other parts of the UK (52,100 - 58,000) and 500 net outward movements by the armed forces.
Slowing growth
Until recently the ONS was predicting that the UK population would reach 70m by 30 June 2026, with the England & Wales population at around 62.5m.
The latest 2024-based projections are for the UK population to be 66.6m on 30 June 2026, with the England & Wales population at just over 62.1m, a 0.2% increase from 30 June 2025. This reflects a combination of deaths rising to broadly equal the number of births (following falling fertility in recent years), and a predicted reduction in net inward migration to approximately 125,000.
Net inward migration into England and Wales is expected to return to around 217,000 in future years. However, this is offset by around 10,000 a year in net moves to other parts of the UK and by deaths starting to exceed births. The ONS principal population projection gradually changing from approximately -16,000 in the year to 30 June 2027 to -147,000 in the year to 30 June 2050.
As a consequence, the annual rate of growth in the English and Welsh population is expected to fall from around 0.3% in the year to 30 June 2027 to 0.1% in the year to 30 June 2050.
The ICAEW chart of the week will be taking its usual break for August and will return in September refreshed with a new set of economic, fiscal and demographic developments to illustrate.
Latest charts
Stay up to date
You can receive regular email updates from ICAEW insights, including weekly or monthly enewsletters. Subscribe to whichever works for you.
Sign upFurther resources
ICAEW Community

Public Sector Community
The go-to place for guidance on issues affecting finance professionals working in and with the public sector. With a range of dynamic services, ICAEW provides valuable tools, resources and support tailored to the public sector.
Resources

Economy explainers
ICAEW experts offer simple guides to help understand the technical, economic jargon that is discussed when talking about public finances and the economy.
Find out moreICAEW support

Training and events
Browse upcoming and on-demand ICAEW events and webinars offering support on technical areas, such as assurance, reporting and tax, as well as personal development.
Events and webinars A-Z of courses