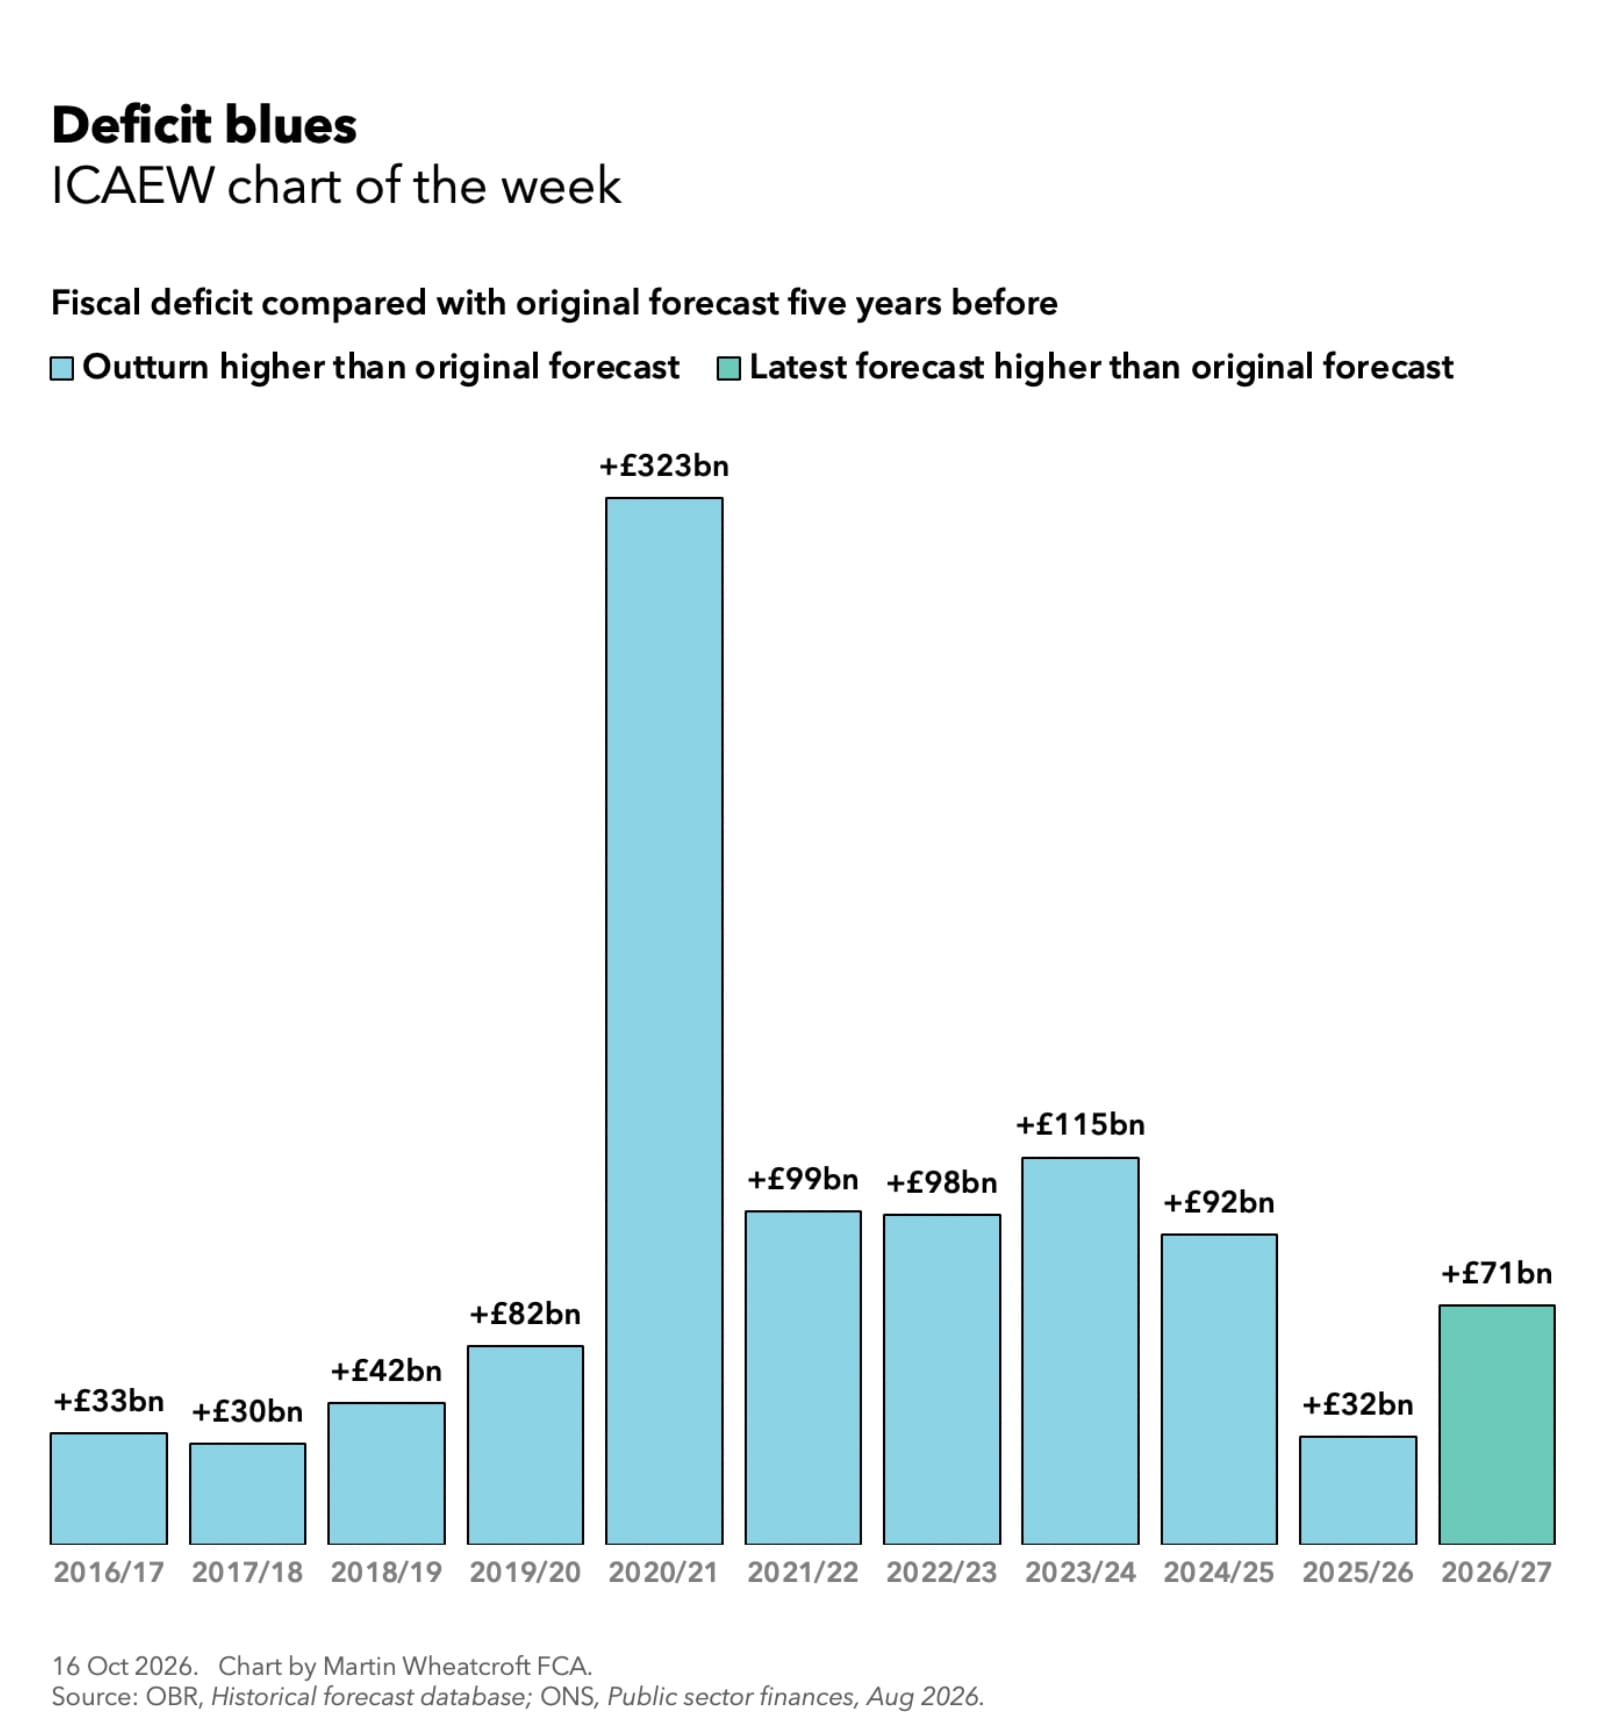
The Office for Budget Responsibility (OBR) maintains a database of official forecasts since before it was established and how they have evolved over the five-year forecast horizon. Our chart this week illustrates this by showing the difference between the first forecast for the fiscal deficit for each fiscal year shown and the outturn five years’ later, or the latest forecast in the case of the current fiscal year.
Our chart starts with 2016/17, where the fiscal deficit outturn per the latest Office for National Statistics (ONS) statistics of £57bn was £33bn higher than the original official forecast prepared in November 2011 of £24bn. This is followed by 2017/18 with a difference of £30bn (£61bn outturn less a £31bn original forecast five years’ previously), 2018/19: £42bn (£44bn less £2bn), 2019/20: £82bn (£59bn deficit less the £23bn surplus originally forecast), 2020/21: £323bn (£311bn less a £12bn forecast surplus), 2021/22: £99bn (£116bn less £17bn), 2022/23: £98bn (£124bn less £26bn), 2023/24: £115bn (£135bn less £20bn), 2024/25: £92bn (£150bn less £58bn), 2025/26: £32bn (£134bn less £102bn) and 2026/27: £71bn (£115bn latest forecast less £44bn originally forecast).
While the pandemic and the energy crisis that followed were of course a major cause of the higher deficits between 2020/21 and 2024/25, the trend is pretty consistent, with an average difference (not shown on the chart) of £61bn over the previous fifteen years, although that did include the financial crisis.
Also not shown on the chart are the latest forecasts for the next four years, where the OBR’s March 2026 forecast for the fiscal deficit were higher than the original forecast by £27bn in 2027/28 (£97bn - £69bn) and £51bn in 2028/29 (£86bn - £35bn), although the forecasts for 2029/30 and 2030/31 were £7bn and £8bn lower (£63bn - £70bn and £59bn - £67bn).
Forecasting is difficult – and policy choices make it harder
Economic and fiscal forecasting is difficult and productivity growth (even on a restated basis) has been stubbornly lower than before the financial crisis. However, a significant contributor to the higher outturns in the fifth year of the fiscal forecast relates to what the OBR describes as policy risks.
These include choices by successive chancellors to increase borrowing to deal with pressures on spending, especially as costs have outpaced overall inflation. Many chancellors have decided to defer planned fiscal consolidation to meet short-term demands or (in the case of John Healey’s immediate predecessor) to increase borrowing to fund more public investment in the hope of boosting economic output.
The International Monetary Fund (IMF) recently congratulated the UK for its plans for fiscal consolidation over the next few years, which are to close the gap between receipts and day-to-day public spending much more quickly than many other developed countries.
However, in a difficult global economic situation, the big question for many debt investors will be how much faith they can put in those plans.
ICAEW on the Budget

Latest charts
Stay up to date
You can receive regular email updates from ICAEW insights, including weekly or monthly enewsletters. Subscribe to whichever works for you.
Sign upFurther resources
ICAEW Community

Public Sector Community
The go-to place for guidance on issues affecting finance professionals working in and with the public sector. With a range of dynamic services, ICAEW provides valuable tools, resources and support tailored to the public sector.
Resources

Economy explainers
ICAEW experts offer simple guides to help understand the technical, economic jargon that is discussed when talking about public finances and the economy.
Find out moreICAEW support

Training and events
Browse upcoming and on-demand ICAEW events and webinars offering support on technical areas, such as assurance, reporting and tax, as well as personal development.
Events and webinars A-Z of courses