Australia Day on 26 January provides an opportunity to take a look at the federal balance sheet for Australia. This is included in the audited consolidated financial statements of the Commonwealth of Australia that are prepared in accordance with Australian Accounting Standards, which generally align with International Financial Reporting Standards (IFRS), although AASB 1049 Whole of Government and General Government Sector Financial Reporting diverges from IFRS in some aspects. They encompass the federal level of government in Australia, excluding states, territories and local authorities.
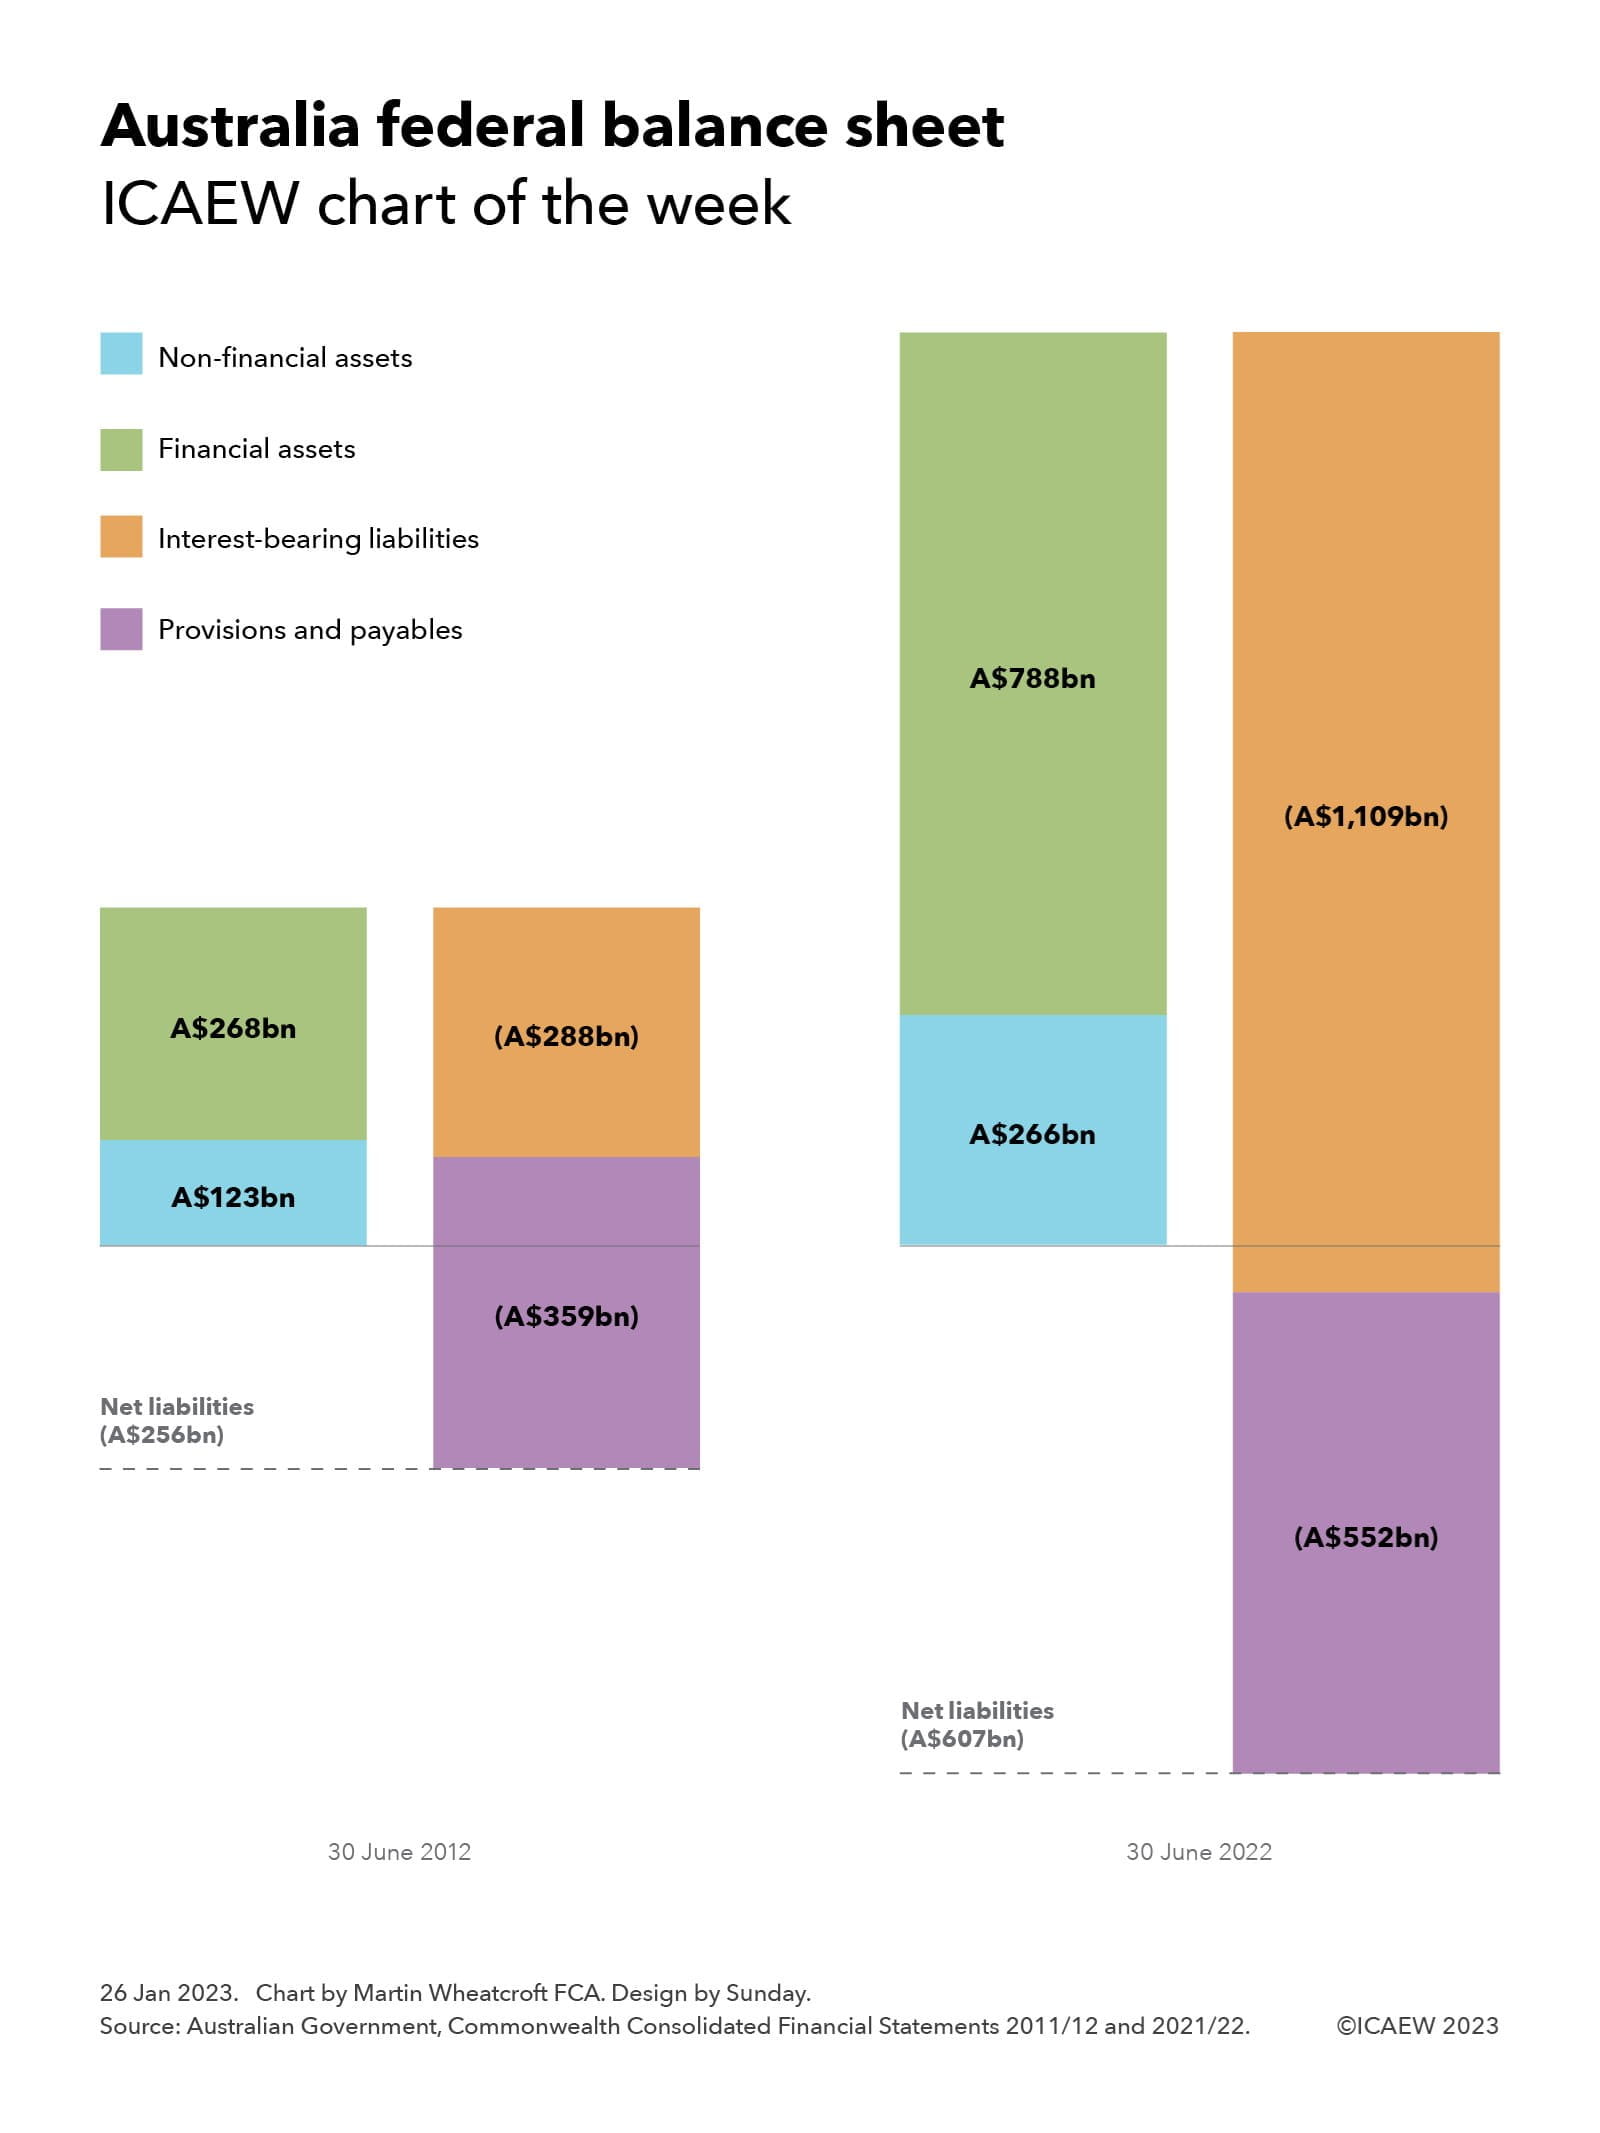
Our chart shows how the balance sheet has grown over the last 10 years, from net liabilities of A$256bn at 30 June 2012 (£147bn at the current exchange rate of A$1.77:£1.00) to A$607bn at 30 June 2022 (£348bn).
At 30 June 2012, the balance sheet comprised non-financial assets of A$123bn and financial assets of A$268bn, less interest-bearing liabilities of A$288bn, and provisions and payables of A$359bn to give a negative net worth of $256bn. These balances had grown to non-financial assets of A$266bn and financial assets of A$788bn at 30 June 2022, less interest bearing liabilities of A$1,109bn, and provisions and payables of A$552bn.
Non-financial asset balances grew over the 10 years from 2012 to 2022 with land and buildings increasing from A$35bn to A$66bn, military equipment A$40bn to A$81bn, other plant, equipment and infrastructure $19bn to A$72bn, intangibles A$7bn to A$15bn, heritage and cultural assets A$10bn to A$13bn, and other from A$12bn to A$19bn.
Financial assets also grew, with investments and loan balances increasing from A$197bn to A$640bn, advances from A$27bn to A$70bn, receivables and accrued revenue from A$39bn to A$69bn, and cash from A$5bn to A$9bn. A substantial proportion of this growth relates to the Australia Future Fund, a sovereign wealth fund that was established in 2006 primarily to cover the costs of paying for unfunded pension obligations, together with a series of smaller funds intended to support infrastructure investment, disability insurance, medical research, indigenous communities and natural disasters.
Interest-bearing liabilities increased significantly as a consequence of the pandemic, with government securities increasing from A$268bn to A$577bn over the 10 years to June 2022, central bank and other deposits from A$3bn to A$426bn, and loans, leases and other interest bearing liabilities from A$17bn to A$106bn.
Provisions and payables grew by a lesser extent, with superannuation and other employee liabilities increasing from A$252bn to A$359bn, Australian currency on issue from A$54bn to A$102bn, payables from A$23bn to A$27bn, and provisions from A$30bn to A$64bn.
While negative net worth has increased from 17% of GDP to 24% of GDP over the 10 years, principally as a consequence of the pandemic in the last couple of years, the establishment of the Australia Future Fund, the move of federal employees from defined benefit to defined contribution pension arrangements, and active management of the balance sheet means that Australia is in a much healthier fiscal position than many other developed countries.
For the Australian Department of the Treasury at least, this should make for a happy Australia Day.
Latest charts
Recommended content
ICAEW Community

Public Sector Community
The go-to place for guidance on issues affecting finance professionals working in and with the public sector. With a range of dynamic services, ICAEW provides valuable tools, resources and support tailored to the public sector.
Resource

More economic insight
ICAEW works with Oxford Economics to provide useful insight and timely intelligence for finance professionals and their clients.
Read moreResource

Energy crisis hub
Analysis of how supply difficulties, rising electricity prices and sanctions against Russia are contributing to turmoil in energy markets. Find out what business can do to lessen the impact.
Find out more