Most people living in the UK would be surprised to discover just how big a gap there is between the council taxes and other income received by local councils, police and fire authorities, and the amount that they spend on public services.
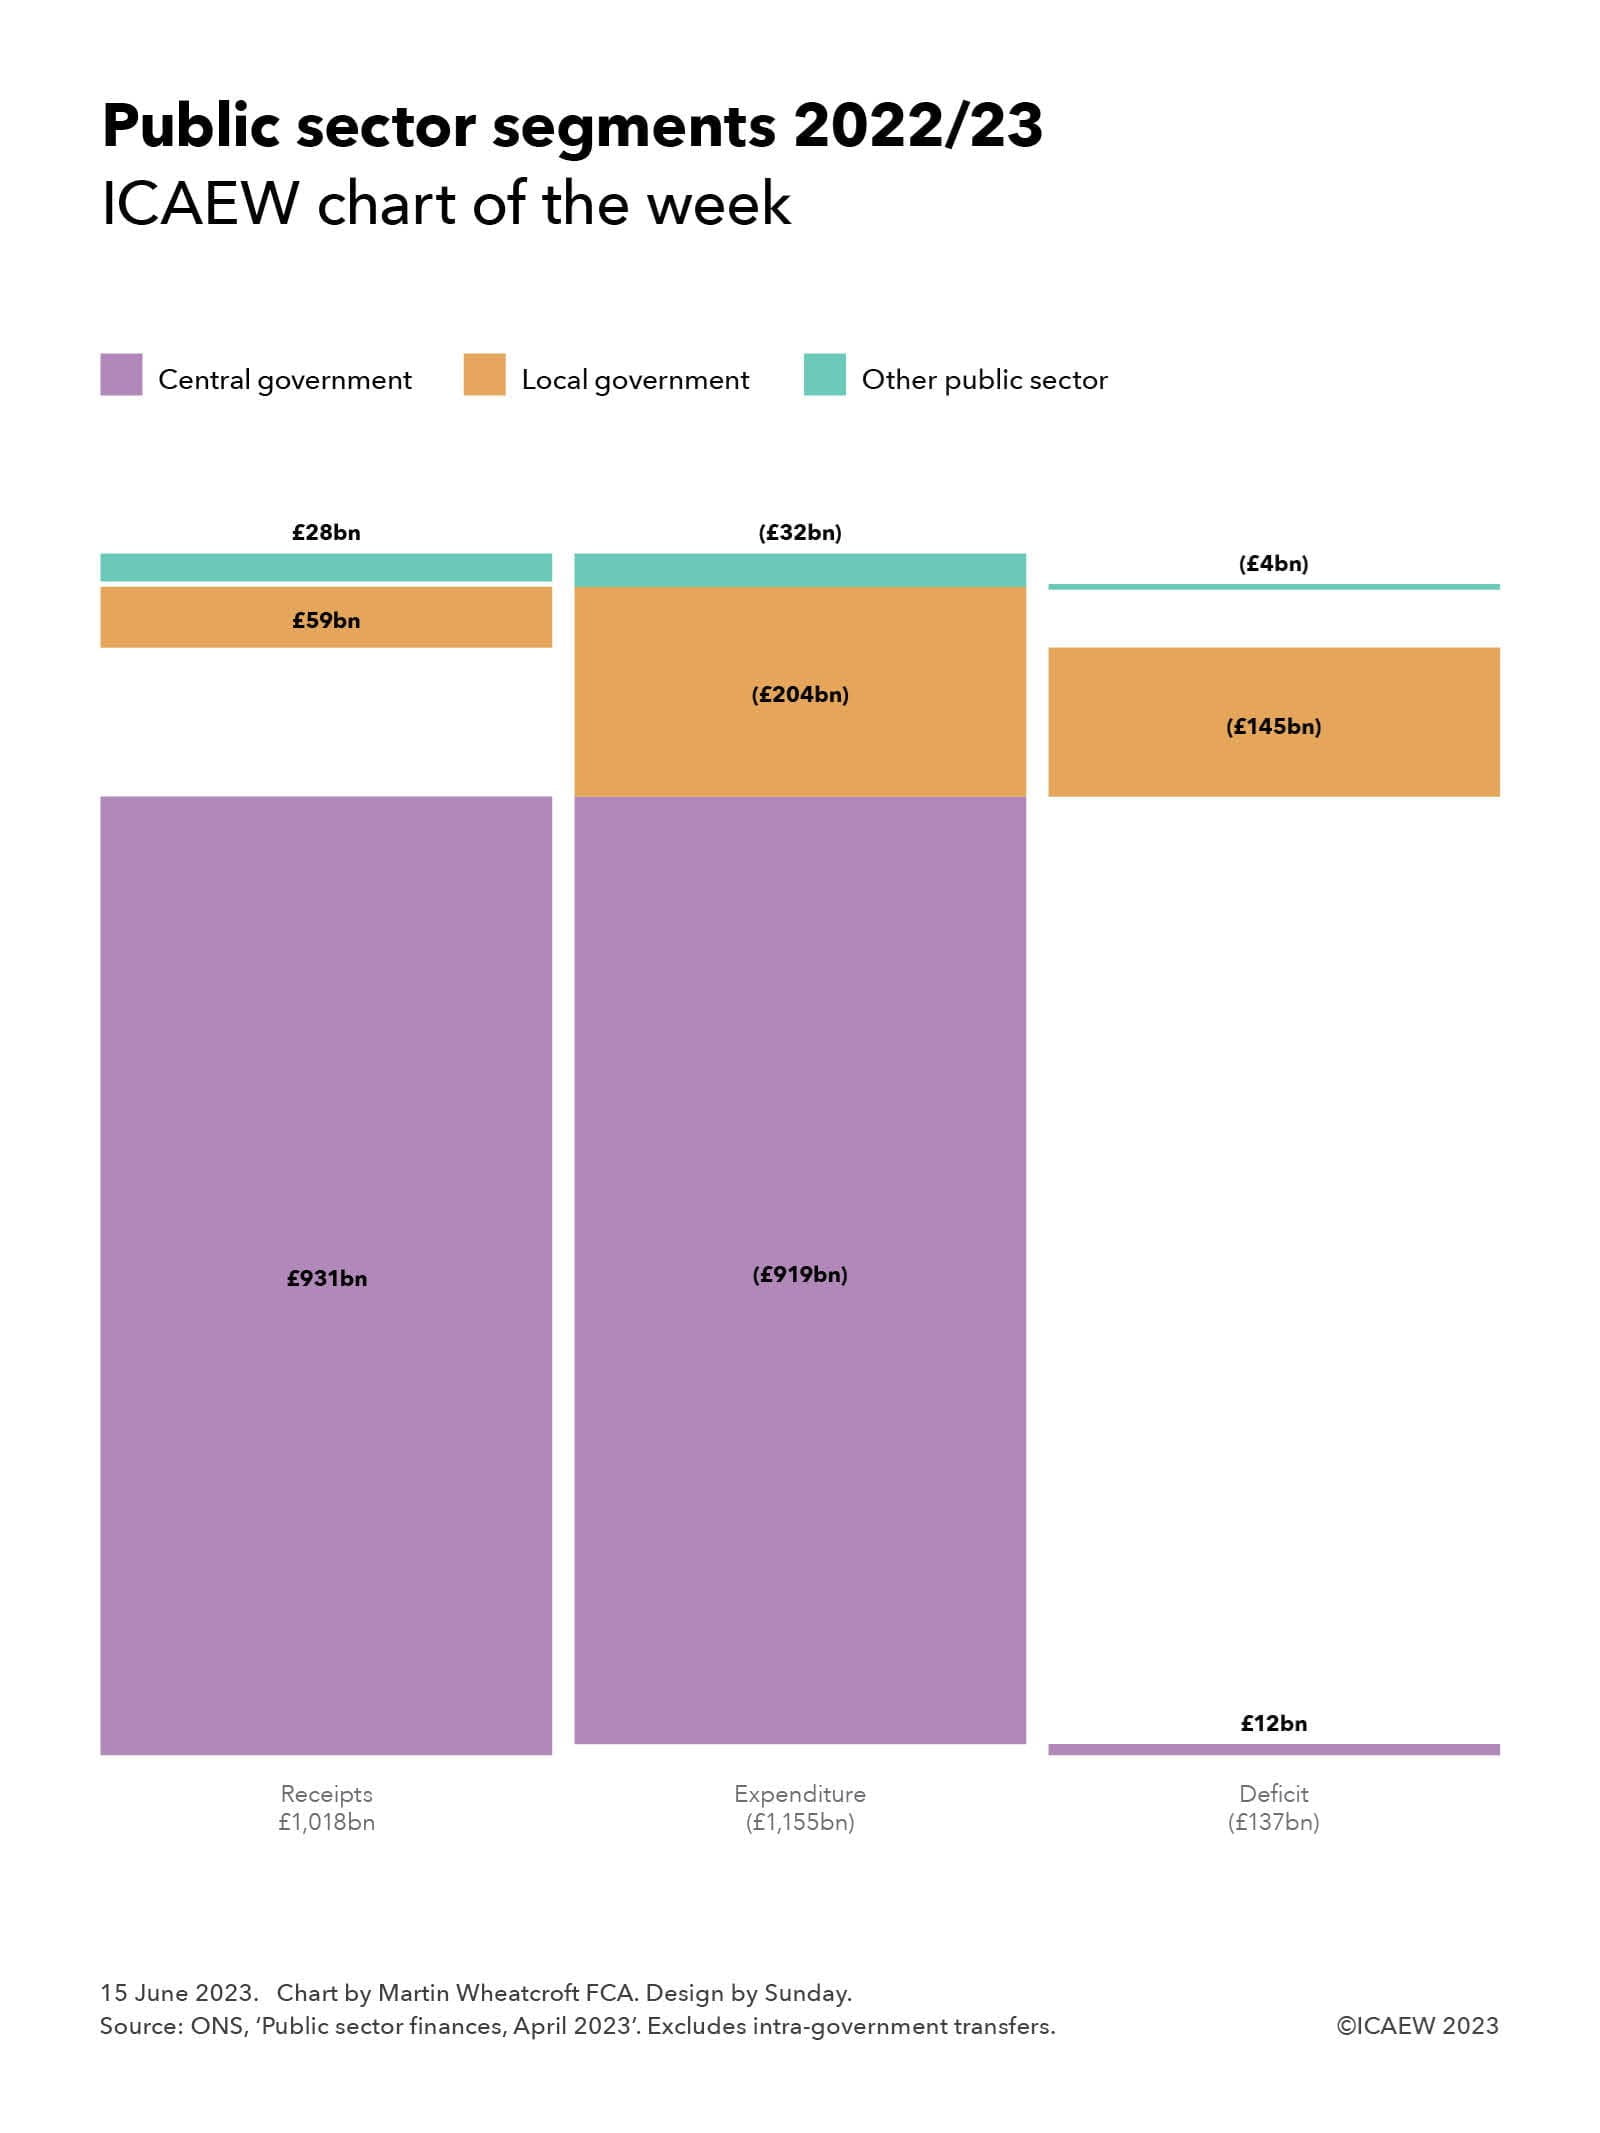
Our chart of the week illustrates this disparity by looking at public sector segments in 2022/23 and how receipts and expenditure match up, before taking account of intra-government transfers.
Fiscal reporting in the National Accounts is broken down into five segments, of which the two largest are central government and local government. The former includes UK government departments, the devolved administrations in Scotland, Wales and Northern Ireland, and several hundred government agencies and other public bodies. Local government principally consists of local authorities across the UK, the Greater London Authority and regional combined authorities in England, police and fire authorities in England and Wales, and local public transport bodies (the largest of which is Transport for London). The other three segments are public corporations (comprising publicly owned businesses plus social housing), funded pension schemes (mostly local authority schemes as central government schemes are generally unfunded), and the Bank of England.
The latest provisional numbers for the financial year ended 31 March 2023 reported that the UK public sector generated £1,018bn in receipts and incurred expenditure of £1,155bn, giving rise to a deficit of £137bn – a shortfall that has been funded by central government borrowing.
Central government raised £931bn in 2022/23 and spent £919bn, a net £12bn surplus before intra-government transfers. Local government received £59bn and spent £204bn, a shortfall of £145bn. And the three remaining fiscal segments together generated £28bn in receipts, and recorded £32bn in expenditure, a net shortfall of £4bn.
By excluding transfers in this way, the chart highlights just how centralised the UK state is, with local government dependent on central government largesse to pay for 69% of its spending in 2022/23.
Local authorities received £41bn in council taxes and £18bn in non-tax receipts, with intra-government transfers amounting to £141bn, comprising £127bn in revenue grants and £14bn in capital grants. Transfers included a redistribution of £25bn in business rates, which although collected by local authorities are national taxes whose disposition is determined by central government. The rest came from a combination of block grants, subsidies, and specific grants (some of which councils need to bid for) as part of a complex and complicated web of funding arrangements for local authorities that makes them highly dependent on the decisions of government ministers.
After transfers there was a reported deficit of £137bn in central government and £4bn in local government, while £8bn in net transfers converted a £4bn shortfall between receipts and expenditure in the three other segments into a net £4bn surplus.
The big picture is of the most centralised state among medium and large economies in the developed world, with local authorities almost entirely dependent on the largesse of central government to fund the essential public services they deliver.
Distributing power to the devolved administrations in Scotland, Wales and Northern Ireland has started to see a share of national taxes dispersed (such as income tax in Scotland and Wales) and some limited tax-raising powers. This contrasts with the debate about devolution in England, which has primarily focused on structures with the partial creation of a regional tier of local government in the form of combined authorities, rather than on more fundamental questions of whether this very centralised system of funding for local authorities needs reform.
Latest charts
Recommended content
ICAEW Community

Public Sector Community
The go-to place for guidance on issues affecting finance professionals working in and with the public sector. With a range of dynamic services, ICAEW provides valuable tools, resources and support tailored to the public sector.
Resource

More economic insight
ICAEW works with Oxford Economics to provide useful insight and timely intelligence for finance professionals and their clients.
Read moreResource

Energy crisis hub
Analysis of how supply difficulties, rising electricity prices and sanctions against Russia are contributing to turmoil in energy markets. Find out what business can do to lessen the impact.
Find out more