Canada is in a celebratory mood this week following a historic knock-out stage win against South Africa in the men’s World Cup 2026 on Sunday 28 June, while Canada Day on Wednesday 1 July marks 159 years since the establishment of Canada as a nation in 1867.
Budgetary balance
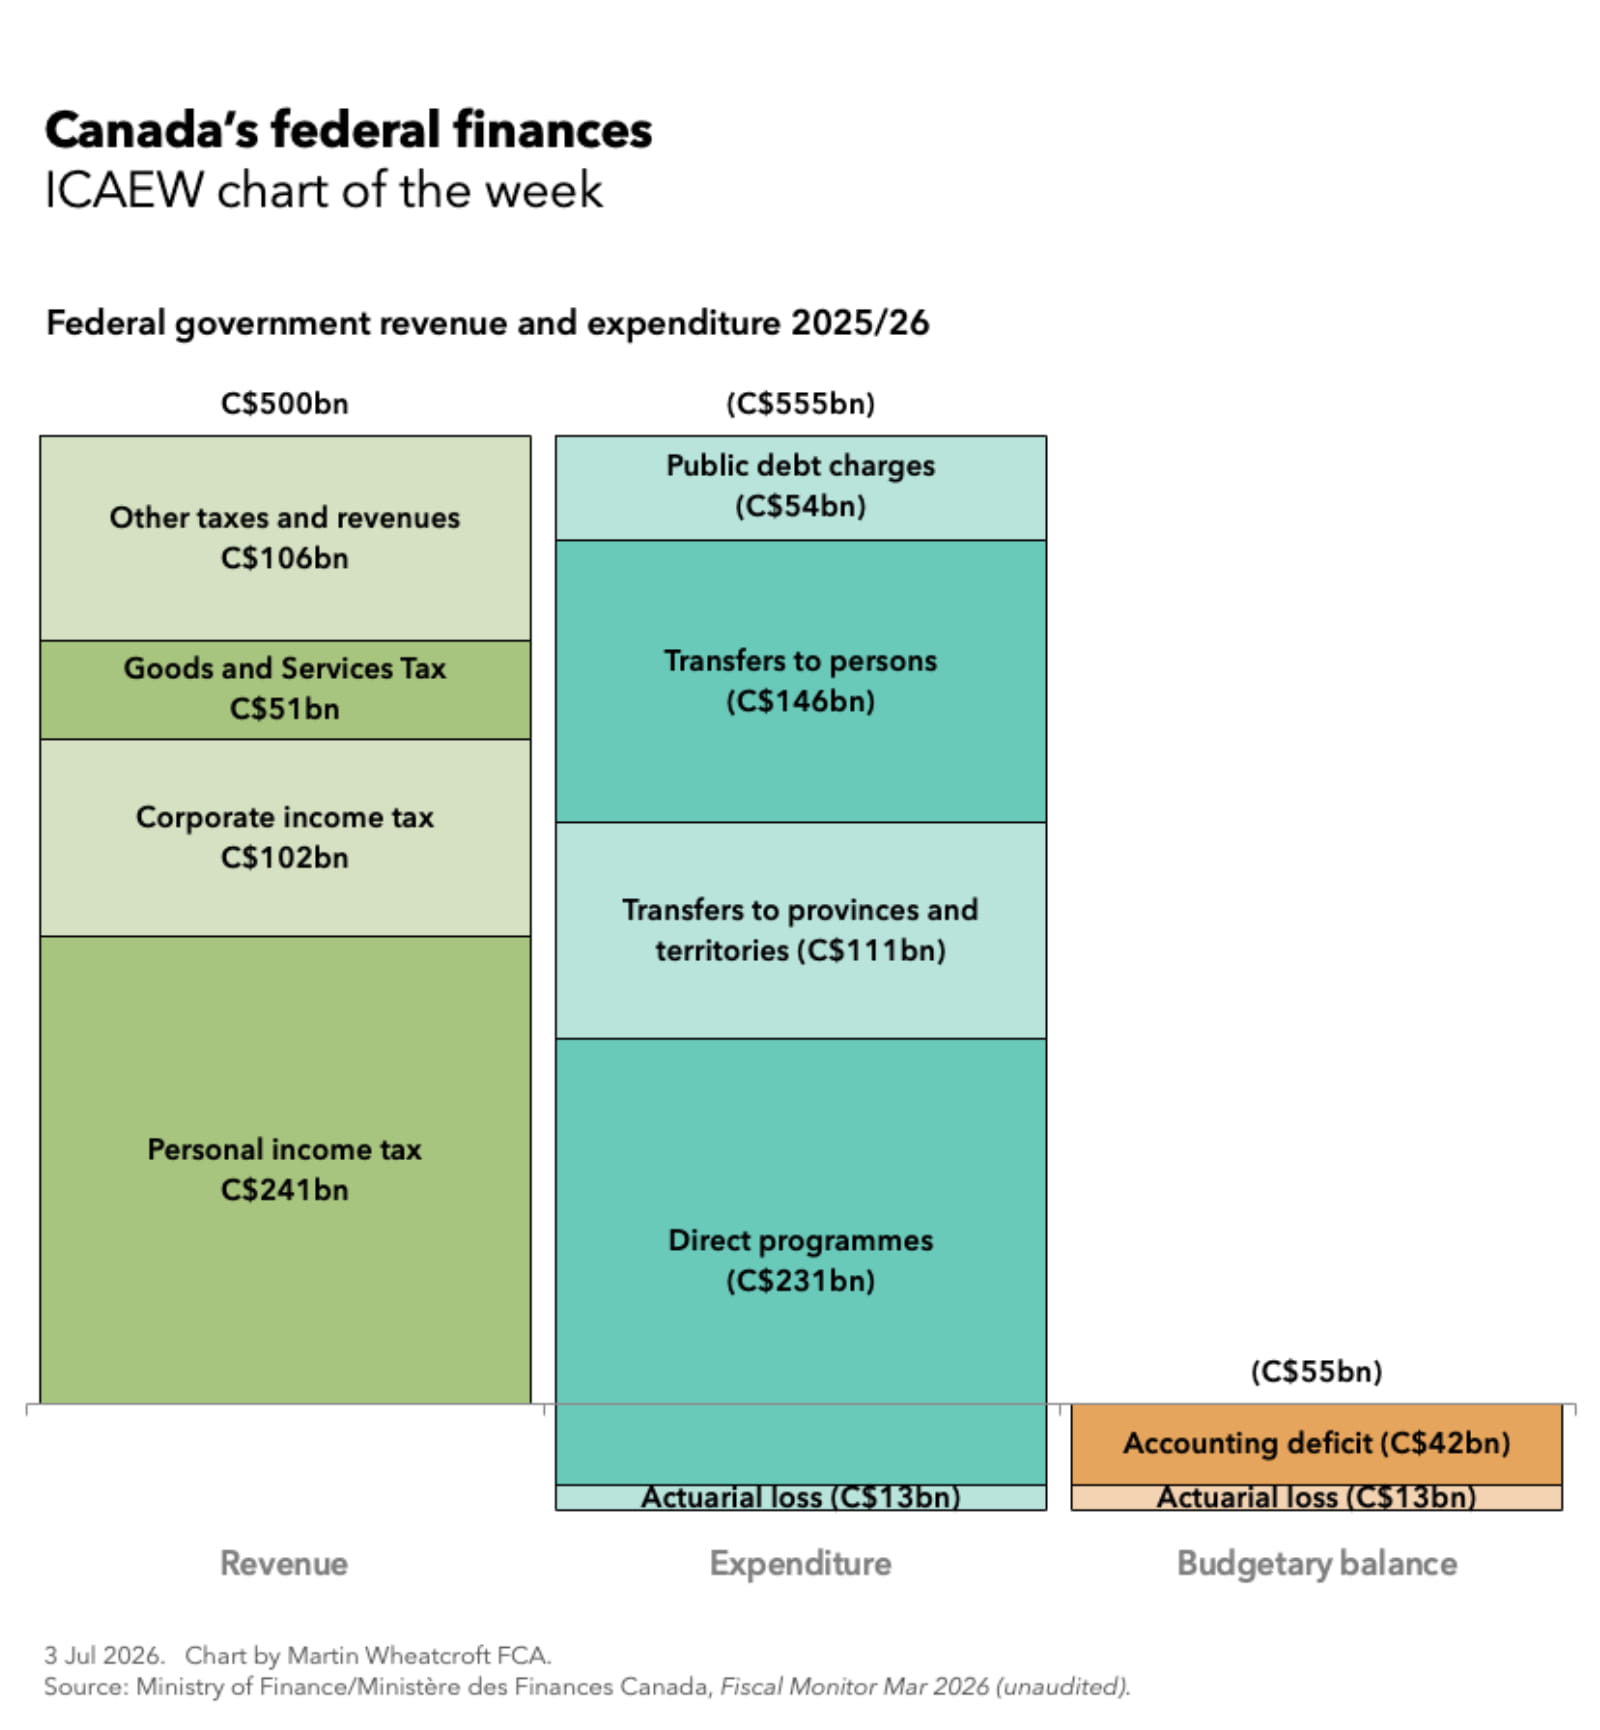
According to the (unaudited) Fiscal Monitor for March 2026 published by the Ministry of Finance/Ministère des Finances Canada, the federal government generated revenue and expenditure of C$555bn in the year ended 31 March 2026 (2025/26) of C$500bn and C$555bn respectively.
The net result was a negative budgetary balance of C$55bn, which consist of an accounting deficit of C$42bn and an actuarial loss of C$13bn.
These numbers are equivalent to revenue of 15.2% of Canada’s GDP less expenditure of 16.9% of GDP for a budgetary balance of -1.7% of GDP.
Alternatively, per capita monthly revenues less expenditures were approximately C$1,000 - C$1,110 = -C$110 per person per month based on an average Canadian population of 41.6m during the year.
Using an average exchange rate of C$1.85 to £1.00 over the course of the year, this was equal to revenue less expenditure of £270bn - £300bn = -£30bn in 2025/26, or approximately £540 - £600 = -£60 per person per month.
These amounts just relate to the federal government and so exclude Canada’s 10 provinces and three territories (each of which have their own tax raising powers), as well as the finances of municipalities and other local government bodies within each province and territory.
Revenue
Revenue of C$500bn comprised:
- C$241bn (7.3% of GDP) from federal personal income tax,
- C$102bn (3.1%) from federal corporate income tax,
- C$51bn (1.6%) from the federal element of the Goods and Services Tax ( Canada’s equivalent of VAT), and
- C$106bn (3.2%) in other federal taxes and revenues.
Other federal taxes and revenues in 2025/26 consisted:
- C$10bn from customs import duties,
- C$6bn from energy taxes,
- C$7bn from other taxes,
- C$33bn in employment insurance premiums, and
- C$50bn in other revenues.
Expenditure
Expenditures of C$555bn comprised:
- C$54bn (1.6% of GDP) on public debt charges (ie, debt interest),
- C$146bn (4.5%) in social programmes and other transfers to persons,
- C$111bn (3.4%) in transfers to provinces, territories and municipalities,
- C$231bn (7.0%) in direct federal government programmes, and
- actuarial losses of C$13bn (0.4%).
Transfers to persons of C$146bn comprised:
- C$83bn in Old Age Security (Canada’s means-tested pension),
- C$29bn in employment insurance benefits,
- C$30bn in children’s benefits, and
- C$4bn in pollution pricing proceeds returned to Canadians.
Transfers to provinces, territories and municipalities of C$111bn comprised:
- C$55bn for Canada Health,
- C$17bn for Canada Social,
- C$26bn in equalization payments,
- C$5bn in territorial formula financing,
- C$8bn for Canada-wide early line and childcare,
- C$2bn for the Canada Community-Building Fund and
- C$4bn for health agreements with provinces and territories.
The C$111bn wasless C$8bn relating to transfers to Quebec that are included in these expenditures but are ‘paid’ through an assignment of federal personal and corporate income taxes directly to Quebec instead of cash transfers.
Direct programme expenses of C$231bn in 2025/26 can be analysed between:
- C$103bn in programme related transfer payments (for example on joint projects with provincial governments), and
- C$128bn in operating expenses incurred directly by the federal government:
- C$69bn personnel,
- C$23bn professional and special services,
- C$13bn other subsidies and expenses,
- C$5bn rentals,
- C$5bn repair and maintenance,
- C$4bn transportation and communications,
- C$3bn utilities, materials and supplies,
- C$1bn other, and
- C$5bn amortisation of tangible capital assets.
Borrowing and debt
The federal government borrowed C$106bn during the year, of which:
- C$55bn was used to fund the negative budgetary balance,
- C$49bn was used to fund capital expenditure, lending activities and working capital movements, and
- C$2bn increased cash balances.
Federal debt is defined by Canada as being equal to net liabilities in the accounting balance sheet, which on 31 March 2026 was C$1,322bn (around 40% of GDP). This comprised:
- C$1,592bn total unmatured debt,
- C$395bn public sector pensions and other employee and veteran benefits,
- C$277bn in accounts payable and accrued liabilities, and
- C$51bn in other liabilities,
- less C$846bn financial assets and C$145bn non-financial assets.
Federal debt was equivalent to approximately C$31,850 per person or around £17,300 per person when converted into sterling using the exchange rate of C$1.84 to £1.00 on 31 March 2026.
Accounting versus fiscal numbers
These numbers are based on accruals-based Canadian public sector accounting standards, which are similar but not identical to International Public Sector Accounting Standards and International Financial Reporting Standards.
They are different to the fiscal numbers reported under the statistics-based IMF Government Finance Statistics and UN System of National Accounts that are used for international comparisons between countries.
A relatively strong balance sheet
According to the IMF, Canada’s general government net debt was estimated to be 10% of GDP on 31 March 2026, much lower than Germany with net debt of 49% of GDP, UK 95%, USA 99%, France 110%, Italy 129% and Japan 134% on the same date.
The Canadian percentage includes the assets (and not the pension liabilities) of social security funds, such as the Canada and Quebec Pension Funds, as well as provincial pension and investment funds.
Statistics Canada reports a slightly different statistic:general government net financial liabilities that also excludes social security pension liabilities. This was 21% of GDP on 31 March 2026, with 33% of GDP for the federal government and 17% of GDP for other levels of government less social security fund net financial assets of 29% of GDP.
Even if social security funds are excluded, general government net financial liabilities of 50% of GDP are still significantly lower than those of comparable advanced economies.
Latest charts
Stay up to date
You can receive regular email updates from ICAEW insights, including weekly or monthly enewsletters. Subscribe to whichever works for you.
Sign upFurther resources
ICAEW Community

Public Sector Community
The go-to place for guidance on issues affecting finance professionals working in and with the public sector. With a range of dynamic services, ICAEW provides valuable tools, resources and support tailored to the public sector.
Resources

Economy explainers
ICAEW experts offer simple guides to help understand the technical, economic jargon that is discussed when talking about public finances and the economy.
Find out moreICAEW support

Training and events
Browse upcoming and on-demand ICAEW events and webinars offering support on technical areas, such as assurance, reporting and tax, as well as personal development.
Events and webinars A-Z of courses