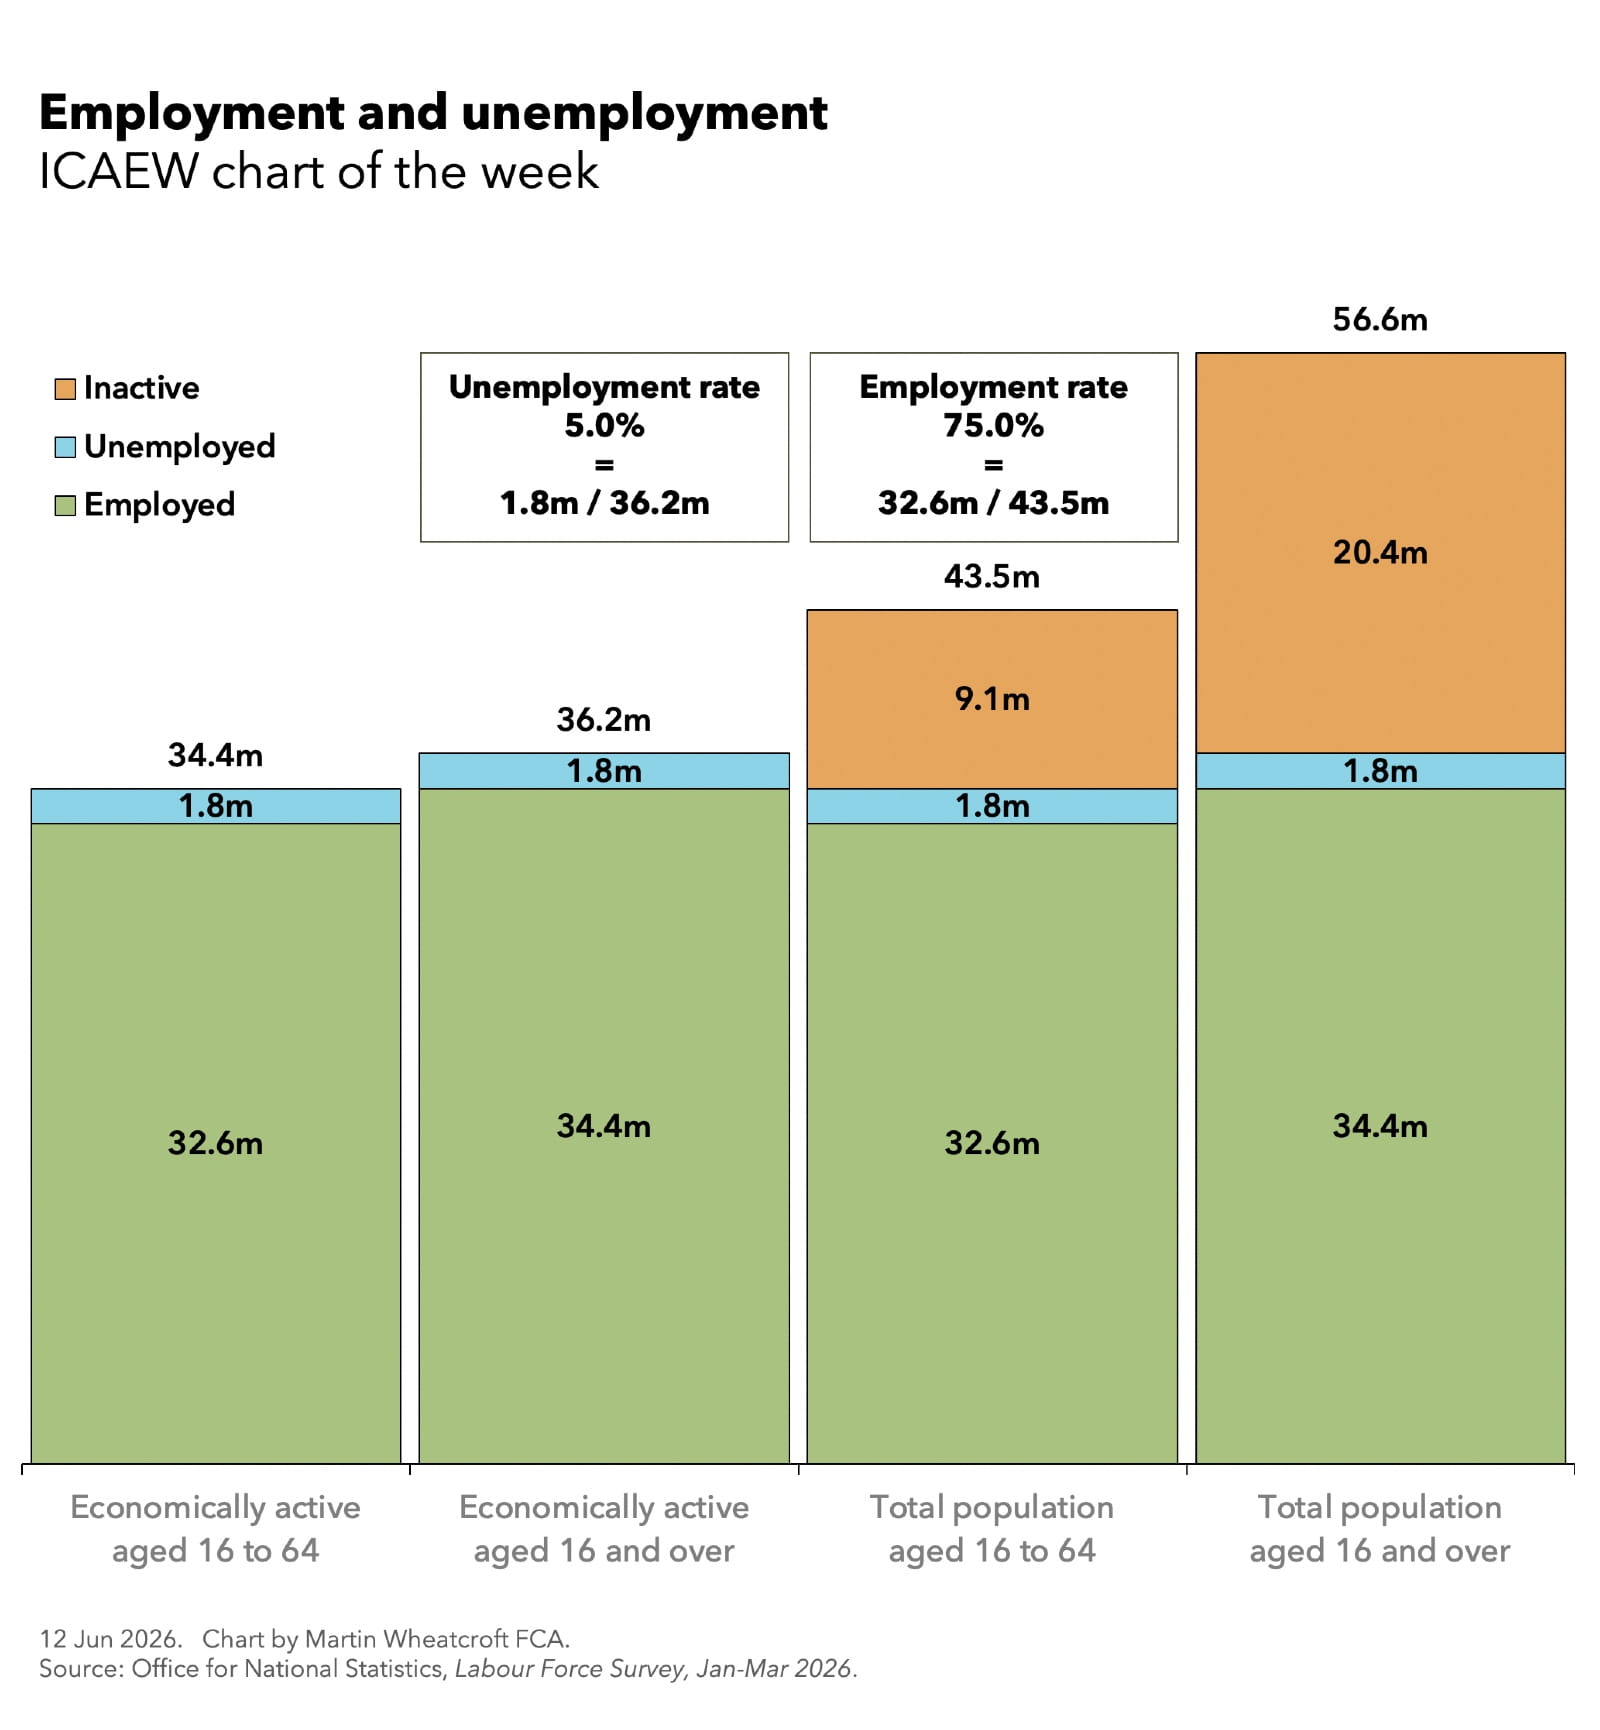
The Labour Force Survey published by the Office for National Statistics (ONS) for the period from January to March 2026 is the subject of our chart this week, highlighting how the employment and unemployment rates are calculated in different ways and hence don’t add up to 100%.
Our chart starts with the 34.4m working age population aged 16 to 64 who are defined as economically active, comprising 32.6m people in employment and 1.8m people who are unemployed and actively seeking work. (This is described as working age despite excluding those aged 65 who had not yet reached the then state retirement age of 66 who were still economically active.)
The second column shows the 36.2m total economically active population aged 16 and over, split between 34.4m people in employment and 1.8m unemployed. This includes 1.8m and 43,000 people aged 65+ who are respectively in employment or unemployed actively seeking work.
The third and fourth columns respectively add in 9.1m and 20.4m economically inactive people aged 16 to 64 and aged 16 and over to reach a total working age population of 43.4m and a total adult population 56.6m (adults in this case defined to include 16 and 17-year olds).
Not included in these numbers were an estimated 13.0m children aged 0 to 15 living in the UK in January to March 2026 who are not counted as part of the labour force even if they have part-time jobs or are actively looking for one.
Employment and unemployment rate calculations
Our chart illustrates how the unemployment and employment rates are each calculated. The unemployment rate is based on the economically active population aged 16 and over, while the employment rate is restricted to those below the age of 65 but is calculated on a total that includes people who are economically inactive.
More precisely, the unemployment rate of 5.0% is based on 1,806,000 unemployed people (including 43,000 aged 65+) divided by 36,198,000 economically active people (including 1,821,000 aged 65+) and the employment rate of 75.0% is based on 32,615,000 people in employment aged 16 to 64 divided by the 43,480,000 total working age population.
Employment
While the number of people in employment has increased over the past 15 years as the working age population (between the ages of 16 and 64) has grown, the employment rate has moved up and down over time. The employment rate was 70.1% in the quarter from July to September 2011 but had risen to 76.4% in October to December 2019. The rate then fell to 74.3% in October to December 2020, rose to 75.1% in October to December 2021 and has fluctuated between 74.5% and 75.5% since then before ‘settling’ at 75.0% over the last three comparable quarters.
Of the 34.4m adults in employment in January to March 2026, 29.6m were employees (22.6m full time and 7.0m part time), 4.6m were self-employed or in partnerships (3.0m full time and 1.6m part time), 136,000 were unpaid family workers, and 57,000 were on government supported training and employment programmes. Within these numbers were 1.3m people who had a second job.
Of the 8.6m people working part time, 0.9m would have liked a full-time job, 0.5m were working part time because of illness or disability, 1.3m were students (including those still at school), and 5.9m did not want full-time work.
Unfortunately, the ONS does not break down the 1.8m economically active people aged 65+ by individual age, making it difficult to know how many 65-year-olds were still in employment in the quarter from January to March 2026. Research from the Department for Work & Pensions reports that the employment rate for this age was 42% in 2025, implying that around a third of a million people (out of a total cohort of 0.8m) would have still been working in the year before reaching the state pension age.
Unemployment
The unemployment rate is lower than the 8.3% reported for the quarter from July to September 2011 and the peak of 8.4% in the following comparable quarter. The rate fell gradually over the following seven years to reach 3.8% in January to March 2019, before rising sharply to 5.3% in October to December 2020 during the pandemic and then recovering to 3.7% in July to September 2022. Unfortunately, it has increased since then to reach 5.2% in the October to December 2025 quarter, before dropping back to 5.0% in the first quarter of this year.
Unfortunately, this particular statistic is less helpful than the employment rate in understanding what is going on with the labour force as it doesn’t incorporate the 2.1m people between the ages of 16 and 64 who would like a job (as discussed below), but who don’t meet the definition of actively seeking work. If they were included in the unemployment rate calculation, it would be closer to 10.2%.
Of the 1.8m people who were recorded as unemployed in January to March 2026, 1.0m had been out of work for up to six months, 0.3m between six and 12 months, and 0.5m for more than 12 months.
Economic inactivity
The ONS reports that the 9.1m people aged 16 to 64 who were economically inactive in the first quarter of 2026 comprised 3.0m people who were sick or disabled, 2.5m students, 1.6m homemakers, 1.0m retirees, and 1.0m who were inactive for other reasons.
Within this section of the population there are 2.1m people who would like a job but don’t meet the definition of actively seeking work, consisting of 0.5m students, 0.4m homemakers, 0.8m who are sick or disabled, and 0.4m inactive for other reasons.
The reported number of students in full-time education of 2.5m aged 16 to 64 is less than the 4.1m total as it excludes 1.3m students who have a part-time job and 0.3m students who are registered as unemployed and actively seeking work.
The 1.8m people aged 65 or over who are still working is greater than the 1.0m below 65 who have retired early, with the former number likely to increase over the next couple of years as the state pension age increase – from 66 to 67 – is phased in.
Latest charts
Further resources
ICAEW Community

Public Sector Community
The go-to place for guidance on issues affecting finance professionals working in and with the public sector. With a range of dynamic services, ICAEW provides valuable tools, resources and support tailored to the public sector.
Resources

Economy explainers
ICAEW experts offer simple guides to help understand the technical, economic jargon that is discussed when talking about public finances and the economy.
Find out moreICAEW support

Training and events
Browse upcoming and on-demand ICAEW events and webinars offering support on technical areas, such as assurance, reporting and tax, as well as personal development.
Events and webinars A-Z of courses