
Over the course of the past 18 months, the ICAEW modelling good practice blog series has been covering the key components of the Financial Modelling Code (The Code) and explaining how each element translates into practice. This final post summarises what’s been covered and what’s next for the application and use of the guidance. Please refer to the each of the main articles for detailed explanation and guidance in each of the summarised areas.
There has been significant disruption in how organisations conduct business and the way we work over the past year and a half. However, financial modellers and developers have had to continue to build, refine and test their models throughout these unprecedented times. Figure 1 below summarises the areas we have covered in the blog series and how they fit together to form the practical guidance of how to follow and implement the Financial Modelling Code.
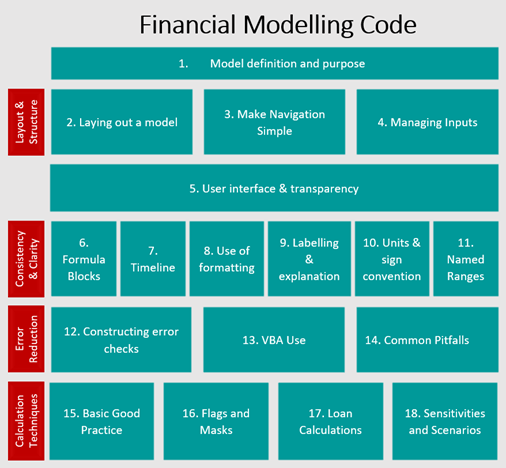
A short summary of what we have covered is outline below. For more information, please refer to the linked pages.
1. Intro to Financial Modelling - Model definition and purpose
An introduction to the ICAEW’s modelling good practice blog series, we started off by clearly defining what constitutes a financial model - The Code offers the following definition of a financial model as, 'a time-based set of financial calculations within a spreadsheet workbook which aims to create a financial forecast based on one or more input set of variables'.
The article also assessing whether a spreadsheet based financial model is the right tool for the job, the characteristics of financial models and the importance of being clear on a financial model’s purpose and planned use.
2. Layout & Structure - Laying out a model
Our second blog post covered the importance of laying out and structuring a financial model. The layout and structure of a model is arguably the most important piece of a model. It is the foundation on which the rest of the model is built – including the model infrastructure – consisting of workbooks and worksheets.
- Workbook infrastructure separates the functionality of a model using the key modules of scenarios, inputs, timing, outputs, operations.
- Worksheet infrastructure outlines what is in operation within each calculation sheet – consisting of:
- Hierarchy of the model - the structure and taxonomy of the model logic.
- The Timing Block - where the workbook-infrastructure feeds into the worksheet infrastructure.
- Worksheet layout - how you might structure a model – Headers, labels, units of measure, references, intermediate or feeder calculations.
3. Layout & Structure – Navigation - “Make Navigation Simple”
The next part in the series highlights how the navigational element within a financial model can often be overlooked and how model navigation can be simplified. The two key reasons why model navigation structure may be overlooked are:
- The builder of the model often has a very good understanding of the elements the model contains and where each element can be found in the workbook, and neglects to put themselves in a user’s shoes and appropriately designs navigation to aid users.
- When time is tight to deliver a model, it is the sections of the model that don’t directly help calculate the output that are often jettisoned.
To ensure simple model navigation, the navigation process can be broken into performing three functions:
- Directory - What is in the model and where is it in the model
- Transit - Making it easy for the user to move through the model
- Orientation – Where in the model am I now
Modellers and developers should always be thinking about the future users of the model. What will make it easier for them to find what they are looking for and how to get there.
4. Layout & Structure - Managing Inputs
In this blog, we focused on managing model inputs and look at how models should be laid out in such a way that users can understand the flow of logic and modify it as appropriate. By building clear and logical sections within a model, users can easily find the components that are relevant to them. The key areas to consider when structuring model inputs are:
- Set up your model to read like a book: with logic flowing from top to bottom, and from left to right both within each worksheet and across sheets within a workbook.
- Document data sources in the overview sheet and/or in each worksheet using information headers.
Visually identify inputs by either keeping inputs in separate clearly labelled worksheets (with no other calculations performed here) OR Placing inputs in clearly identified distinct areas of the same worksheet.
- Use colour coding standards to differentiate between different data.
- Use separate tabs for mass data.
- Use of data validation for inputs help to manage and control what inputs are entered in a model.
- By clearly labelling and visually making inputs easy to find.
The separation of inputs from calculations, outputs and other data types creates a logical design that minimises confusion and facilitates ease of maintenance, reducing the likelihood of introducing errors.
5. User interface and transparency
This article focused on how modellers and developers can improve user guidance and model transparency. User guidance can be separated into two categories – explicit and implicit guidance.
Explicit user guidance is giving the user information throughout the model and there are several ways to achieve this, including:
- Contextual user guidance – providing users information at exactly the point they need it, which makes it more likely to be read and understood.
- User guide worksheet – providing guidance relating to the entire model, such as what is the overall purpose of the model and what different formats and conventions in the model relate to.
- A separate user guide document – although not seen as essential, there may be cases such as rail bids where bid compliance requires a user guide document that is separate from guidance in the model.
Implicit user guidance on the other hand, means laying out your model structure and formatting such that it is self-evident to the user how to interact with it to perform their analysis. Implicit user guidance is very often a by-product of transparency. An example of implicit guidance that is used in most models is formatting inputs in a consistent, unique, and prominent colour.
Transparency in modelling language refers to how much effort is required to understand the trail of both inputs and logic. This can be split into:
- Input Transparency – where labelling is king and all relevant items within a model should have a label applied. This includes all inputs, calculations, and outputs, titles, units, headers, and tables.
- Calculation transparency – is often thought of as reducing the complexity of formulae and avoiding VBA as far as possible, as well as transparency from consistent column structure to sign convention. The key things to note here are, avoid duplication and don’t hide columns, rows, worksheets, and cell information (through formatting).
Always be thinking about the future users of the model. What will make it easier for them to understand how to use the model and find their way through the logic and inputs
6. Consistency - Formula blocks & consistency
Formula consistency in the modelling world, is the concept of having the same formula used across a whole row, and sometimes up and down a block, however, formula consistency could also mean writing your formula in a similar style throughout the model.
Consistency is important for both model builders and users due to:
- Quicker for you to build
- Easier for reviewers
- User friendliness
- Risk reduction
Without formula consistency, calculations are inefficient and can be prone to errors. To ensure consistency is adhered to, the following can be adopted:
- Cell anchoring
- Use the same functions and writing style
- Apply sensible sign reversing
- Duplicate coding or sheets
- Adopt the same style when updating someone else’s model
For every rule there can be an exception and the code mentions the possibility of inconsistent formulas used “for a good reason”. However, you should mark them clearly with prominent formatting and ensure that there is sufficient information to explain the formula inconsistency.
In series 7 of our blog, we consider the need for consistent structure in models, specifically timelines. Model consistency benefits both the modeller (builder) and end user. The modeller benefits from efficiency and cost savings through better model orientation and making it easier to spot errors. End users benefit from intuitive design and comparability.
Ideally, each worksheet of a model should only contain one timeline. If the model requires information with different periodicities (both monthly and quarterly inputs), these are best separated into different sheets - for instance, having a monthly sheet that has only monthly inputs, workings, and outputs.
It is not recommended to mix different timeframes on the same worksheet as this impacts consistency and comparability of model information within a worksheet. If the model design deviates from the Code, then it is paramount that sufficient labelling and instructions are given to avoid costly errors.
8. Clarity - Use of formatting
Model presentation and use of formatting is discussed in detail in series 8 of the blog. Visual standards are high throughout the world of business: in presentations, in documents, in websites. Financial models need to have a similar standard of presentation, with the emphasis on communicating quickly and clearly so that they can be used as efficiently as possible.
Formatting can be used to guide the user’s eye, to give context to the contents of cells, to make the model easy to read and provide the right level of detail. A good place to start is Microsoft’s standard formats in Excel. This helps to visually identify where the inputs, calculations, outputs, and assumptions are. Further, conditional formatting can be used to highlight anomalies and values of interest – these are particularly useful for error and variance checks.
The key to good formatting is planning the formats in advance, so that you have a cohesive, consistent, and well-organised model that is easy to follow and use. Choose your formats up-front before you begin.
9. Clarity - Labelling & explanation
Article 9 focuses on the fundamental aspects of adding labelling and explanations to Excel models and examples of how this can be achieved to ensure model risks are managed. The application of clear labelling and explanations to models can often be overlooked as modellers focus on its functionality, assumptions, calculations, and accuracy of outputs.
The key benefits of clear labelling include:
- They reduce the dependency on the individual author’s knowledge regarding the operation of a given model.
- Clear labelling and explanations in a model help ensure the model is understood, interpreted, and operated correctly.
- Accurate and up-to-date documentation supports control over models and allows for knowledge transfer between users.
- Clarity reduces the potential for inaccurate reporting and/or inappropriate decision making based on a misunderstanding of numerical data or implicit model functionality.
Modellers need to consider the users who will be running the models and those referencing the model for reporting purposes. It is therefore especially important that clear labelling and explanations are used throughout the model to guide users.
10. Clarity, Units and Sign Convention
Continuing under the “clarity” chapter of the financial modelling code, we arrive at the guidance on units and sign convention. It is important to use clear units of measure and sign conventions in financial models.
Why? It is often the case that models will be dealing with different currencies, percentages, and measures from different industry sectors (e.g., energy & utilities). This means you have a model that has various units of measure all in one place, it is paramount that you have the units of measure correctly labelled or formatted to clearly show users what the number represents and what the business context is.
Similarly, the use of sign convention is also important in financial models. The use of signage should always be defined upfront in the notes / instructions section. Use the Excel formatting options to appropriately select the signage required and consistently apply this throughout the model.
The application of units of measure and signage is often seen as a ‘quick win’ and when correctly and consistently applied within a model, the risk of misinterpretation and misunderstanding can be reduced.
In this instalment of our continuing blog series on the ICAEW’s Financial Modelling Code, we explore the main principles behind named ranges: how and when to use them; key points to consider when creating a named range; and how these principles can be extended to VBA when creating macros.
One commonly stated reason for using named ranges is to aid model transparency by making formulae more intuitive to read and interpret. Correctly applied, this can embed the purpose and nature of the formula within the cell, making it easy for a reader to understand. This also applies to the use of Dynamic Arrays when dealing with named range that contained multiple cells.
There are also drawbacks when using named ranges – especially when users inherit models and are not aware of the named ranges in use or worksheets / sections of a model are imported elsewhere. Repeated iterations of coping sections / worksheets can lead to thousands of named ranges in a model which can cause confusion and uncertainty. To ensure this issue is minimised, we recommend regular maintenance of the Name Manager, periodically reviewing and removing erroneous or unused named ranges.
12. Error reduction - Constructing error checks
Moving one from model clarity, this article examines risk and checks when building models, to reduce errors as much as possible. All models have errors within them, but the tried and tested approach to ensure that errors are spotted and resolved is to ‘review, review, review’. There are several options to ensure that a model is reviewed and proclaimed, ‘error free’. Not all these options are economic and practical (e.g., model audits – often being costly and time consuming).
One method of reducing model risk and error reduction is to build in automated error checks through out the model to quickly indicate when and where problems arise. At every step of building a model you think to be thinking: what could go wrong here? And: how can this be checked automatically?
At a minimum, modellers should always look to build in error checks at the input (including assumptions and interfaces), calculation and output sections of a model.
When creating error checks, we need two things to happen:
- The check needs to identify any error, but not show an error when there isn’t one
- The user needs to be clearly informed of an error and be able to trace the error quickly
To VBA or not VBA – that is the question asked in article 13 of the series. It is a common aspiration for modellers to be able to effectively use VBA in their models. However, just as knowing your debits and credits doesn't make you good at business, knowing VBA doesn’t make you good at modelling. It is more difficult, but more useful, to learn how to structure your models to reduce or eliminate the need for VBA altogether.
A common tenet of financial modelling standards – including ICAEW’s own Financial Modelling Code, is that models should be easy to read and be transparent enough to use and understand. The use of VBA goes against this notion and can often lead to complications within a model.
Modellers need to be aware that the users of models may not have the same experience and skill set to understand and maintain VBA coding within models. It is also often the case that users may not even be aware of VBA being present in a model. Therefore, using VBA within Excel models may not be the right answer and alternatives should be sought.
14. Error reduction - Common pitfalls
Part 14 of the series concludes on the error reduction section of the Code. In this post we rationalise a model review system, and parse different types of errors to understand how you can – quite simply – reduce the “degree of wrongness” to acceptable limits. The key message when performing a model review is to triage your review with a process, not a checklist.
We outline the model review process and the steps required to understand and reduce the chance of errors in the model. This includes identifying the seven types of errors associated with modelling “skill types”. The separate skills that one needs to master to put together a best practice financial model is also equally the source of a potential error. The table below summarises the Model Skill type and examples of errors arising from each type.
|
|
Model skill |
Examples of error |
|
1 |
Formula omissions, extra’s & linking |
· Linking: linking the incorrect cell or range · Omissions or extras: Missed converting units, for example units should be % per annum, rather than % per quarter. The same can apply if a conversion is wrongly included. |
|
2 |
Anchoring |
· Ranges not anchored, or over-anchored |
|
3 |
Functions |
Misunderstanding of how functions/formula are used. · LOOKUP – not having sequential data · MATCH – not using the Type correctly · IFERROR · OFFSET |
|
4 |
Tools |
Errors in the “Tools” that Excel provides. These, for example: · Usage of Named Ranges – double naming cells · Conditional formatting |
|
5 |
Model infrastructure |
Poor model infrastructure can result in errors. Some example candidates are: · Inconsistent timing strips can result in monthly or quarterly calculations being referenced to annual calculations through direct linking · Circularities can result from lack of knowledge of structuring calculations, financial statements etc. These slow down the model, and sometimes the iterations don’t converge. |
|
6 |
Subject matter knowledge |
Errors in knowledge around how to do specific calculations – for example · How to compound escalation · How to balance the balance sheet, rather than the dreaded “balance sheet plugs” |
|
7 |
Best Practice |
Best practice errors generally affect the robustness and transparency of the model – i.e. they make it time consuming or incorrect to update the calculation logic or inputs in the model. Examples are · There are hardcodes in a cell · Inputs are not separated from calculations · No/inconsistent formatting |
There is no fool-proof method of removing all errors from a model, however, triaging your model review can help to reduce the biggest errors in the shortest space of time.
15. Calculation Techniques - Basic Good Practice
Building on the fundamentals of model design and good practice from previous articles, part 15 of our series provided a good practice guide for calculation techniques within financial models. Below are some basic tips to keep in mind during a model build to generate reliable outputs and improve the robustness of your model.
- Avoid Circular References in calculations as this increases the risk of errors going unnoticed
- Avoid using hardcoded numbers in formulae as they are difficult to spot for users
- Avoid unnecessary rounding as this can compromise the accuracy of a model
- Have the End-user in mind - who is using the model and their level of competence with Excel and models? With this in mind:
- Minimise Calculation Complexity
- Build Traceable References
- Use VBA and Macros Sparingly
16. Calculation Techniques - Flags and Masks
Models are not static. Almost all financial models will include some requirement to perform different calculations in different time periods with assumptions and scenarios built in to ensure users can make informed decisions. Part 16 focuses on how to make sure your model is doing the right things at the right time in a way that’s easy to understand and update, via the practical use of flags and masks.
What are flags and masks?
- A flag can be defined as a type of ‘helper row’ since its purpose is to indicate which of several behaviours is desired in each column/row.
- A mask is a special type of flag which doesn’t just get used in an IF or CHOOSE function, rather it can be used to multiply an earlier result.
The key types of flags and masks covered include:
- Date Cut-Off - A simple binary flag, which is 0 before a Cut Off Date, and 1 afterwards (or vice versa).
- Counter - An ascending or descending index starting or ending in a specific period.
- Periodic - A binary flag which repeats with a given frequency. Important to remember you need to specify both the frequency and datum. I.e., if rent is quarterly are the quarters Jan/Apr/Jul/Oct or Mar/June/Sep/Dec for example.
- Contingent - A binary flag is set based on certain criteria being met, for example all the debt is fully repaid and there are positive reserves and cash – if these are all met then we can pay a dividend.
- Scalar - A percentage calculated in each period, can be used in a similar way to a binary flag, except that being non-binary it will produce a non-binary answer.
The benefits of using flags and masks include making the model easier to read and update by separating the underlying calculation of values from the logic tests used to determine which option to use in each period and make the model easier to review because there are more ‘check points’ (i.e., interim results) visible in the calculation chain on the page.
17. Calculation Techniques - Loan Calculations
Article 17 moves onto how we can structure and build loan calculations based on what we have covered our previous blog posts. Considering all we have learnt, the building blocks needed for loan calculations are:
- Structure and consistency - calculations are built upon consistent structure, and loan calculations are no exception.
- Formulas - decompose down calculations into small parts, the most important of which are timing flags.
- Flags - We use flags to drive the timing, separating out the timing elements of calculations and re-using the results multiple times.
- Checks - ensure checks are built in at each of the key sections – assumptions, inputs, calculations, and outputs.
- Corkscrew accounts - The key construction for a loan account is the “corkscrew account”. This accounting invention is a standardised way to present a balance over time. Ensure appropriate labelling and explanation is given to ensure users understand the calculation structure and process.
Modellers should also be able to clearly articulate and include the implicit assumptions that are typically found in loan calculations. These include (i) interest calculation days convention (e.g., 30/360, or Actual/365), (ii) repayment method (e.g., annuity, sculpted) and (iii) how future repayments change due to current over- or under-repayments. To avoid confusion and reduce input errors, use clear labelling, and annotate the assumptions!
18. Calculation Techniques - Sensitivities and Scenarios
In the final part of our series that provides practical guidance on how to best apply the ICAEW’s Financial Modelling Code, we look at how using sensitivity and scenario analysis is a key part of any financial model.
Sensitivity analysis and scenario analysis are sometimes referred to as interchangeable terms for the same thing, but they are two very clear and different concepts, and both are very useful. They are both important from a risk assessment and decision-making perspective.
- Sensitivity analysis is used to gauge the impact of a change in specified individual variables. It answers questions such as how much does the NPV of equity returns change if sales decrease by 10%?
- Scenario analysis is used to understand the impact on project or business outcomes of changing multiple inputs in tandem or broader changes such as an alternative decision, a contrasting future economic environment or a different financing structure.
That’s a wrap!
Although we have been through a whirl wind summary of our blog series, the past 18 months have given more emphasis on how important it is to design, build and implement financial models that follow the Financial Modelling Code. The application of a consistent structure to financial models makes it easier for users to understand, follow and use. Further, it reduces the overall risk of model error – whether it is structural or operational in nature.
We hope you have enjoyed this blog series. We will be back soon with a new one!
Excel community
This article is brought to you by the Excel Community where you can find additional extended articles and webinar recordings on a variety of Excel related topics. In addition to live training events, Excel Community members have access to a full suite of online training modules from Excel with Business.

- Intro to Financial Modelling - Part 19: Wrap-up
- Intro to Financial Modelling - Part 18: Sensitivities and Scenarios
- Intro to Financial Modelling - Part 17: Calculation Techniques - Loan Calculations
- Intro to Financial Modelling - Part 16: Calculation Techniques - Flags and Masks
- Intro to Financial Modelling - Part 15: Error reduction - Common pitfalls
Archive and Knowledge Base
This archive of Excel Community content from the ION platform will allow you to read the content of the articles but the functionality on the pages is limited. The ION search box, tags and navigation buttons on the archived pages will not work. Pages will load more slowly than a live website. You may be able to follow links to other articles but if this does not work, please return to the archive search. You can also search our Knowledge Base for access to all articles, new and archived, organised by topic.
