
In last months post, John Yeldham covered Constructing error checks. In his post he points out that a model is never right – and “there are degrees of not rightness and those degrees matter to the users of the model”.
This concept is incredibly important and central to reviewing financial models. In this post we rationalise a model review system, and parse different types of errors to understand how you can – quite simply – reduce the “degree of wrongness” to acceptable limits.
Rationalising a model review system
Observation 1: You have limited time
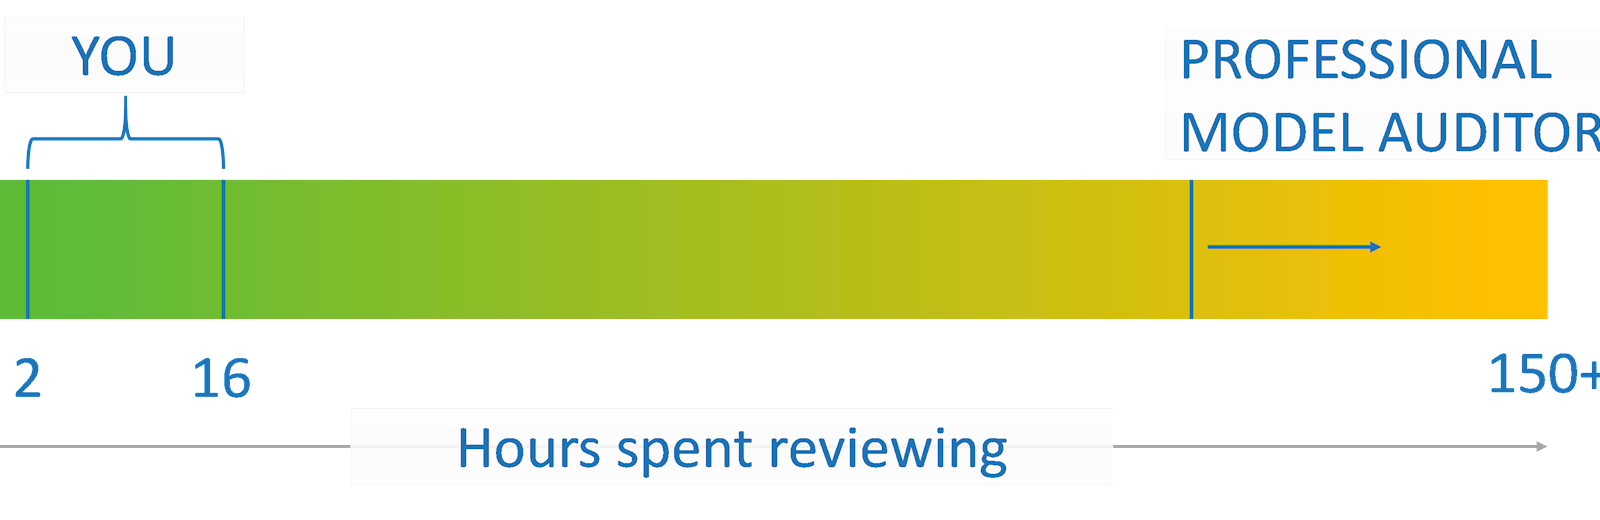
Professional model auditors need to budget a LOT of time in reviewing financial models. In fact it’s fairly standard to spend 150+ hours on reviewing a model. This is the high stakes end of the spectrum .
Let’s assume you have much less time, perhaps between 2-16 hours. Given that, we’ll need to change approach to get the biggest bang for buck out of your time!
Observation 2: All models contain errors, but they matter to varying degrees.
As alluded to in the introduction to this post, the goal is to not to be 100% right, but to be less wrong.
Consider that even an extensive review will not yield a perfect result. Panko [2016] notes that single-person code inspection catch only 20% to 40% of all errors. Note, the same author in a separate study found this this increases (to 63%) when inspectors apply a methodology to the review (Panko [1999]).
Given that your time is limited, we can use the Pareto distribution here to our advantage. Grossly paraphrasing this for our purposes: 80% of the likely error in the outputs comes from 20% of the errors.
Quick caveat: this is a philosophy not a policy – I’m not suggesting a 20% tolerance is acceptable, I’m building a case for how to tactically find the biggest sources of errors, and NOT a “leave no stone unturned” approach.
Observation 3: The model is a hierarchy
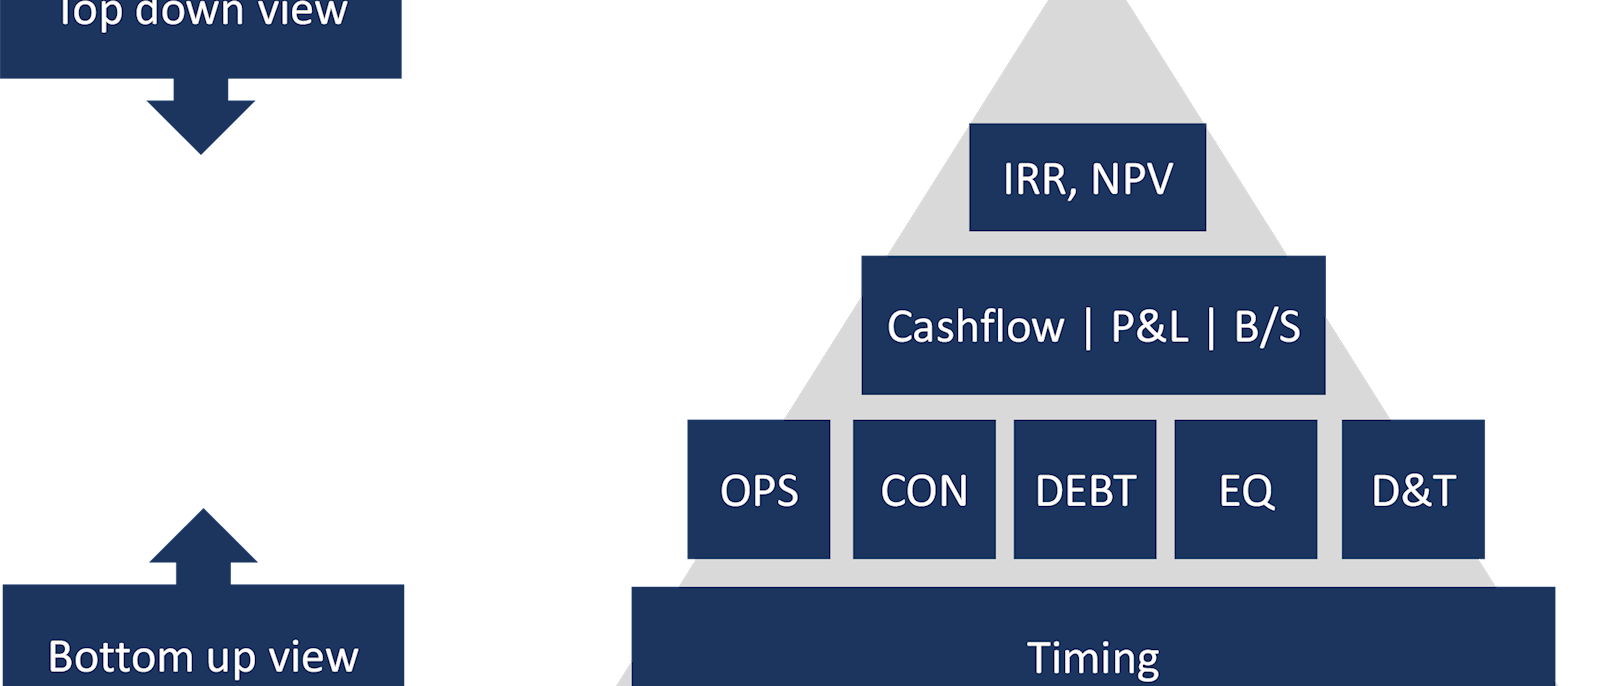
Where: OPS=Operations, CON=Construction/expansion, DEBT=Debt, EQ=Equity, D&T=Depreciation & Taxation
Each financial model has a purpose, or set of purposes. For example: to value an asset, to assist decision making by examining different scenarios and their effect on key variables, to provide variance analysis between historicals & the budget, and so on. Most of these key outputs are at the valuation level (e.g. IRR, NPV), or at the financial statements level (cashflow, P&L, balance sheet).
All the individual modules of the model build up to the financial statements and the valuation metrics in a hierarchy. Therefore, focus on the cashflow, P&L, and balance sheet first for your scrutiny – and feel free to get invasive (see point 2 of the system below for systematic extreme value analysis).
Conclusion: Triage your review with a process, not a checklist
So in short, 1. your time is limited so 2. Aim to be less wrong; using 3. a process that takes advantage of the model hierarchy. Sound simplistic? It’s a lot better than a scattershot approach, OR using an exhaustive checklist.
Exhaustive checklists are helpful but will probably be ignored. No one has time for following the 103 things that you should do to review a financial model, or for self-reviewing your model.
The model review process
If you buy into the above premise, then we need to understand a little more about the process, and cover the major types of errors that the process should illuminate.
I’ve assembled the following methodology having reviewed financial models from multiple perspectives – as a professional model auditor, reviewing others’ models (e.g. for credit processes), and self-review. This is also the product of multiple conversations with other model reviewers, and from teaching and refining the method. I don’t claim it to be exhaustive, but given the other premises in Rationalising a Model Review System, I hope you’ll find this a useful framework in understanding and reducing the chance of errors.
Many steps will be somewhat explanatory from the diagram, however we’ll briefly articulate the steps and then provide depth to this framework by discussing the types of errors that each of these processes will throw up.
Step 1: Using Commercial review to isolate errors
Below is an excerpt of the Financial Statements from a wind farm model. Can you find any potential errors?
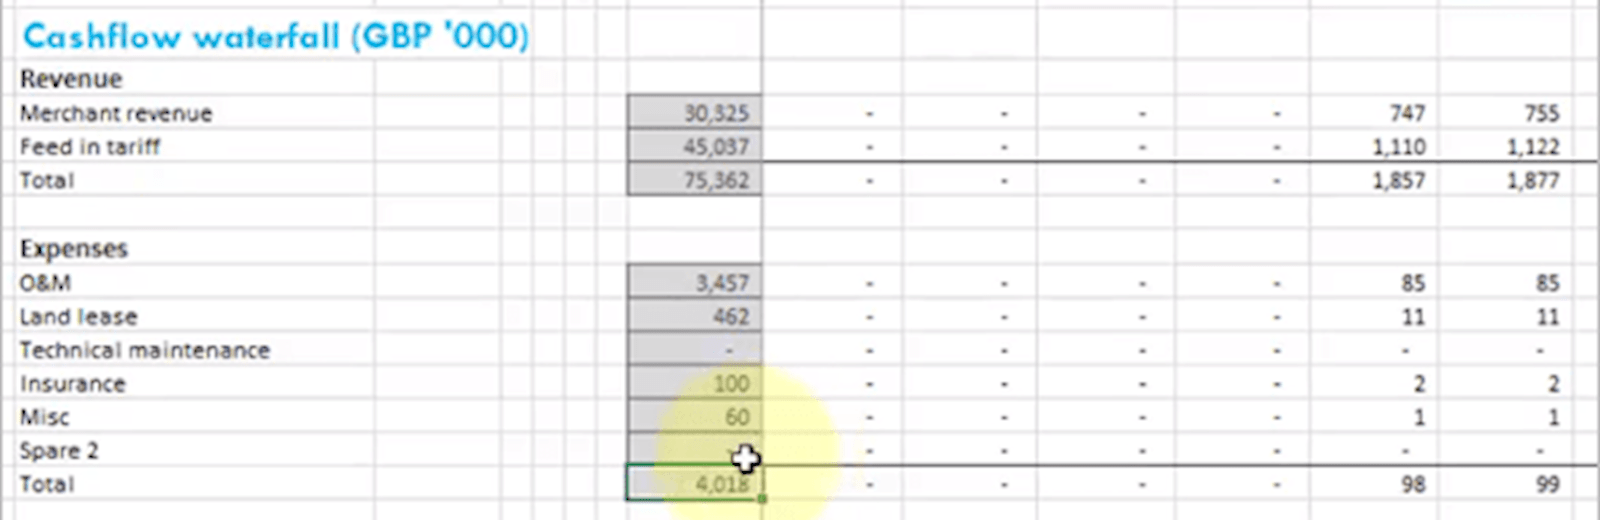
Above, two things should pop out.
- Expenses are represented as positive numbers. This may not NECESSARILY be incorrect –people have different sign conventions for their financial statements. One needs to check how they are added together to be sure!
- The relative size of the Expenses is £4M, which is very small compared to revenue of £75M.
Commercial review should be a compass for isolating errors in a model, as it will help to pick up the non-trivial errors. I’ll point out the obvious here: the more you know about an industry, the easier commercial review gets; and with it the ability to eyeball an O&M (Operations & Maintenance) figure for a given year and say “that looks far too small!”
Other quick wins include
- conducting a row differences exercise: Highlight an entire calculation row (i.e. where the formula should be consistent) and use Ctrl + \ to highlight any inconsistencies. I apply this to entire sheets at a time by highlighting the calculation columns from start of calculation (in my models, column J, all the way to the end of the sheet calculations).
- checking Transition points on the financial statements – for example, is there an expansion, are there any revenue cliffs, does debt pay down or refinance when expected? These can be checked with charts or sparklines to give a visual indication of trends.
- checking the model Warnings & Alerts – as per last weeks article here
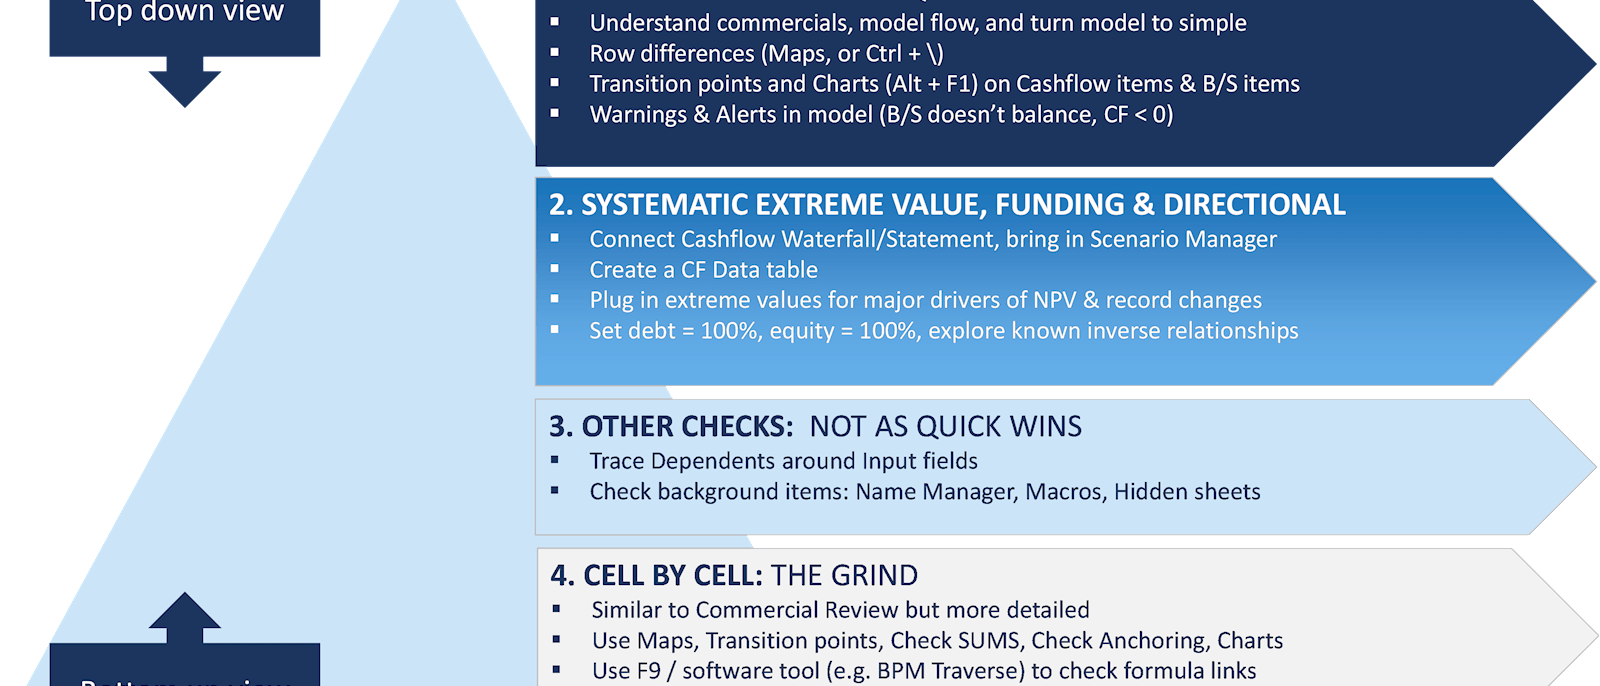
Steps 2 through 4
Step 2 involves putting extremely large or small values into the model, and observing how the outputs change. This can be done systematically by
- Changing the key value drivers, through the scenario manager
- Recording the outputs in a data table, so to compare the effect that each extreme value has on key outputs, independently
Step 3 involves some more routine checks such as using trace dependents on input fields to pick-up mislinked items.
Step 4 is a cell-by-cell process similar to step 1, but on a row by row basis.
7 types of errors
Again, while the model review process can help isolate errors, you’ll need to know what to look for – the error types.
There are many ways of classifying error types. I’ve classified error types here by “skill type”. Each of these are separate skills that one needs to master to put together a best practice financial model. And each of these is equally the source of a potential error.
Most of the errors you will come across will relate to 1. Omissions, extras & linking; 2. Anchoring, 3. Functions. As such, we will explore these particular errors in more detail below.
|
|
Model skill |
Examples of error |
|
1 |
Formula omissions, extra’s & linking |
· Linking: linking the incorrect cell or range · Omissions or extras: Missed converting units, for example units should be % per annum, rather than % per quarter. The same can apply if a conversion is wrongly included. |
|
2 |
Anchoring |
· Ranges not anchored, or over-anchored |
|
3 |
Functions |
Misunderstanding of how functions/formula are used. · LOOKUP – not having sequential data · MATCH – not using the Type correctly · IFERROR · OFFSET |
|
4 |
Tools |
Errors in the “Tools” that Excel provides. These, for example: · Usage of Named Ranges – double naming cells · Conditional formatting |
|
5 |
Model infrastructure |
Poor model infrastructure can result in errors. Some example candidates are: · Inconsistent timing strips can result in monthly or quarterly calculations being referenced to annual calculations through direct linking · Circularities can result from lack of knowledge of structuring calculations, financial statements etc. These slow down the model, and sometimes the iterations don’t converge. |
|
6 |
Subject matter knowledge |
Errors in knowledge around how to do specific calculations – for example · How to compound escalation · How to balance the balance sheet, rather than the dreaded “balance sheet plugs” |
|
7 |
Best Practice |
Best practice errors generally affect the robustness and transparency of the model – i.e. they make it time consuming or incorrect to update the calculation logic or inputs in the model. Examples are · There are hardcodes in a cell · Inputs are not separated from calculations · No/inconsistent formatting |
1. Omissions, extra’s & linking
Omissions & extras
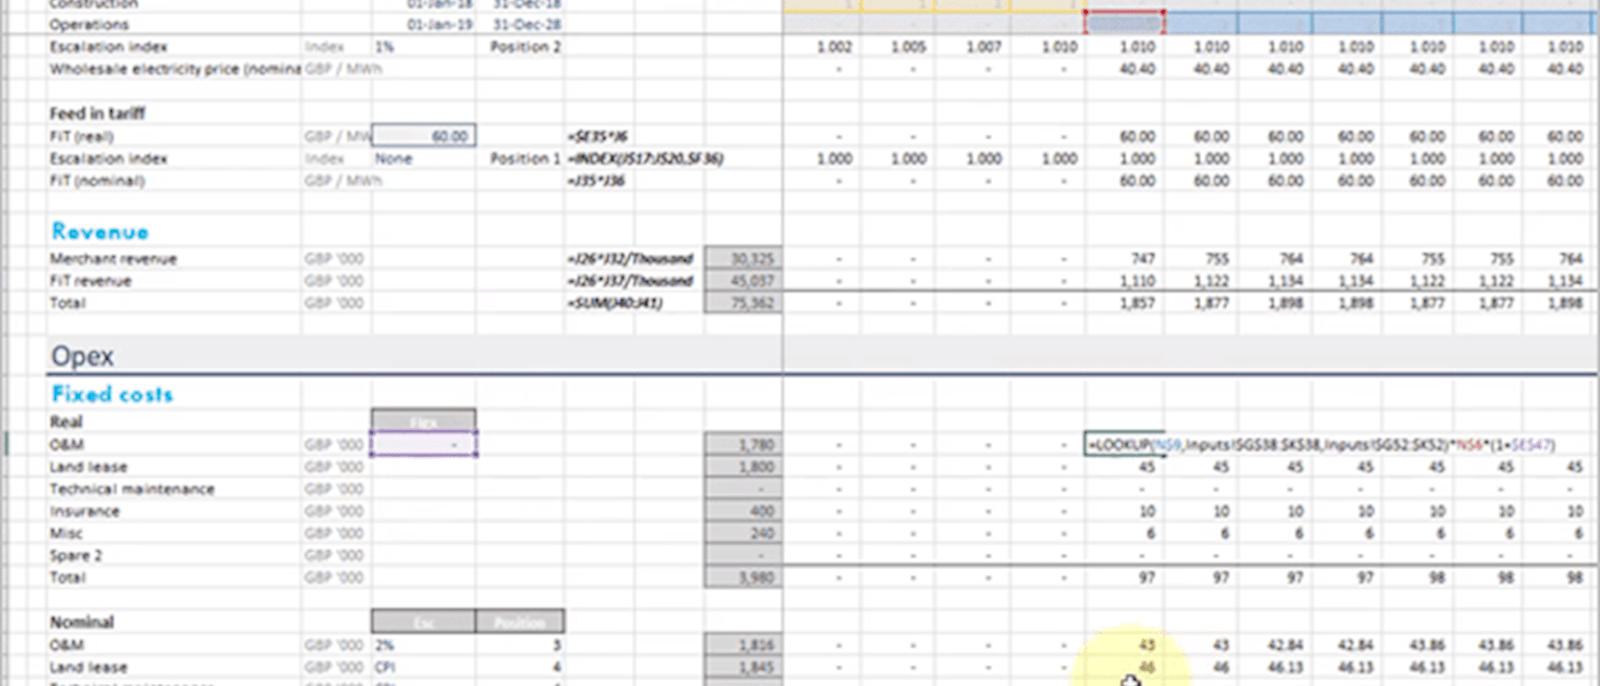
This is a catch all for when calculation steps have been missed, or included when they shouldn’t have been. As an example below, costs have been brought in off the inputs sheet on a per annum basis, but have not been adjusted to account for the model timeline – in this case quarterly. The conversion has been omitted. These will be picked up from eye-balling the number (is the number 4x too high in this case?), or through checking the formula carefully.
Linking: cells & ranges
Mislinking a cell or a range is common. This may have happened because the input range has been modified since the developer originally wrote the formula.
A mis-link may be hard to track by eyeballing – however, software (e.g. OAK, or KuTools) can be used to pick these up (above using BPM Traverse). Alternatively, highlight the range and use F5 >> Enter; or when these are in the same sheet, stepping across the row and pressing F2 can show this visually.
Linking: Sign changes
This refers to when positive or negative signs are swapped. For example, I’ve seen multiple models where expenses are actually represented as an INFLOW to the company (as below). As a friend of mine quipped, “this is a classic returns boosting trick!”.
2. Anchoring
Anchoring is one of the biggest single sources of error in a model - I don’t have data to prove this, but I’ve seen it countless times.
A quick recap: What is anchoring? Anchors are the $ symbols that fix a cell reference in place. By messing up the anchoring, the formula can end up referencing an incorrect range.
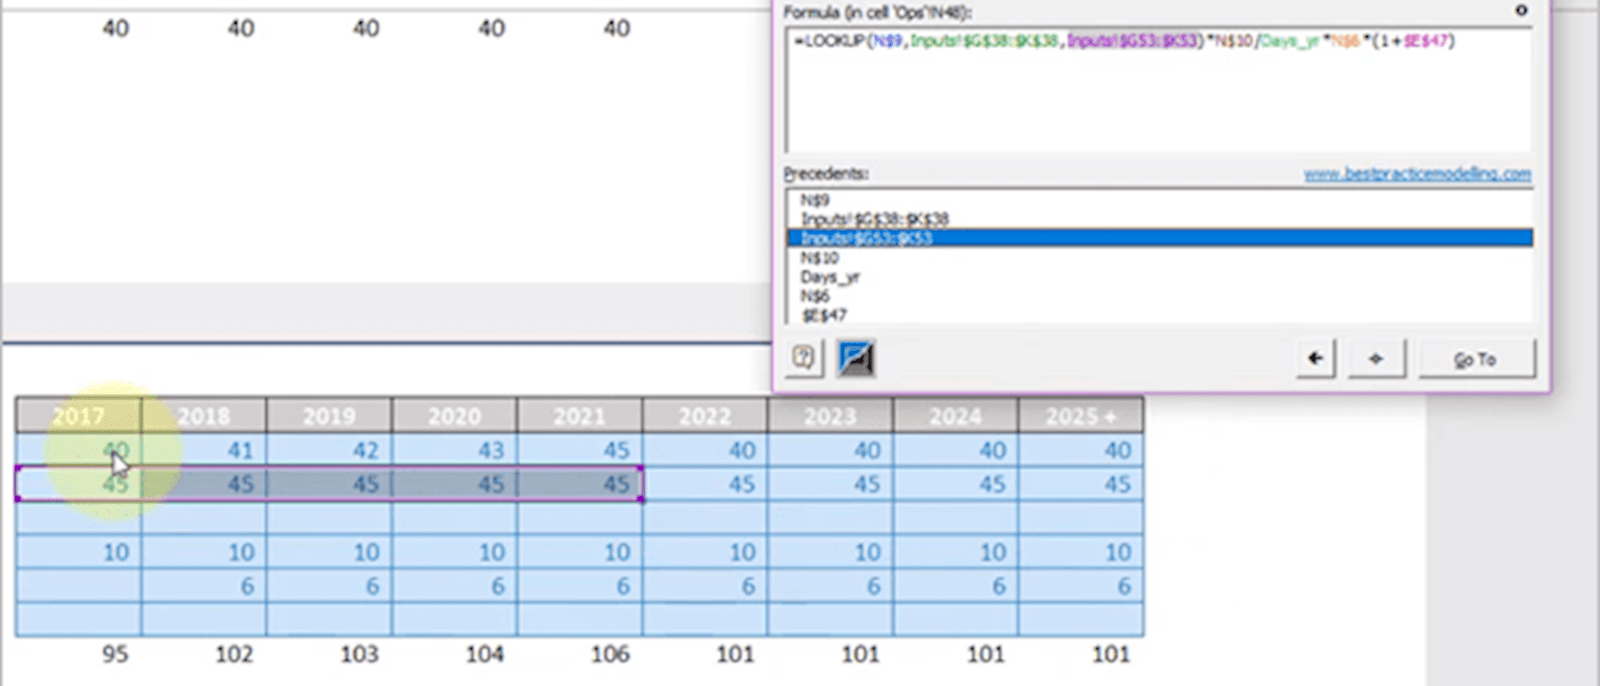
An example of this is below – you’ll notice the purple range is to the right of the intended area. This is similar to mis-linking the range. Software and the use of F5 can help to track these errors.
3. Functions/Formula
Errors are likely to result from a general misunderstanding of how each formula should be used. These are unique to each formula and here we’ll cover some of the most common.
LOOKUP
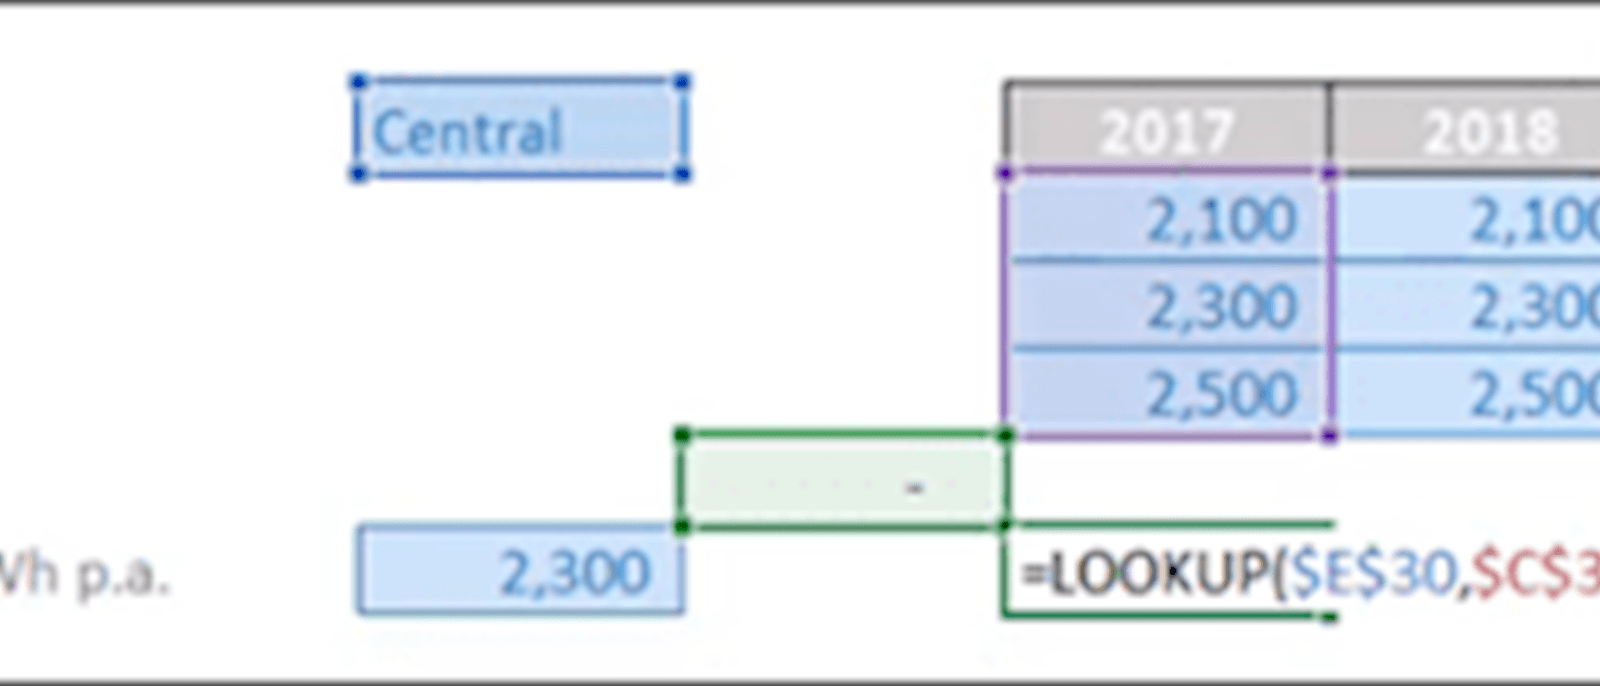
A LOOKUP however requires sequential data, thus may produce an incorrect result if the lookup vector (the red box in the example below) isn’t in sequence.
This is the case in the example below, where the lookup vector data is out of alphabetical order (“C” for central comes before “L” for low in the alphabet). The way the LOOKUP works is that it will incorrectly give the result for the “Low” range, rather than the “Central” range.
Therefore make sure LOOKUPS are only used on sequential data, safest if they’re used where you’re looking up data over a timeline.
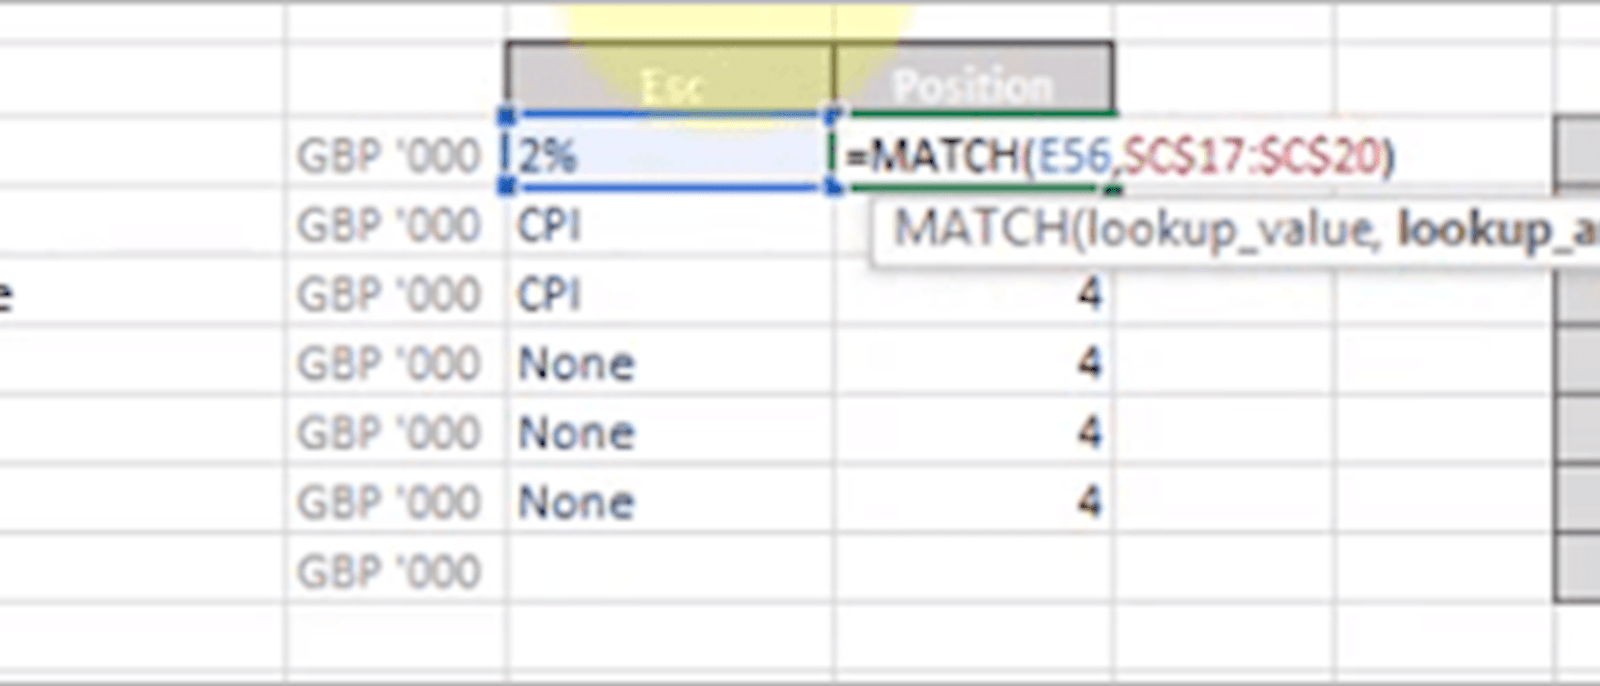
MATCH
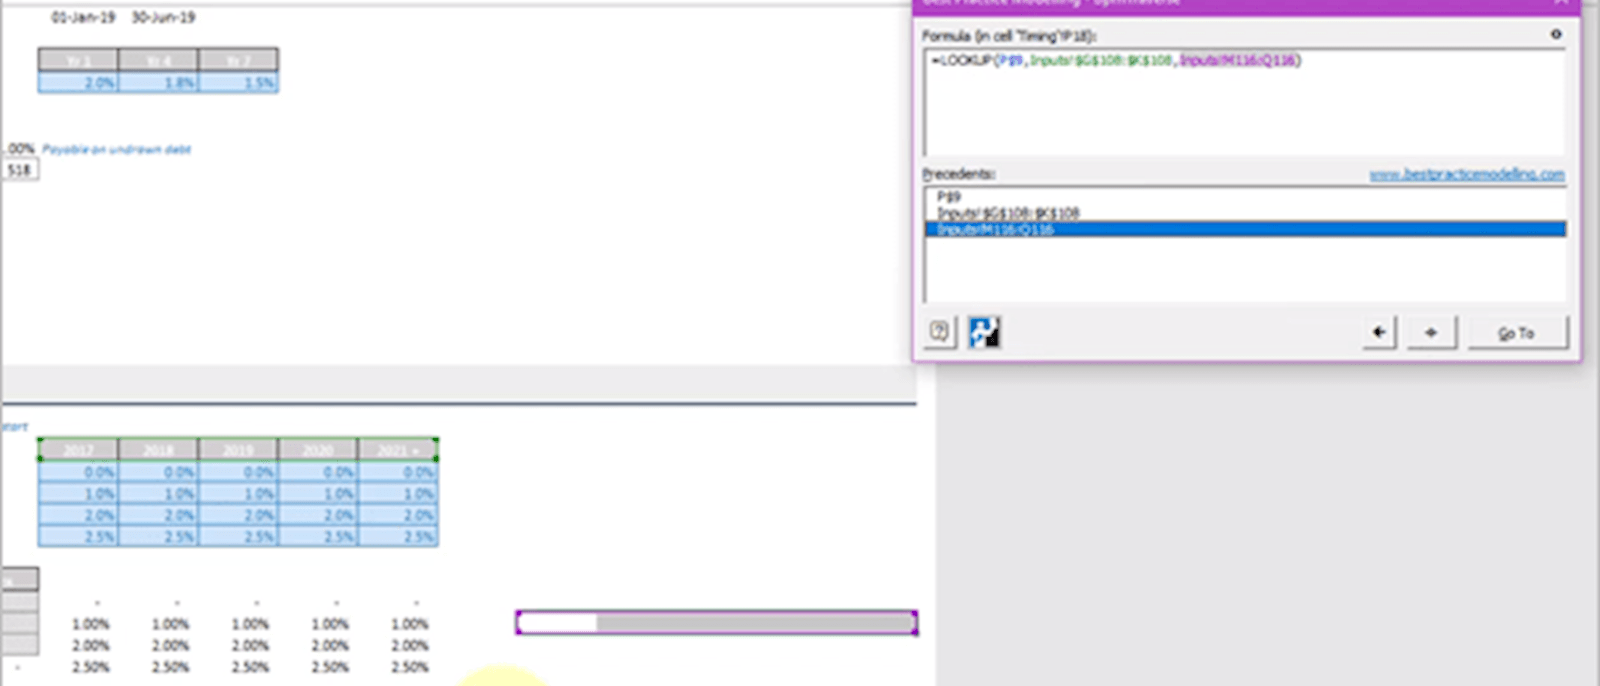
To give an example of a similar error, a MATCH should ideally have the type specified. Below, it should be specified as an “Exact” match, e.g. a 0. Without a match type entered, the formula would again pick up the wrong range – as the escalation choices in the “lookup_array” are not necessarily in sequence.
Formulas to avoid / use sparingly
There are also formulas which should be used sparingly. I’ve written about some of these before so I’ll give the “too long; didn’t read” version here:
- VLOOKUP/HLOOKUP: lack robustness as they require a hardcode or a MATCH embedded, lack transparency and are slow because they require an entire range specification rather than a LOOKUP which just requires an output range
- IFERROR: masks ALL errors – it is much more robust to only mask the error one is expecting, e.g. using an IF statement for avoiding DIV/0 errors.
- OFFSET: slows the model down and can’t be accurately traced using trace dependents.
When to review and when to correct errors
If you’re building a model, it’s a good idea to check for errors frequently. I recommend to my students either every row they build, or every section they build (just built the “price” section of a model and ready to calculate the total revenue? Check your work.).
If you’re reviewing someone else’s model, or doing a final review on your own model – you’ll be reviewing the entire model likely in one or two sittings. I recommend tracking and fixing errors as you find them– you’re more likely to spot the next error with one less existing error in the model.
Bringing it all together
There is no foolproof method of removing all errors from a model, however, triaging your model review can help to reduce the biggest errors in the shortest space of time. The method outlined above helps to hone-in where these error sources occur, at which point you’ll hopefully be able to pinpoint the error through careful scrutiny of the formula.
To get more examples of errors, and cover five areas of review, take a look at the “Spreadsheet Review Publication” which has been compiled by a team of experts closely involved in financial model auditing and review functions. I have also put together a video based course which goes through the method and demonstrates on multiple case studies how to reduce errors in a model. Good luck!
Excel community
This article is brought to you by the Excel Community where you can find additional extended articles and webinar recordings on a variety of Excel related topics. In addition to live training events, Excel Community members have access to a full suite of online training modules from Excel with Business.

- Intro to Financial Modelling - Part 19: Wrap-up
- Intro to Financial Modelling - Part 18: Sensitivities and Scenarios
- Intro to Financial Modelling - Part 17: Calculation Techniques - Loan Calculations
- Intro to Financial Modelling - Part 16: Calculation Techniques - Flags and Masks
- Intro to Financial Modelling - Part 15: Error reduction - Common pitfalls
Archive and Knowledge Base
This archive of Excel Community content from the ION platform will allow you to read the content of the articles but the functionality on the pages is limited. The ION search box, tags and navigation buttons on the archived pages will not work. Pages will load more slowly than a live website. You may be able to follow links to other articles but if this does not work, please return to the archive search. You can also search our Knowledge Base for access to all articles, new and archived, organised by topic.
