Hello and welcome to the continuing series from the Excel Community's Financial Modelling committee, in which we will work through the chapters of our Financial Modelling Code and explain how each element translates into practice.
You can read the Code here or watch our free webinar about it.
Following on from our previous blog on Clarity – Use of Formatting, we continue with our series on building and structuring Excel models that align to the ICAEW’s Financial Modelling Code (FMC), looking again at the general theme of clarity. The application of clear labelling and explanations to models can often be overlooked as modellers focus on its functionality, assumptions, calculations and accuracy of outputs. This article focuses on the fundamental aspects of adding labelling and explanations to Excel models and examples of how this can be achieved to ensure model risks are managed.
Why is it important to have clear labelling and assumptions in models?
Outlined below are some key reasons why models should have clear labelling and explanations incorporated within them:
- They reduce the dependency on the individual author’s knowledge regarding the operation of a given model.
- Clear labelling and explanations in a model helps ensure the model is understood, interpreted and operated correctly.
- Accurate and up-to-date documentation supports control over models and allows for knowledge transfer between users.
- Clarity reduces the potential for inaccurate reporting and/or inappropriate decision making based on a misunderstanding of numerical data or implicit model functionality.
I often get asked what the appropriate measures are for adding labelling and explanations within a model. From my experience, there are three key areas where the application of labelling and explanations should be applied. These are summarised in the diagram below:
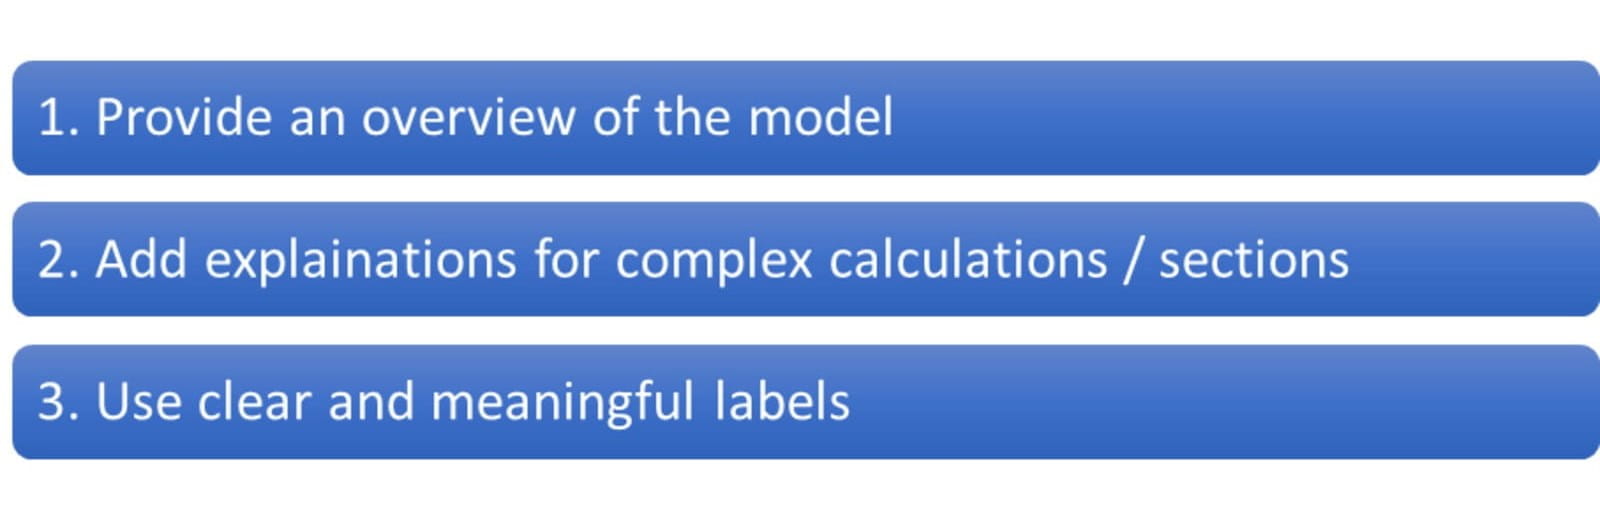
Suffice to say, although such additions to a model do not enhance its performance, they do provide clarity and transparency to its operation.
Model Overview
In my opinion, a key component of any model is to have instructions / explanations within the model so that users can understand the purpose of the model and any basic information relating to the model and its operation. For example, this can include:
- The purpose and description of how the model is used in the context of the broader Financial, Operational or External Reporting context.
- Step by step description of how the model is operated.
- Assumptions made within the model.
- Description of areas where additional care must be applied. This includes, inter alia: macros, completeness of upload/ download/ v-lookup, data format requirements, all cells containing formulas which must be validated when adding or deleting lines, etc.
- Access and segregation of duties controls. Explain measures taken to ensure inappropriate access is not gained to the spreadsheet.
- Summary of controls applied by the operator of the application to verify the integrity of the processing and output.
- Notation of any archiving or version control requirements.
- Description of how business logic is validated.
The model overview can be included within the model as a separate worksheet, or alternatively, could be a separate document which is referenced/linked to the model.
Explanations for complex calculations / sections
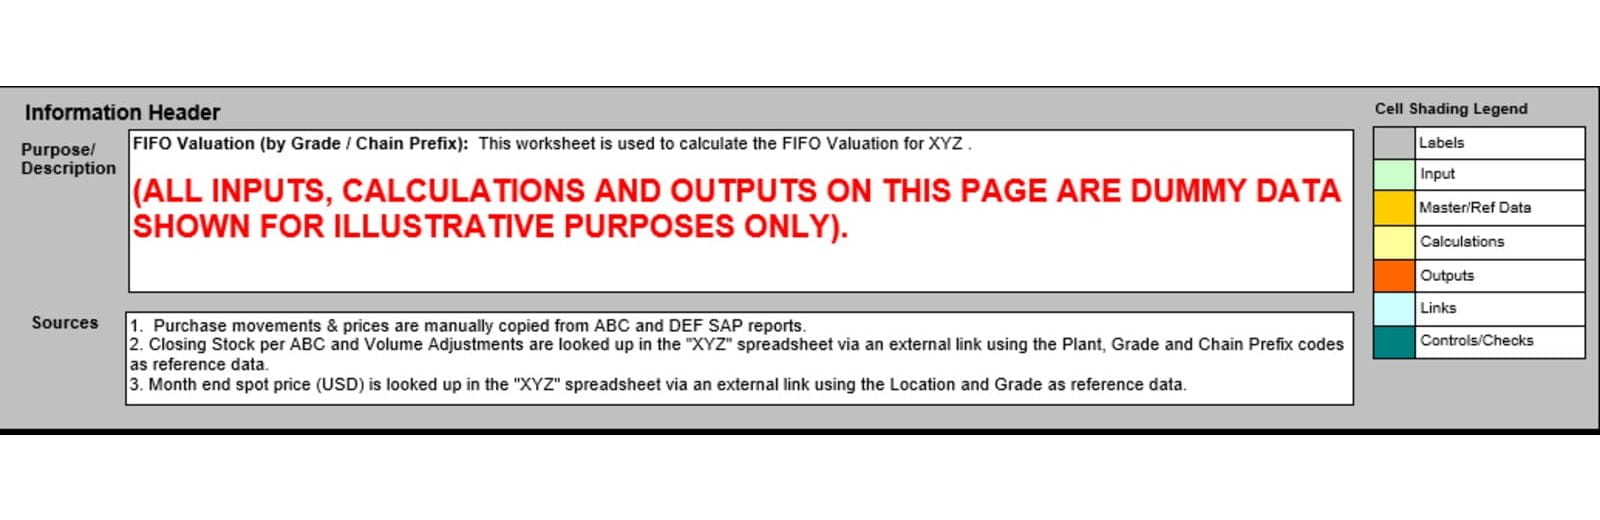
A complementary addition to the model overview is the inclusion of information headers that contain explanations for complex sections of a model. The information header can be placed at the top of each worksheet and can include information explaining the purpose of the worksheet, units of measure used, source(s) of data, assumptions made and cell shading information (see example below).
By placing information headers at the top of relevant worksheets, complex information within the worksheet can be explained to users without the need to jump around the model – thus keeping the use and navigation of the model simpler. This is particularly so where used in conjunction with frozen panes (see below).
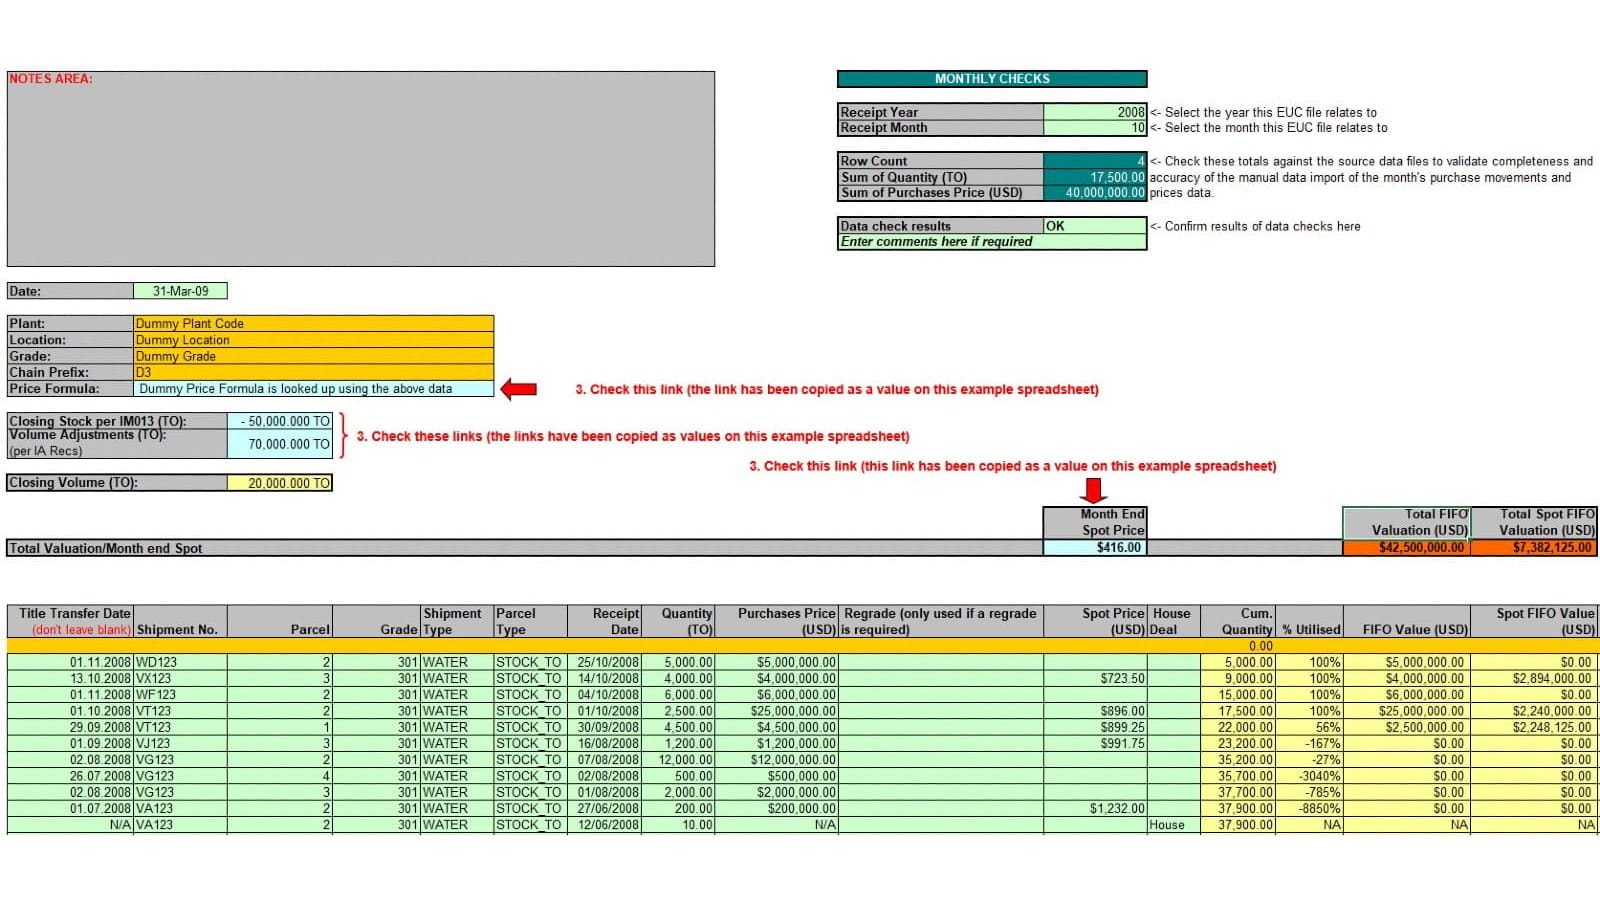
Another option is to include explanations within the cell’s embedded notes/comments or have explanations next to key cells (see diagram below). These ensure that users are drawn to these areas and the information provided is associated with specific cells – avoiding ambiguous cell referencing.
Now, let us be clear
Fundamental to any good model design is to ensure that clear and meaningful labels have been applied throughout the model. Labels are essential to ensure the end user’s understanding of what is presented, and should be applied to all data, calculations and outputs. With this in mind, clear and meaningful means that non-modellers and non-technical users can understand the content. Use simple plain English for labels, notes and explanations to avoid misinterpretation. Where possible, avoid the use of Excel words to avoid confusion.
The guidance from the Financial Modelling Code recommends that:
1. All data, calculations and outputs are labelled visibly, with the labels placed nearby.
2. Label each row to the left in a frozen pane that remains visible as the user scrolls around the workbook. (e.g. Excel option --> View --> Freeze Pane)
3. Use a ‘tree’ to structure multiple label layers, with subsequent columns used for each layer.
4. Maintain a balance between label length and precision.
The diagram below illustrates how labelling can be applied within worksheets to provide clarity and ease of use in a model following the FMC.
Users should also ensure that it is not just the cells and tables that labelling should be applied to. The model’s charts, graphs and worksheets should also be labelled using simple and understandable titles to help users understand and navigate between worksheets and analyse formulas that contain cross-sheet references (see examples below).
Chart labelling – use simple and clear labelling describing the chart
1. Users should include a meaningful title describing what the chart / graph is showing in plain English to prevent misinterpretations.
2. The inclusion of a legend to show what information is being presented should be included
3. Where appropriate, include units of measure to be clear what metrics are being displayed.
Labelling of worksheets – be specific on what information each worksheet contains
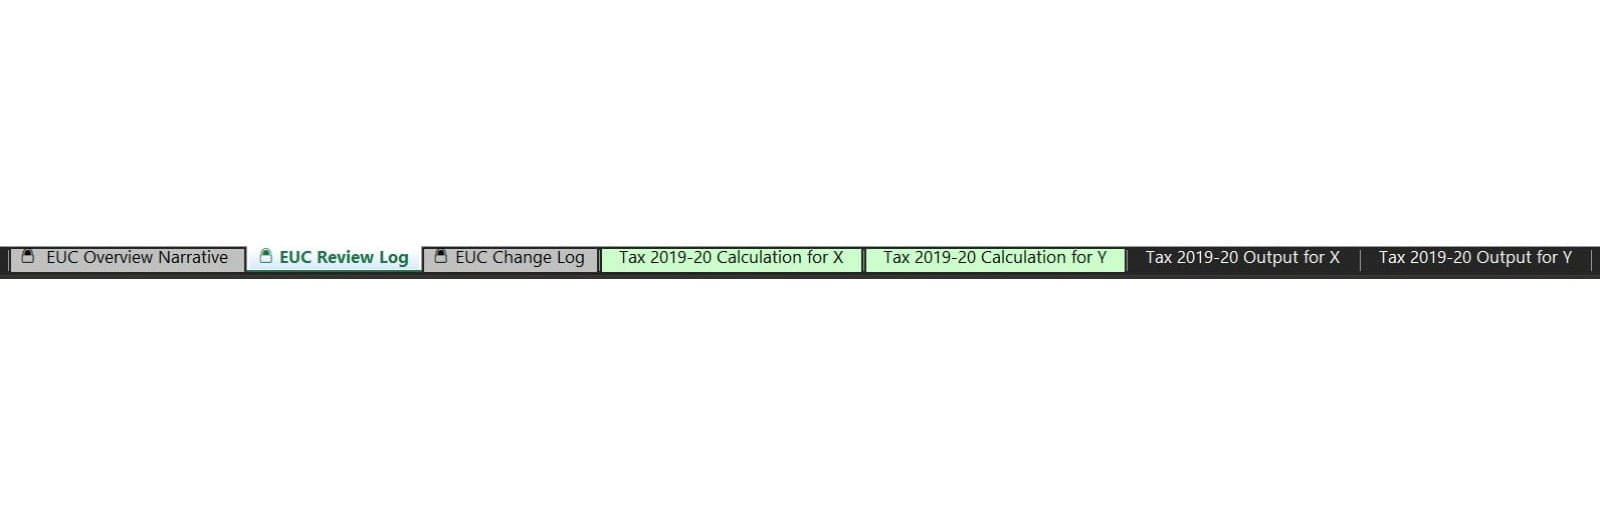
4. Users should try and avoid using non-descriptive names like Sheet1, Sheet2, output1, putput2, etc. and instead, use clear and concise names.
5. Where a worksheet’s name description is too long, consider using abbreviated names with a clear explanation in an obvious location within the model.
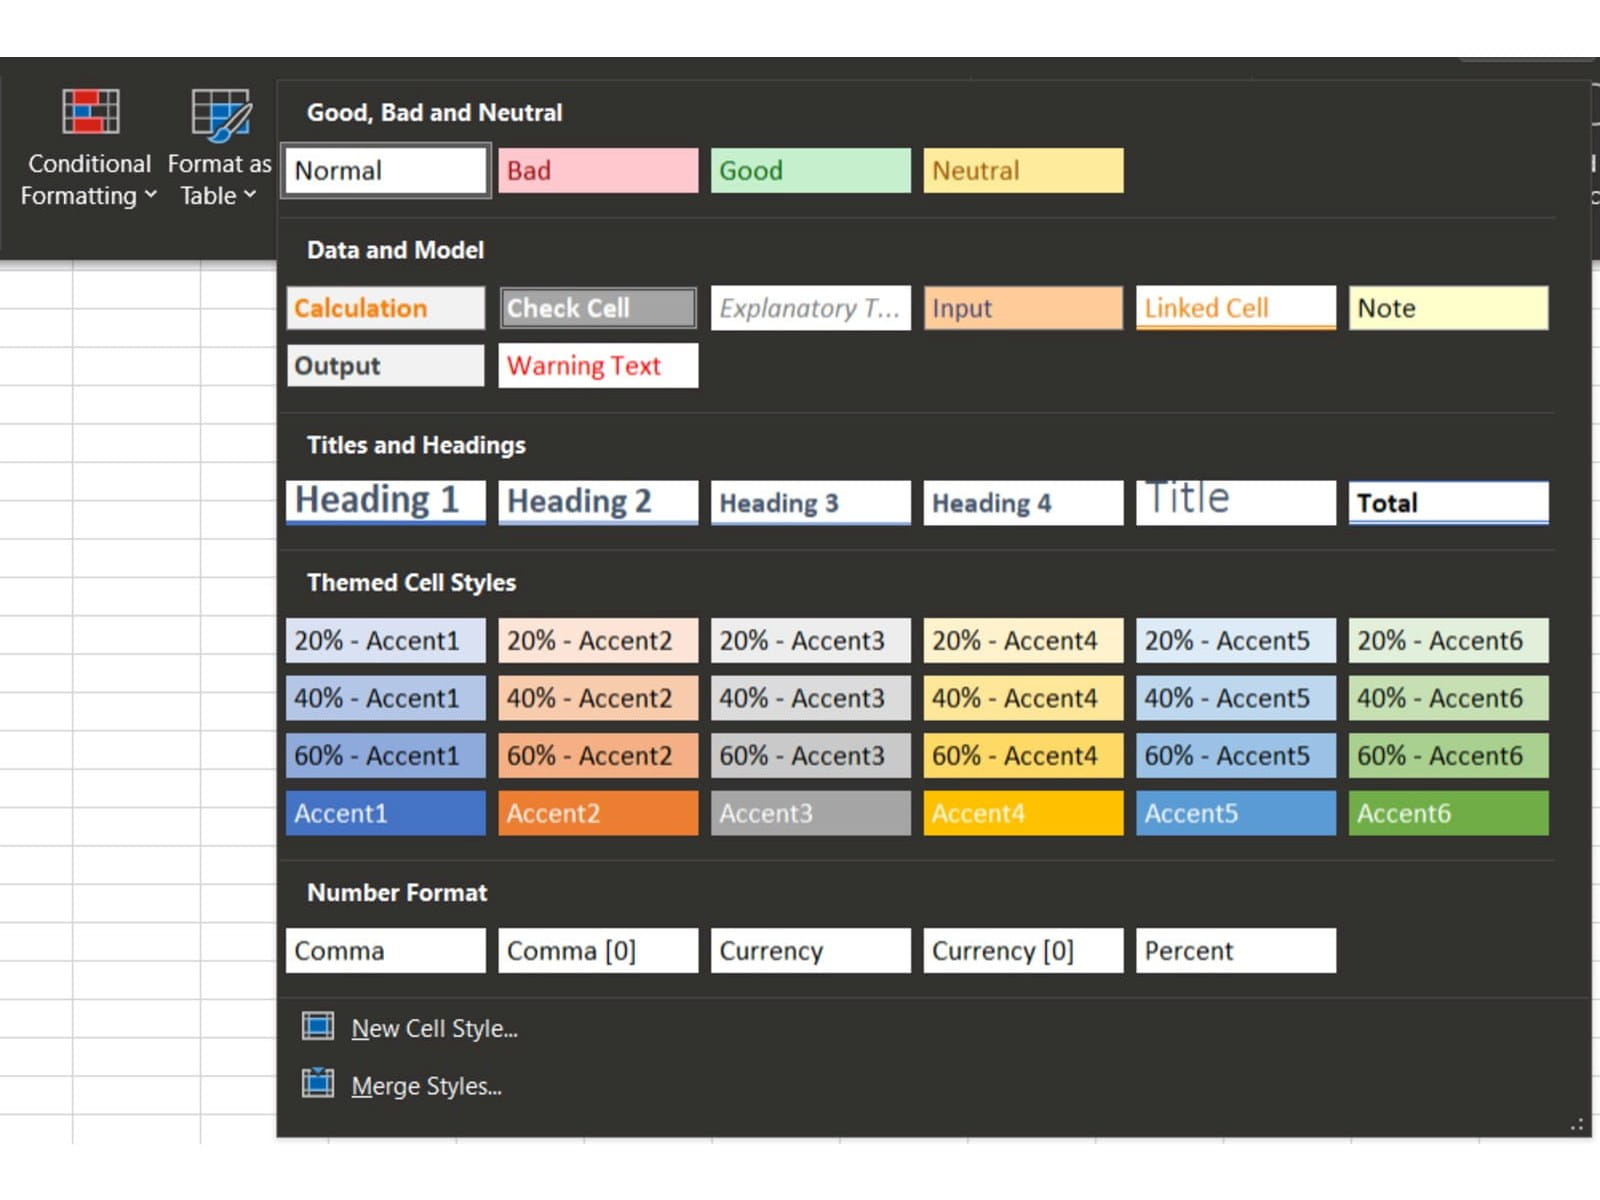
6. Also consider colour coding or labelling worksheets according to their functional purpose in the model or business unit. Colour coding for inputs, calculations, outputs, can be defined by using Excel’s cell Style options (see below) or an organisation’s colour scheme.
The combination of increased transparency, improved operational efficiency and management of model risks are compelling arguments why models should have clear labelling and explanations applied and included by default. Modellers also need to consider the users who will be running the models and those referencing the model for reporting purposes. It is therefore especially important that clear labelling and explanations are used throughout the model to guide users. Prioritising clarity of labelling and adding explanations can help avoid confusion and keep the model as unambiguous as possible, which reduces the risk of error.
Excel community
This article is brought to you by the Excel Community where you can find additional extended articles and webinar recordings on a variety of Excel related topics. In addition to live training events, Excel Community members have access to a full suite of online training modules from Excel with Business.

- Intro to Financial Modelling - Part 19: Wrap-up
- Intro to Financial Modelling - Part 18: Sensitivities and Scenarios
- Intro to Financial Modelling - Part 17: Calculation Techniques - Loan Calculations
- Intro to Financial Modelling - Part 16: Calculation Techniques - Flags and Masks
- Intro to Financial Modelling - Part 15: Error reduction - Common pitfalls
Archive and Knowledge Base
This archive of Excel Community content from the ION platform will allow you to read the content of the articles but the functionality on the pages is limited. The ION search box, tags and navigation buttons on the archived pages will not work. Pages will load more slowly than a live website. You may be able to follow links to other articles but if this does not work, please return to the archive search. You can also search our Knowledge Base for access to all articles, new and archived, organised by topic.
