
A few months ago, a new Excel function was made available to those on the 'Office 365 Insiders' update channel. Depending on your chosen update channel, you might not yet have access to this function, but it should arrive in your version at some point.
A few months ago, a new Excel function was made available to those on the 'Office 365 Insiders' update channel. Depending on your chosen update channel, you might not yet have access to this function, but it should arrive in your version at some point.
This is intended as a demonstration of the capabilities of the new function only and you should check all results carefully before placing any reliance on them and also read any disclaimers. Microsoft explicitly advise that the function is not for use by 'financial industry professionals'.
The STOCKHISTORY() function allows you to specify a stock using its stock market abbreviation and then to extract information about the share price and trading volume on a set of dates. The relevant values are returned as a dynamic array.
Before we start experimenting with the function itself, we will use Power Query to make available a list of FTSE 100 shares, with their stock exchange abbreviations, which we can then use as the source of a Data Validation dropdown list for one of our function arguments.
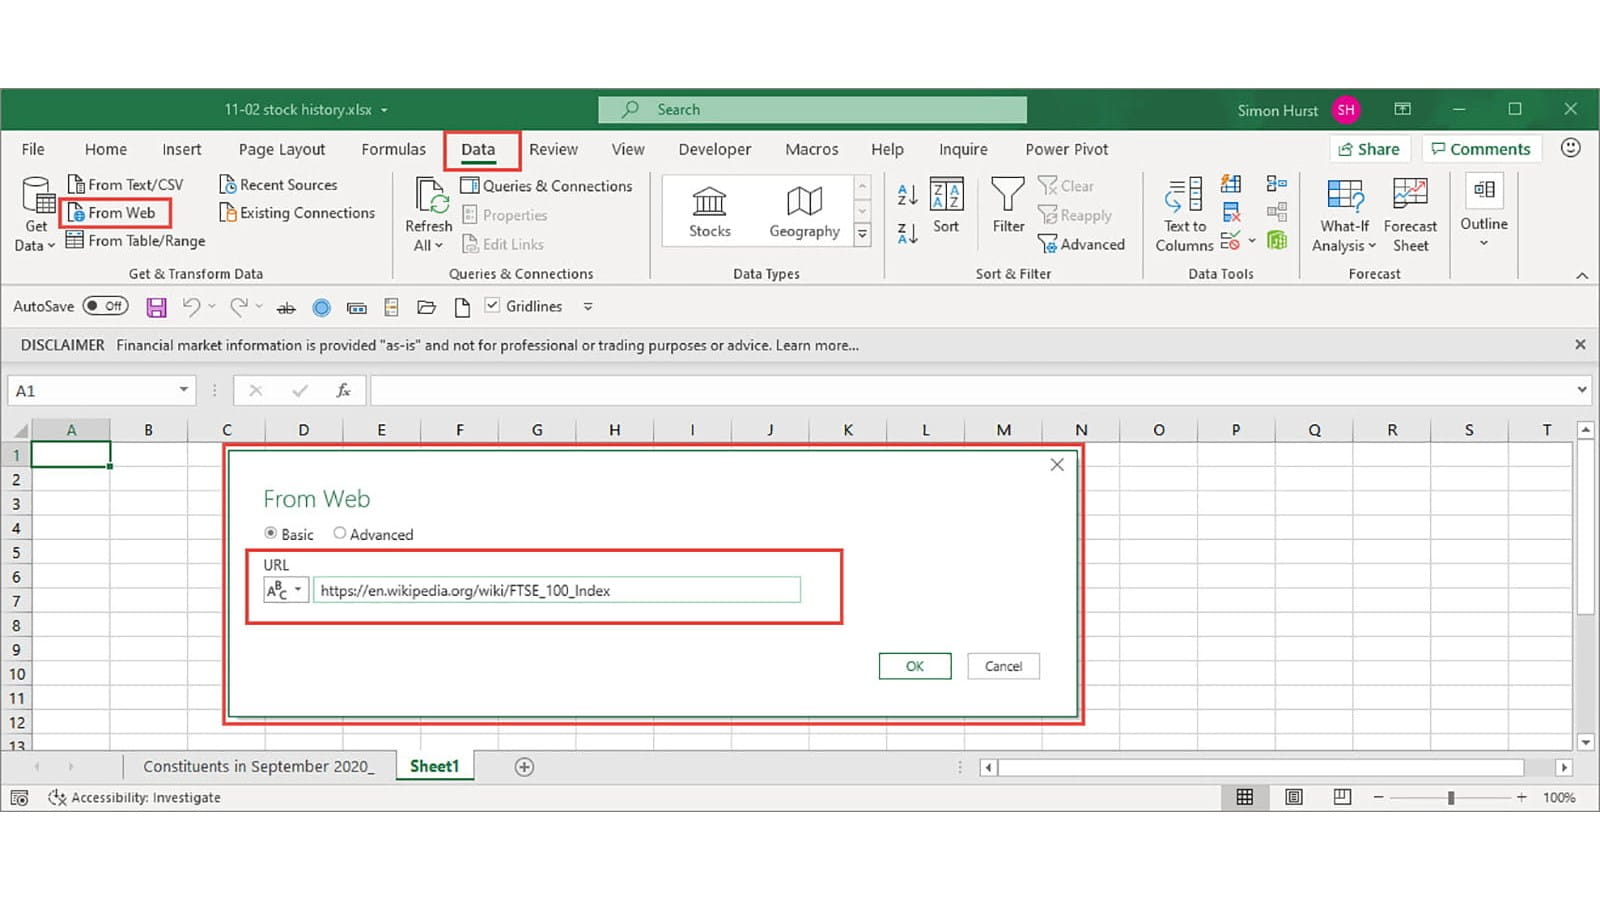
Wikipedia includes a full list of the FTSE 100 shares in a single table, so we will use the appropriate URL to feed into the Data Ribbon tab, Get & Transform Data, From Web option:
https://en.wikipedia.org/wiki/FTSE_100_Index
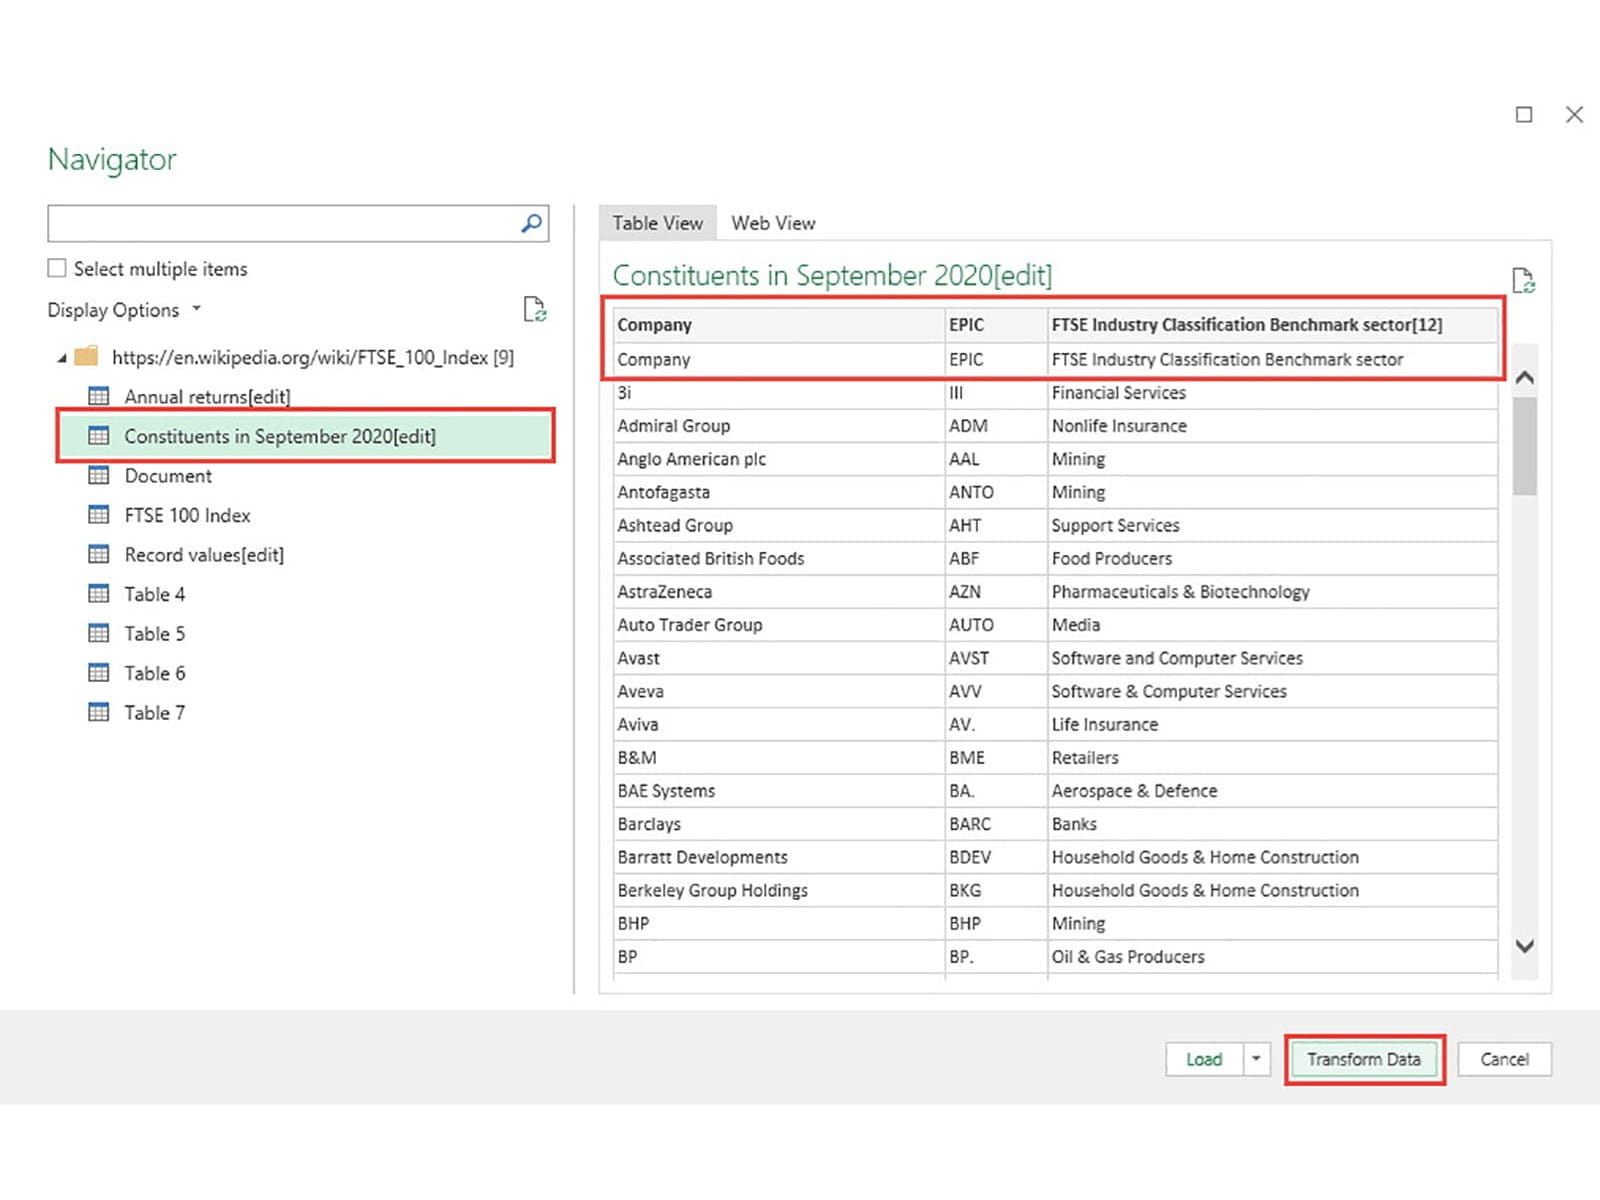
You might need to be patient because, on my computer at least, Excel took a minute or so to retrieve the relevant details from the Wikipedia page. Eventually, the Navigator window should display the tables available on the web page and it is the 'Constituents…' table that we will select. As can be seen in the Preview pane, the table includes headings in both the header row and the first row beneath it. In order to remove the redundant headings, we will click on the Transform Data button:
This allows us to use the Power Query editor to remove our extra row before we load the resulting table into our Excel worksheet. Had the table already been in the correct format, we could have just used the Load button from the Navigator window to load the data to our worksheet directly.
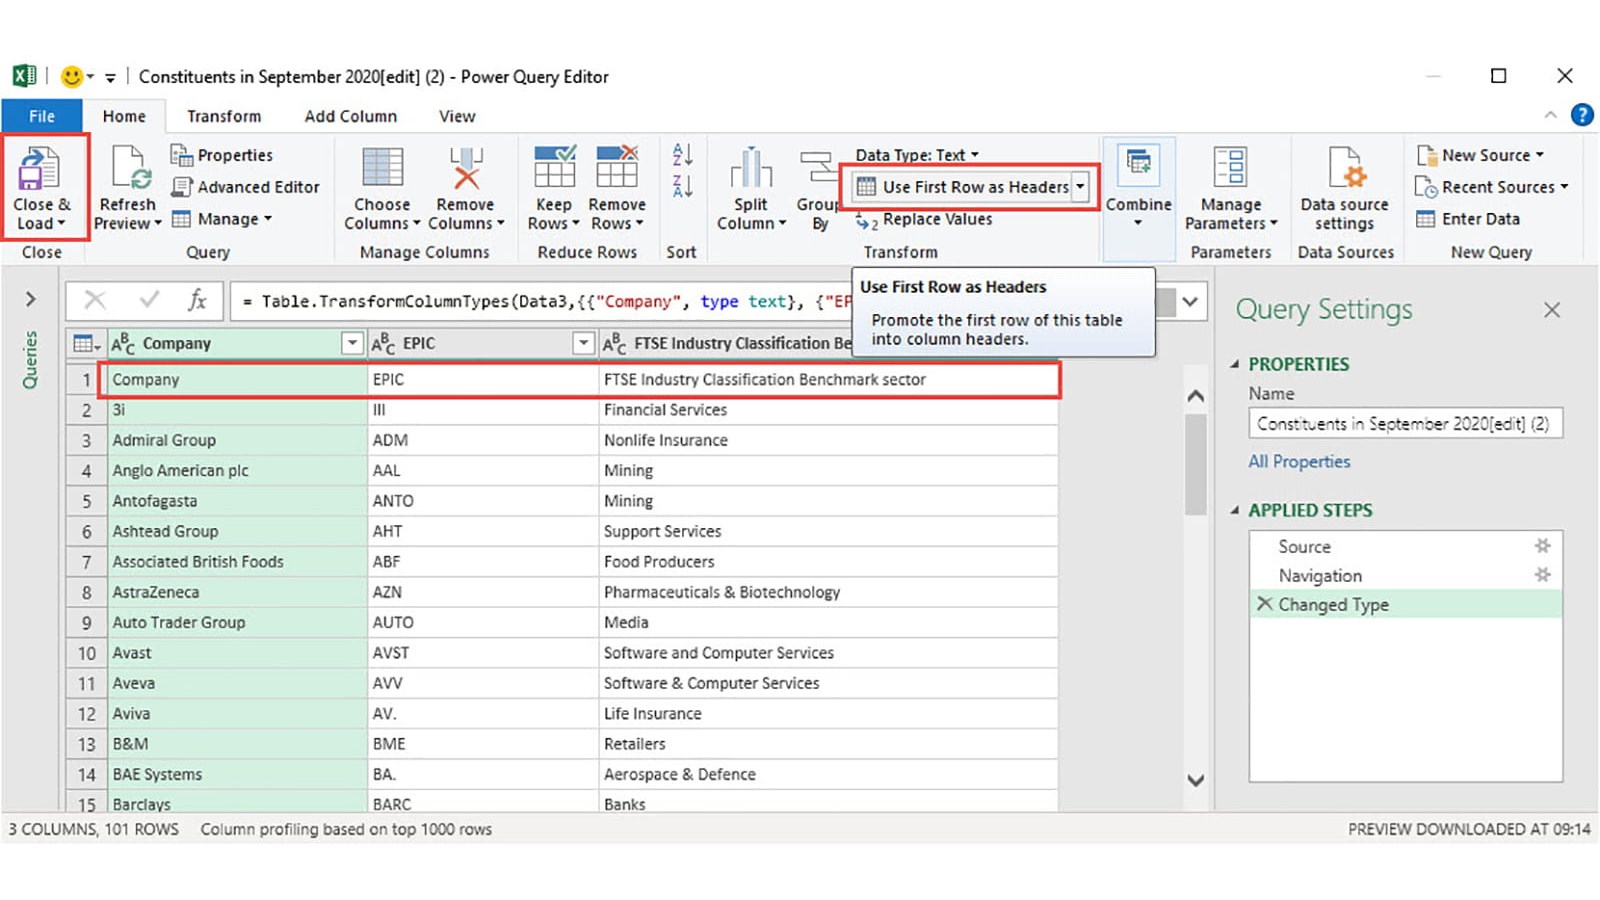
Here is our data in Power Query. We could use the Remove Rows option in the Reduce Rows group of the Home Ribbon tab or, because the first row is the same as our headers row, we could also use the 'Use First Row as Headers' option in the Transform group:
When our headers are correct and our table just contains the 100 rows of data, we can use the Close & Load button to load it into our Excel worksheet. We want to use the Company column as the basis of our Data Validation dropdown but, because a Data Validation list source can't use a direct reference to a Table column, we will allocate the Range Name 'FTSEShares' to the entire column by selecting all the data rows in the column and then typing the name, without spaces, into the Name Box to the left of the formula bar and pressing Enter:
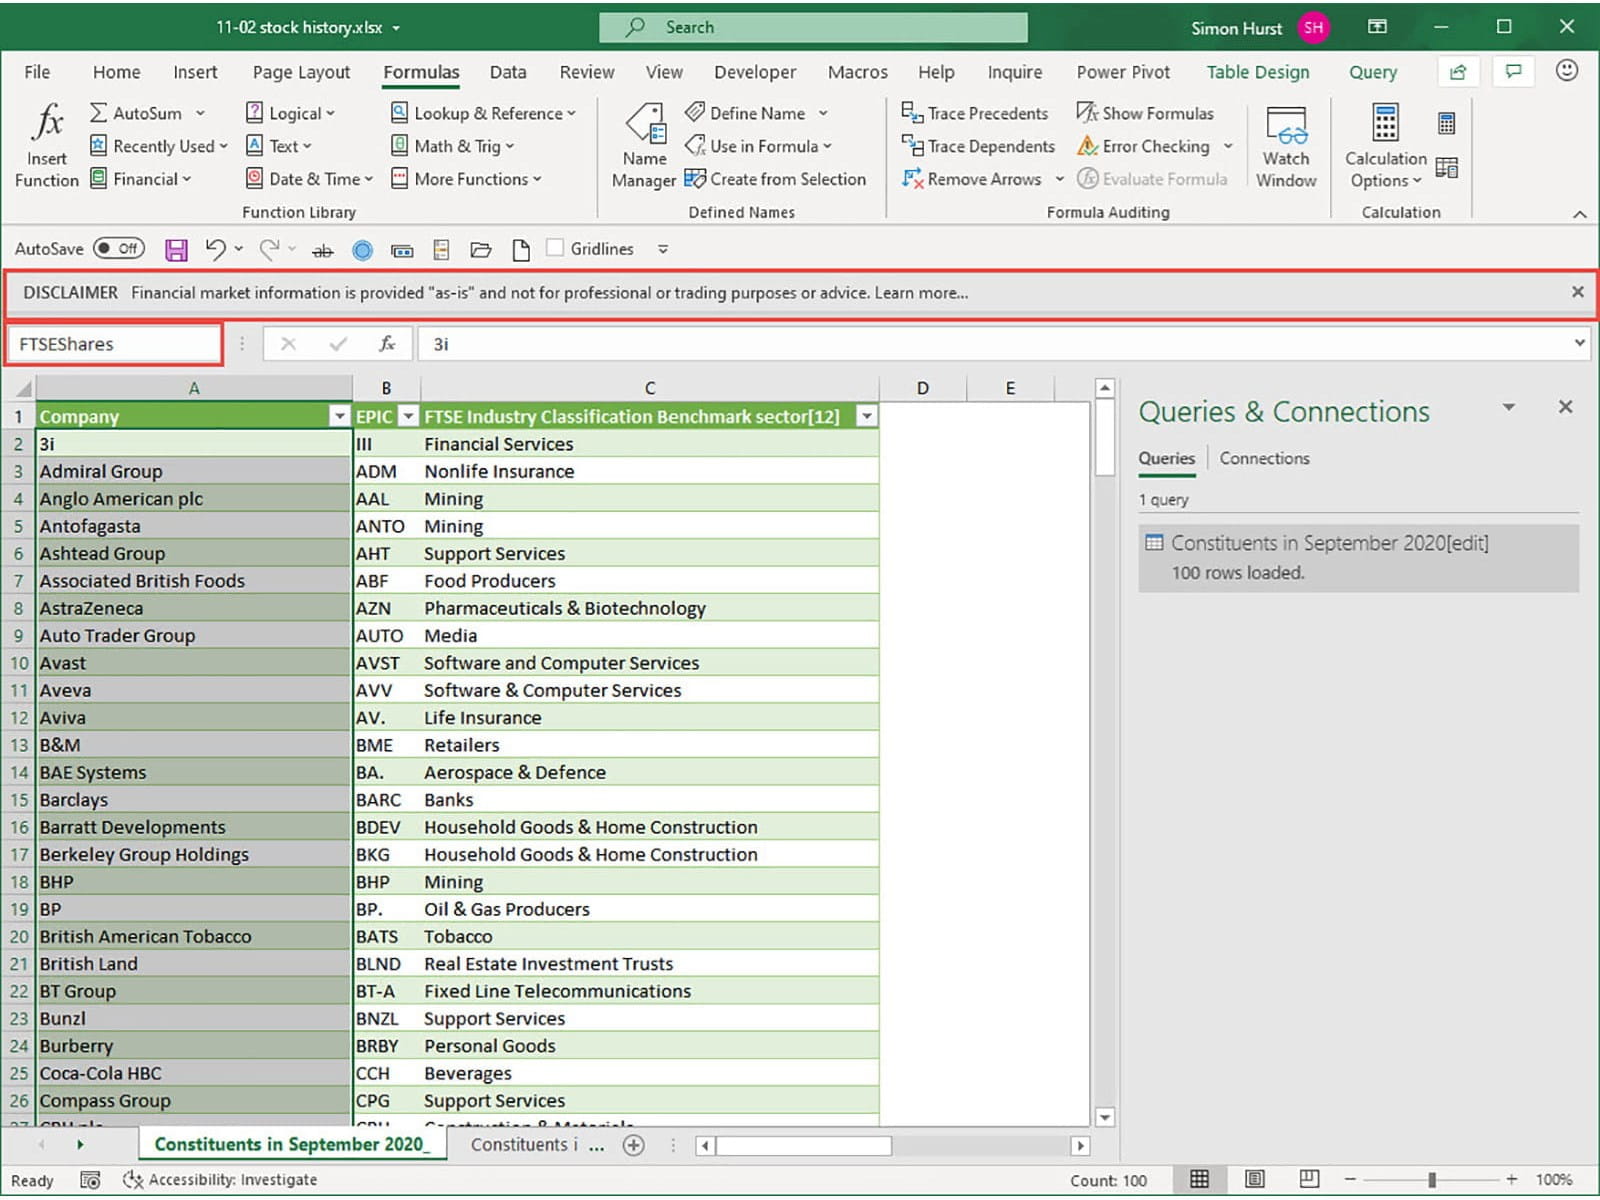
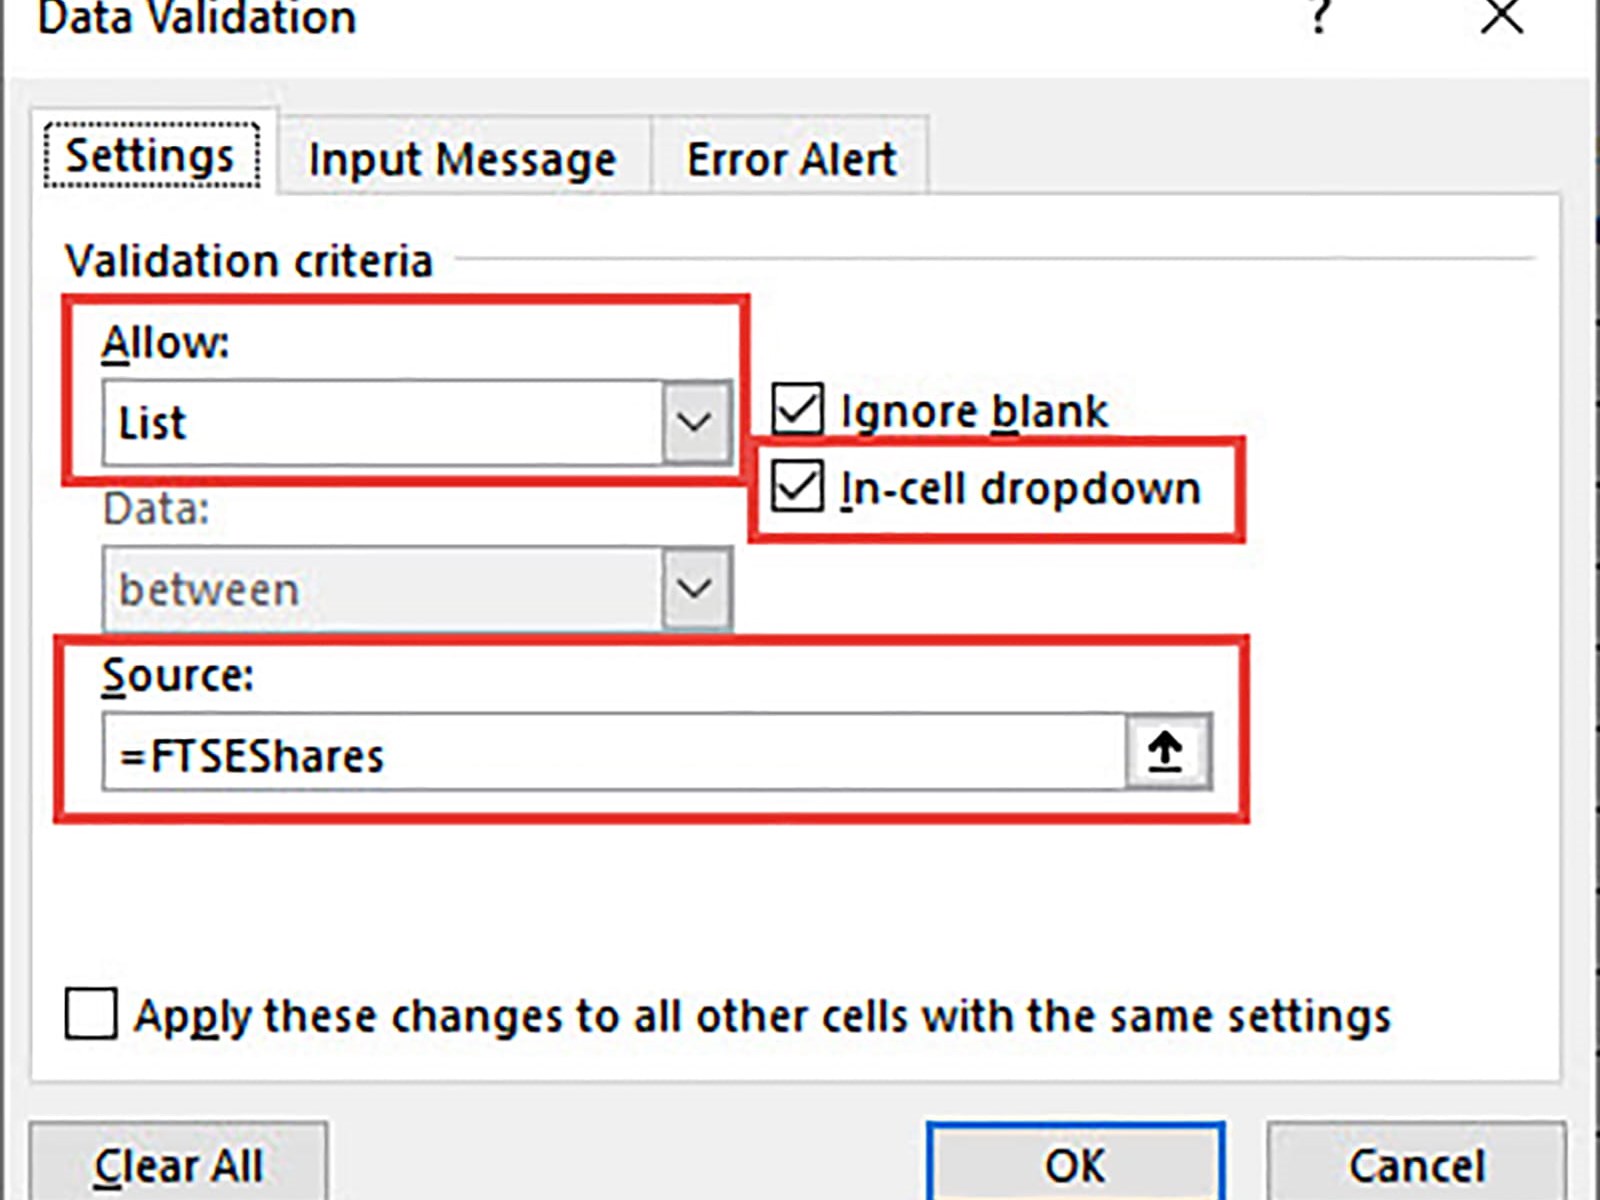
This will allow us to use the Range Name as our list source so that, if more shares are added to the FTSE 100 list (!), the Data Validation dropdown list will automatically adjust accordingly:
Our Data Validation dropdown allows us to select from the Company column but it is the EPIC code that we need for our STOCKHISTORY() function. Accordingly, we need to use our Data Validation value to lookup the EPIC column value in the same row. We could use VLOOKUP(), but if compatibility isn't an issue, we can use the newer, and vastly better, XLOOKUP() as a replacement. Our lookup formula will use structured Table language to refer to our Table columns, so it might be worthwhile changing the name of our query from the rather verbose 'Constituents_in_September_2020_edit' to something more concise such as 'FTSEList'. This makes our formula:
=XLOOKUP(L2,FTSEList[Company],FTSEList[EPIC],"Not found")
We have used the first four arguments of XLOOKUP(). The first argument is a reference to our Data Validation cell that returns the Company name, the second argument refers to the Table column that we want to compare our Company name against, and the third argument the name of the Table column from which to return our EPIC code from the matched row. Finally, we can specify the text that will appear if no match is found. Unlike VLOOKUP(), the default match mode for XLOOKUP() is an exact lookup, so we don't need to use the fifth argument to specify this.
The STOCKHISTORY() function allows us to enter the stock code, a start date, an end date and an interval to extract the values between the start and end date for each day (0), week (1) or month (2). There are additional arguments available to specify how to display headers and which properties to return as part of our dynamic array. We can choose as many properties as we like from:
- Date
- Close
- Open
- High
- Low
- Volume
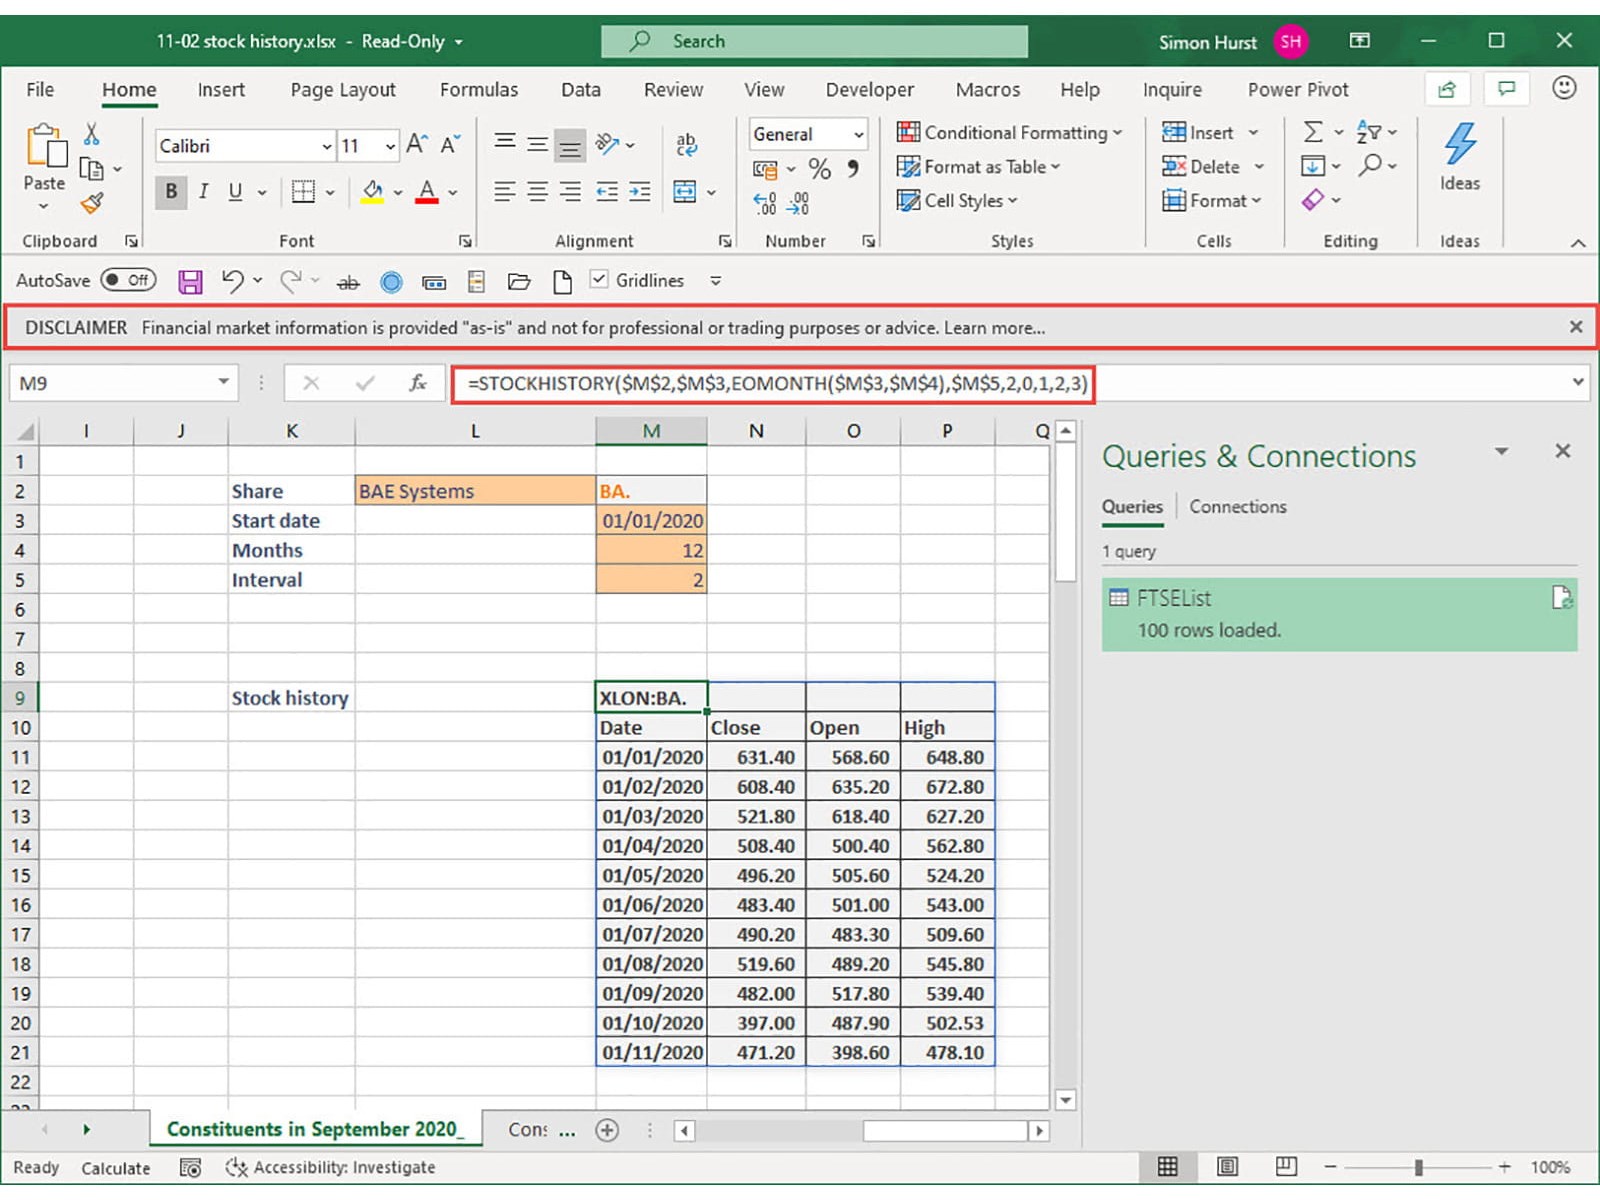
In our example, we have set up input cells for the Start date, the number of months to be used to calculate the end date, using the Excel EOMONTH() function, and then our chosen interval. The STOCKHISTORY() function entered in cell M9 also uses the parameter value 2 to specify that we should use as our headers 'Show instrument identifier and header'. Finally, the last four, property, arguments specify that our function should return the first four properties: Date, Close, Open and High:
=STOCKHISTORY($M$2,$M$3,EOMONTH($M$3,$M$4),$M$5,2,0,1,2,3)
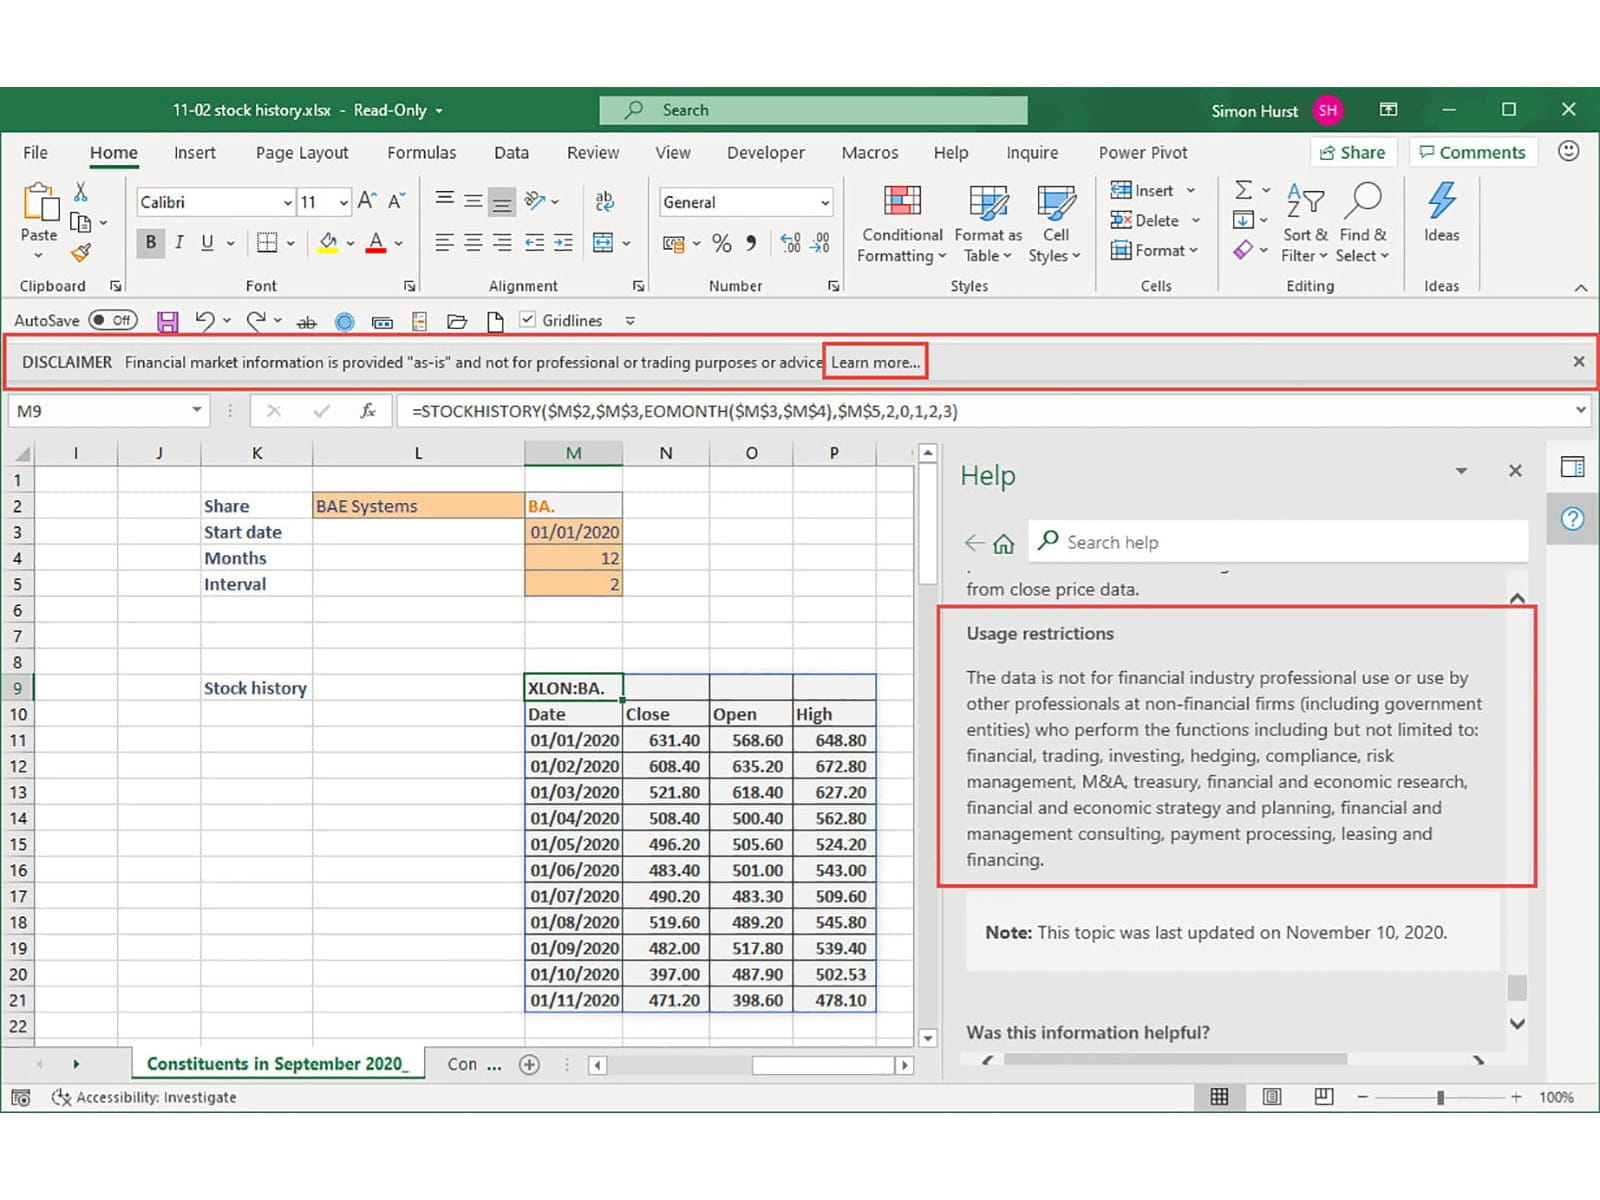
Note also the disclaimer above the formula bar. The 'Learn more…' link provides further details on the suggested use of the function and limitations:
- New tech features for Mar-May 2026: Excel, Teams, Google Sheets, Chat GPT, M365, Power BI, Canva, Claude, Zoom ++
- New tech features for Dec-Feb 2026: Excel, Teams, Google Sheets, Chat GPT, M365, Power BI, Canva, Zoom ++
- New tech features for Sep-Nov 2025: Excel, Teams, Google Sheets, Chat GPT, M365, Power BI, Canva, Zoom ++
- Excel, Teams, Google Sheets, Chat GPT, M365, Power BI, Canva, Zoom ++: New tech features for June-Sept 2025
- Excel, Teams, Google Sheets, Chat GPT, M365, Power BI, Canva, Zoom ++: New tech features for Mar-May 2025
Excel community
This article is brought to you by the Excel Community where you can find additional extended articles and webinar recordings on a variety of Excel related topics. In addition to live training events, Excel Community members have access to a full suite of online training modules from Excel with Business.


