The news that South Korea, to align with most of the rest of the world, is cutting the age of its citizens by a year or two – it used to deem a baby one year old at birth, and add a year on 1 January – prompted us to take a look at this peninsula nation and its amazing economic success story.
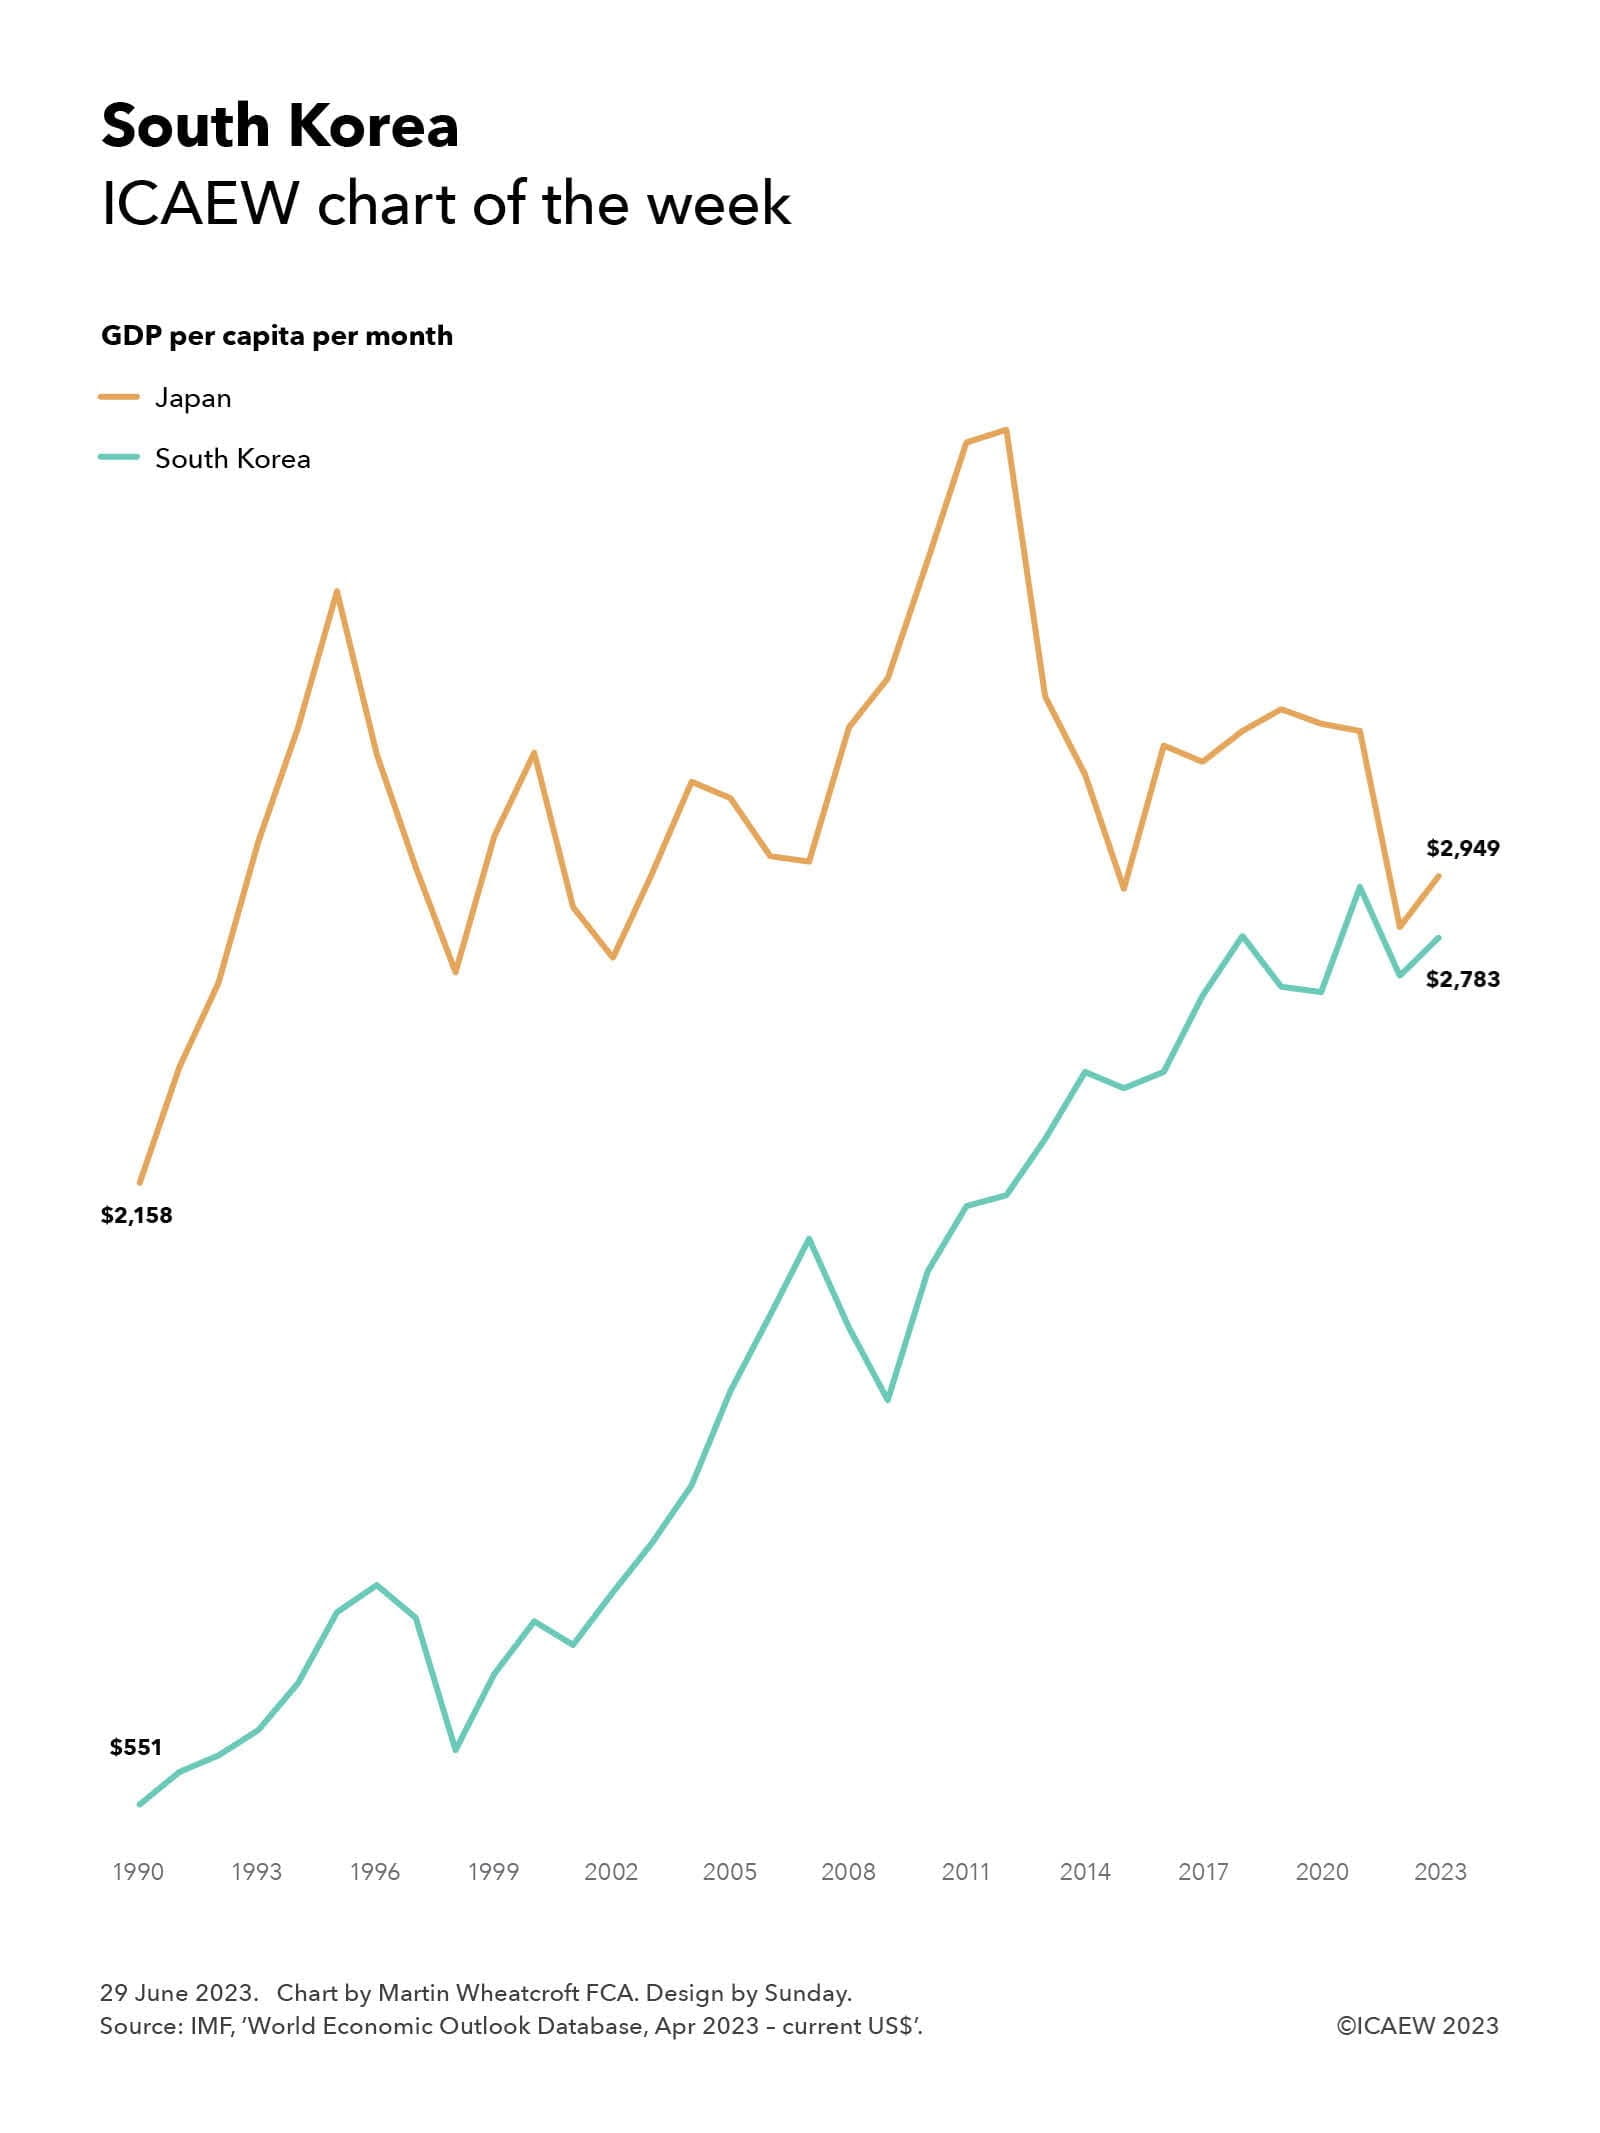
As our chart this week illustrates, GDP per capita in 1990 in South Korea was $551 per month in then current US$, approximately one quarter of its neighbour Japan’s GDP per capita per month at that time of $2,158
South Korea has seen its economy grow pretty strongly over the last three decades to reach a forecast GDP of $2,783 per person per month for the current year according to the International Monetary Fund (IMF). This is only a little below the economic activity of $2,949 per person per month anticipated to be generated by Japan in 2023.
As the chart illustrates, South Korea has made steady economic progress since 1990. Outside of recessions and pandemics there have been continual improvements in economic activity and in living standards, resulting in the country moving from the developing nation category to an advanced economy.
This compares with the economic performance of neighbouring Japan, which has been on an economic rollercoaster since the end of the economic boom in the mid-1990s. While a strong currency in the run-up to the global financial crisis boosted the size of its economy in US dollar terms, Japan has subsequently underperformed as its ageing population and lack of immigration has caused its economy to slow and the Yen to fall.
Not shown in the chart is the progress made in purchasing power parity (PPP) international dollars, the measure that economists prefer to use when comparing economic performance between countries as it takes account of differences in living costs. This would show a narrower difference in 1990, when South Korean and Japanese GDP per capita per month were 629 and 1,692 international dollars respectively, and would also show South Korea outgrowing Japan with GDP per capita per month in 2023 of 4,725 international dollars, compared with 4,317 international dollars for Japan.
Many South Koreans waking up on Wednesday 28 June 2023 will have been pretty happy to discover they are now a year or two younger than they were the day before. They may be less likely to reflect on the economic miracle that has taken their country from the depths of extreme poverty in the early 1950s, following the Korean War, to becoming the prosperous nation that South Korea is today.
Latest charts
Recommended content
ICAEW Community

Public Sector Community
The go-to place for guidance on issues affecting finance professionals working in and with the public sector. With a range of dynamic services, ICAEW provides valuable tools, resources and support tailored to the public sector.
Resource
More economic insight
ICAEW works with Oxford Economics to provide useful insight and timely intelligence for finance professionals and their clients.
Read moreResource

Energy crisis hub
Analysis of how supply difficulties, rising electricity prices and sanctions against Russia are contributing to turmoil in energy markets. Find out what business can do to lessen the impact.
Find out more