Contributing to your CPD?
If this article is supporting your professional development, it can count towards your verifiable CPD hours. Use the pop up at the bottom right corner of your screen to add reading this article as an activity to your online CPD record.
The European Union’s Budget for the 2024 calendar year amounts to €143bn, with national governments contributing €137bn and EU institutions generating the balance of €6bn. At a current exchange rate of £1:€1.17 this is equivalent to a budget of £122bn comprising national contributions of £117bn and other income of £5bn.
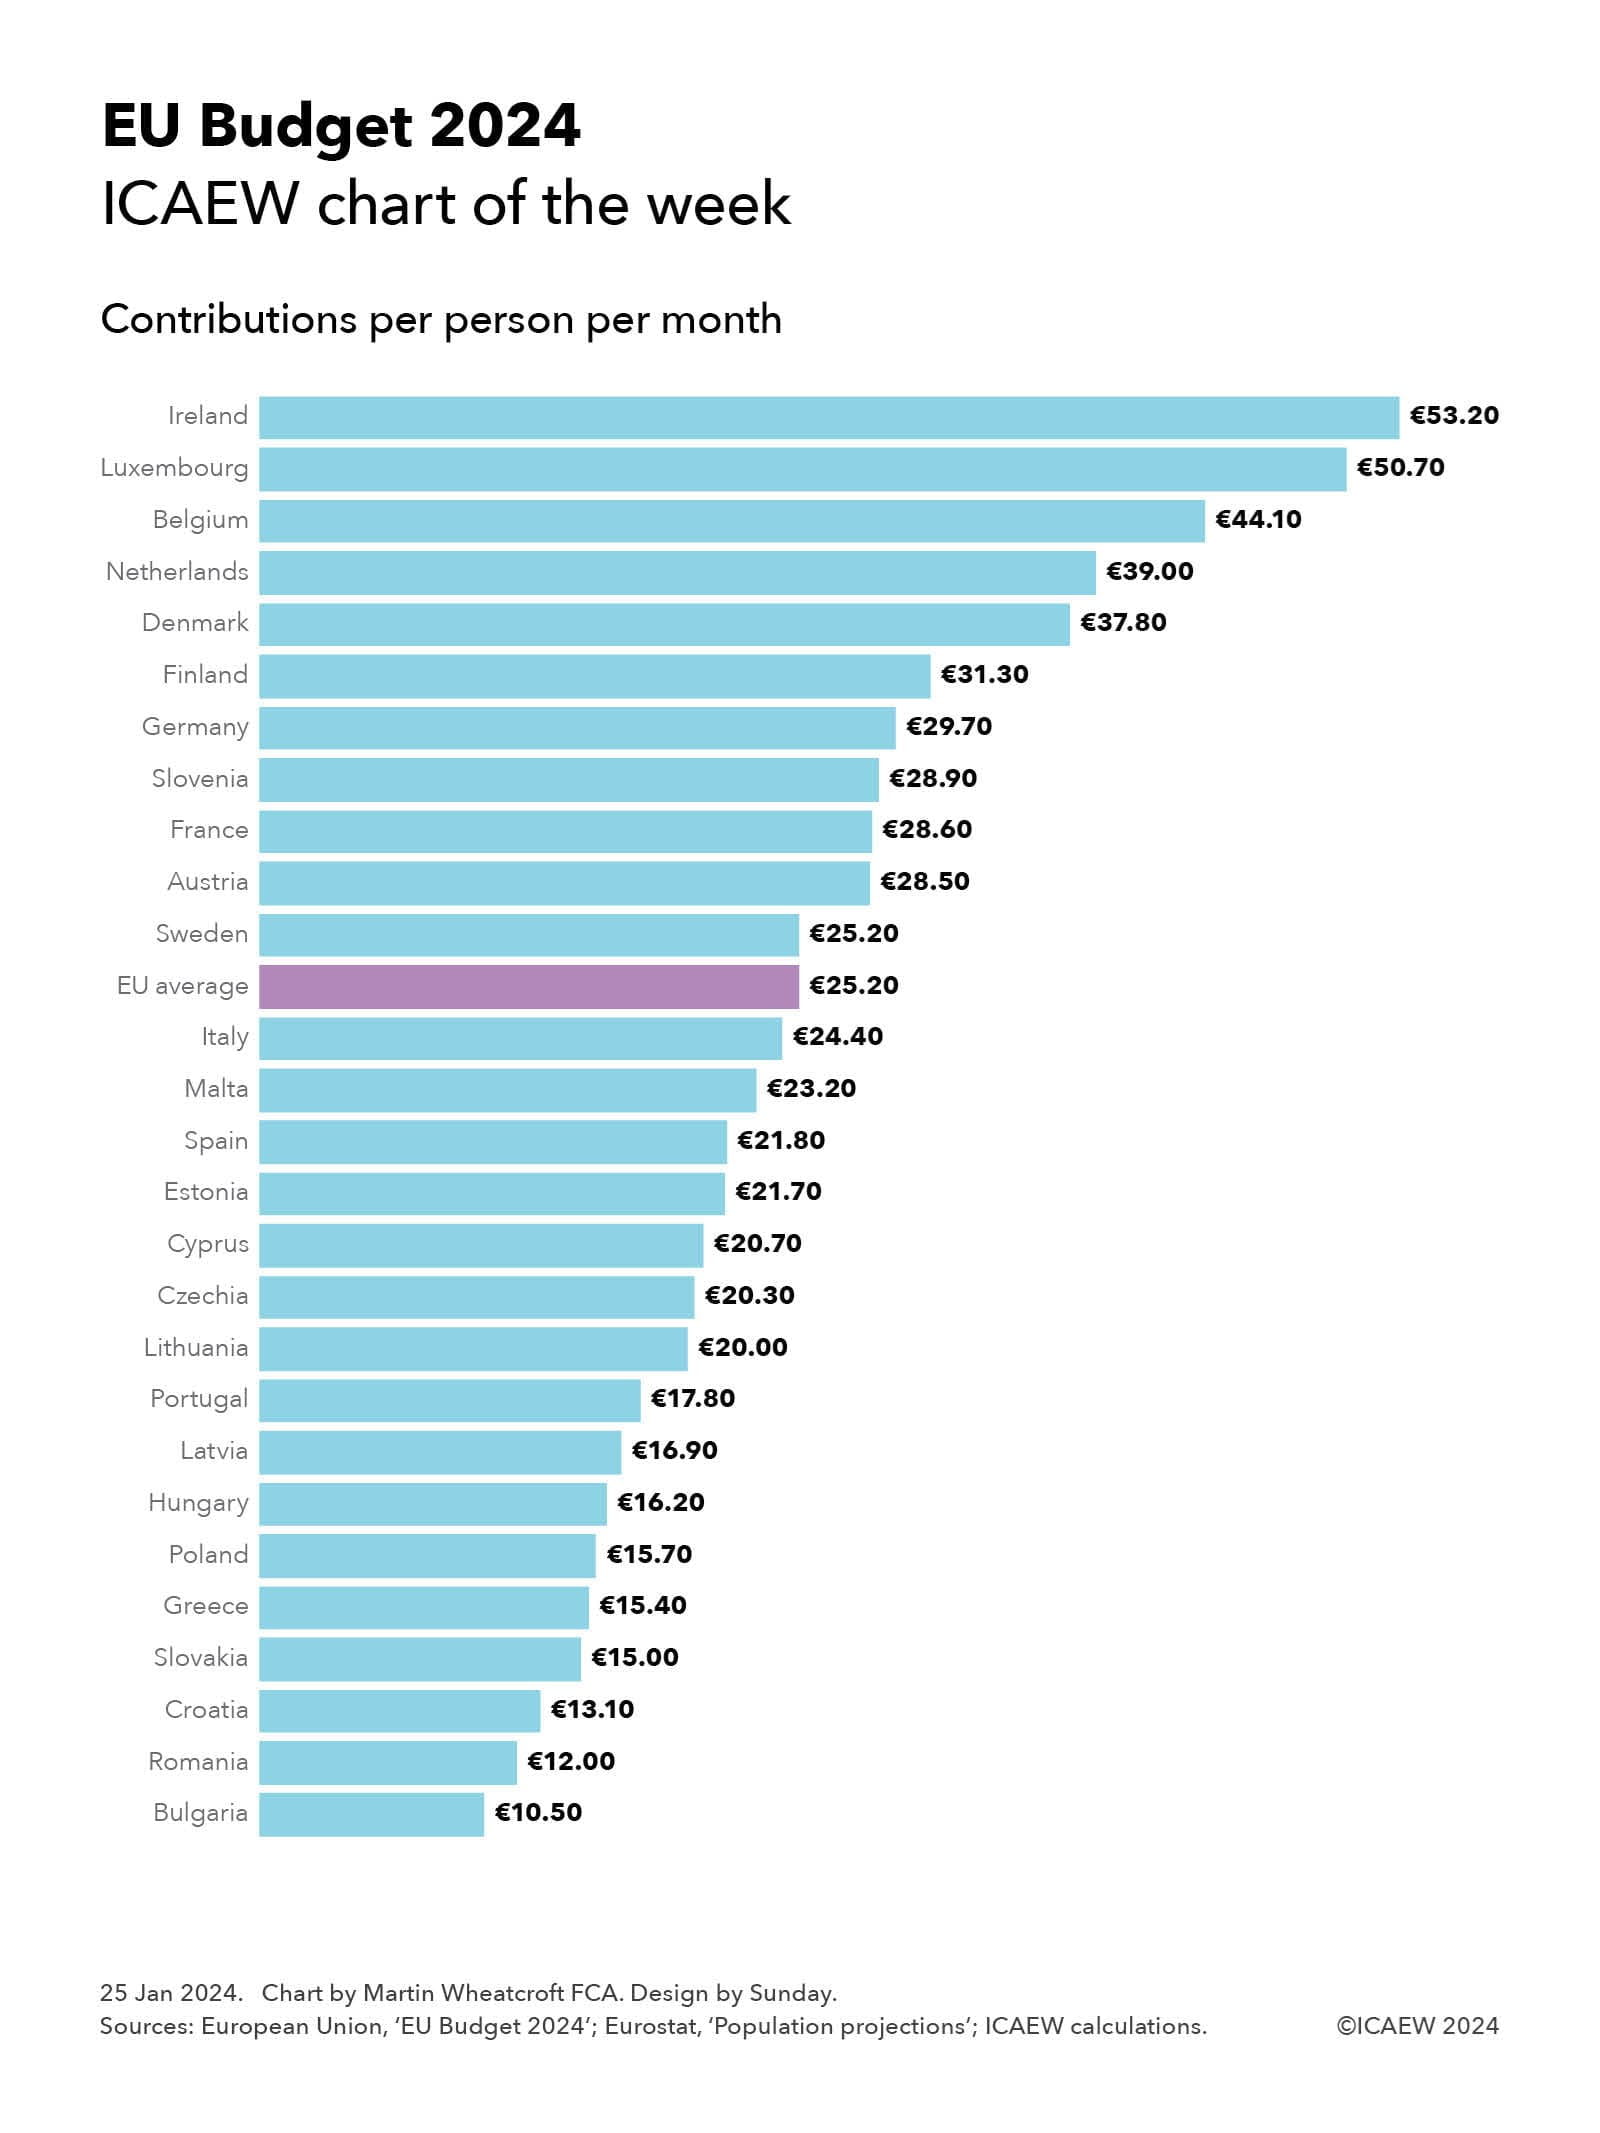
Our chart this week illustrates how much national governments contribute to the EU budget on a per capita basis, ranging from Ireland contributing the most to Bulgaria the least. Ireland’s recent economic success has seen it overtake Luxembourg as the country with the highest GDP per capita, and hence the highest per capita contributor to the EU Budget.
The average contribution for the EU’s population works out at just over €302 (£258) per person per year or €25.20 (£21.50) per person per month, based on a total population of 453m living in the 27 EU member countries.
The chart shows how Ireland’s contributions are equivalent to €53.20 per person per month, followed by Luxembourg on €50.70, Belgium on €44.10, Netherlands on €39.00, Denmark on €37.80, Finland on €31.30, Germany on €29.70, Slovenia on €28.90, France on €28.60, Austria on €28.50, Sweden on €25.20, Italy on €24.40, Malta on €23.20, Spain on €21.80, Estonia on €21.70, Cyprus on €20.70, Czechia on €20.30, Lithuania on €20.00, Portugal on €17.80, Latvia on €16.90, Hungary on €16.20, Poland on €15.70, Greece on €15.40, Slovakia on €15.00, Croatia on €13.10, Romania on €12.00, and Bulgaria on €10.50.
Total contributions of €137bn amount to approximately 0.8% of the EU’s gross national income of €17.7trn. They comprise €25bn from 75% of customs duties and sugar sector levies, a €24bn share of VAT receipts, €7bn based on plastic packaging that is not recycled (providing countries with an economic incentive to reduce it), and €82bn calculated as a proportion of gross national income.
While the UK ‘rebate’ no longer exists, these numbers in the chart are net of the equivalent but proportionately smaller ‘rebate’ totalling €9bn that continues to go to Germany, Netherlands, Sweden, Austria and Denmark. The EU Commission had proposed removing it during the negotiations for the 2021 to 2027 multi-year financial framework but was unsuccessful in persuading these five countries to give it up.
The chart only shows the gross contributions paid by national governments – it doesn’t show the amount that comes back to each country through EU spending, whether in the form of economic development funding and agricultural subsidies, through science, technology, educational or other programmes, or through the economic benefits of hosting EU institutions. This will reduce the effective net contribution for most of the richer nations, while poorer member states will benefit by more coming from the EU than they are paying in.
The numbers also do not include €113bn (£97bn) of spending through the NextGenerationEU programme that is funded by direct borrowing by the EU. This is equivalent to additional spending of €20.80 per person per month that will need to be repaid over the next few decades – hopefully through the benefits of higher economic growth.
Latest charts
Recommended content
ICAEW Community

Public Sector Community
The go-to place for guidance on issues affecting finance professionals working in and with the public sector. With a range of dynamic services, ICAEW provides valuable tools, resources and support tailored to the public sector.
Resource

More economic insight
ICAEW works with Oxford Economics to provide useful insight and timely intelligence for finance professionals and their clients.
Read moreResource
Energy crisis hub
Analysis of how supply difficulties, rising electricity prices and sanctions against Russia are contributing to turmoil in energy markets. Find out what business can do to lessen the impact.
Find out more