The latest statistics from the Office for National Statistics (ONS) up to February 2024 highlight how retail sales in Great Britain (England, Wales and Scotland) have been on a rollercoaster ride over the past five years as the pandemic, then the cost-of-living crisis, battered the economy.
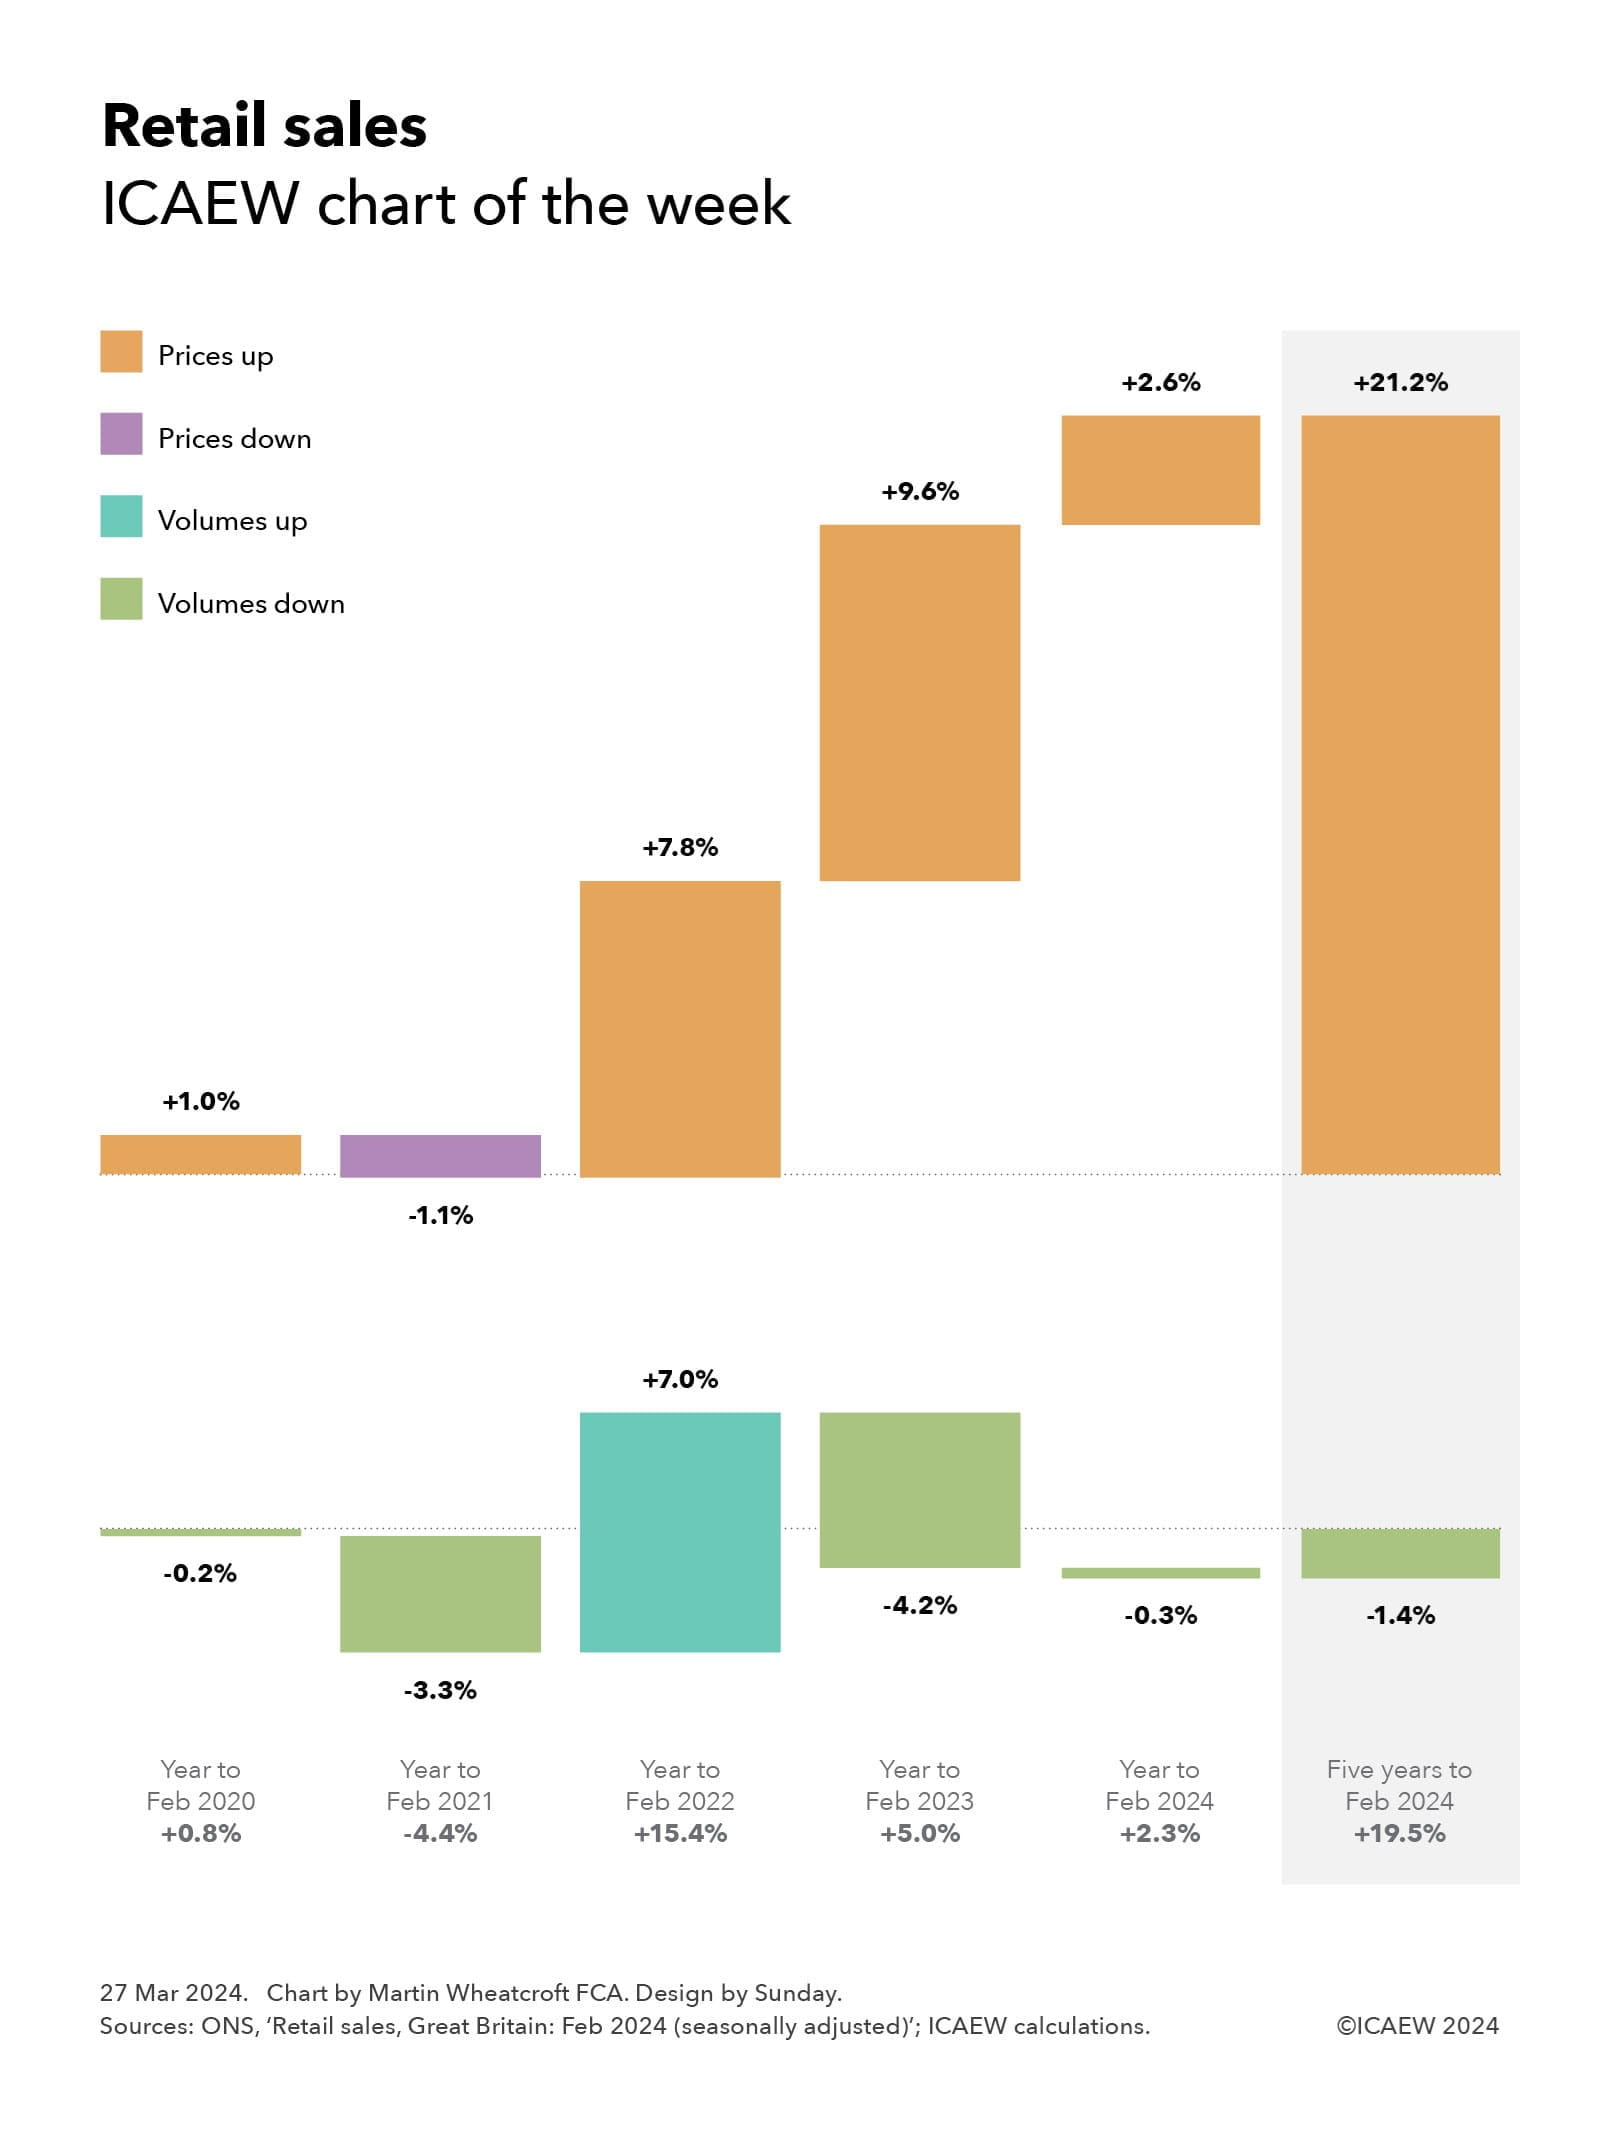
As our chart of the week illustrates, changes in retail sales can be split between volumes and prices, with growth in retail sales of 19.5% over the five years to February 2024 consisting of a 1.4% fall in volumes and a 21.2% increase in prices.
Our chart also shows how retail sales have increased by year, starting with a 0.8% increase in retail sales in the year to February 2020 (from a 0.2% fall in volumes and a 1% increase in prices) before the first pandemic lockdown the following month. That first year of the pandemic to February 2021 resulted in a 4.4% decline in sales (a 3.3% fall in volumes and a 1.1% reduction in prices) as we cut back on spending, followed by a massive 15.4% jump in retail sales in the year to February 2022 (7% from higher volumes and 7.8% from higher prices) as the nation emerged and started to spend heavily.
The cost-of-living crisis was behind a 5% increase in retail sales in the year to February 2023, as although prices rose 9.6% as inflation accelerated, households cut back on what they bought in response to drive a 4.2% fall in retail volumes.
Retail sales were up by a more modest 2.3% in the year to February 2024, comprising a 0.3% fall in volumes and a 2.6% increase in prices as inflation moderated.
Evening out the ups and downs gives an average increase in retail sales of 3.6% a year over the last five years, comprising an average fall of 0.3% a year in volumes and an average increase of 3.9% in prices.
This is not as positive a picture for retail business as the numbers might imply. Although it appears that retailers are selling slightly less overall at much higher prices, our chart doesn’t reflect the substantial increases many have seen in their input costs over the same period.
For more ICAEW analysis on the economy, click here.
Latest charts
Recommended content
ICAEW Community

Public Sector Community
The go-to place for guidance on issues affecting finance professionals working in and with the public sector. With a range of dynamic services, ICAEW provides valuable tools, resources and support tailored to the public sector.
Resource

More economic insight
ICAEW works with Oxford Economics to provide useful insight and timely intelligence for finance professionals and their clients.
Read moreResource

Energy crisis hub
Analysis of how supply difficulties, rising electricity prices and sanctions against Russia are contributing to turmoil in energy markets. Find out what business can do to lessen the impact.
Find out more