Our chart marks Australia Day by looking at the federal government balance sheet over the last decade.
Australia Day is on Monday 26 January, prompting us take a look at the Australian Government’s consolidated financial position over the last 10 years.
The chart is derived from federal government consolidated financial statements prepared in accordance with Australian Accounting Standards (as adjusted for prior period adjustments), divided by annual estimates of GDP in current prices published by the Australian Bureau of Statistics in October 2025.
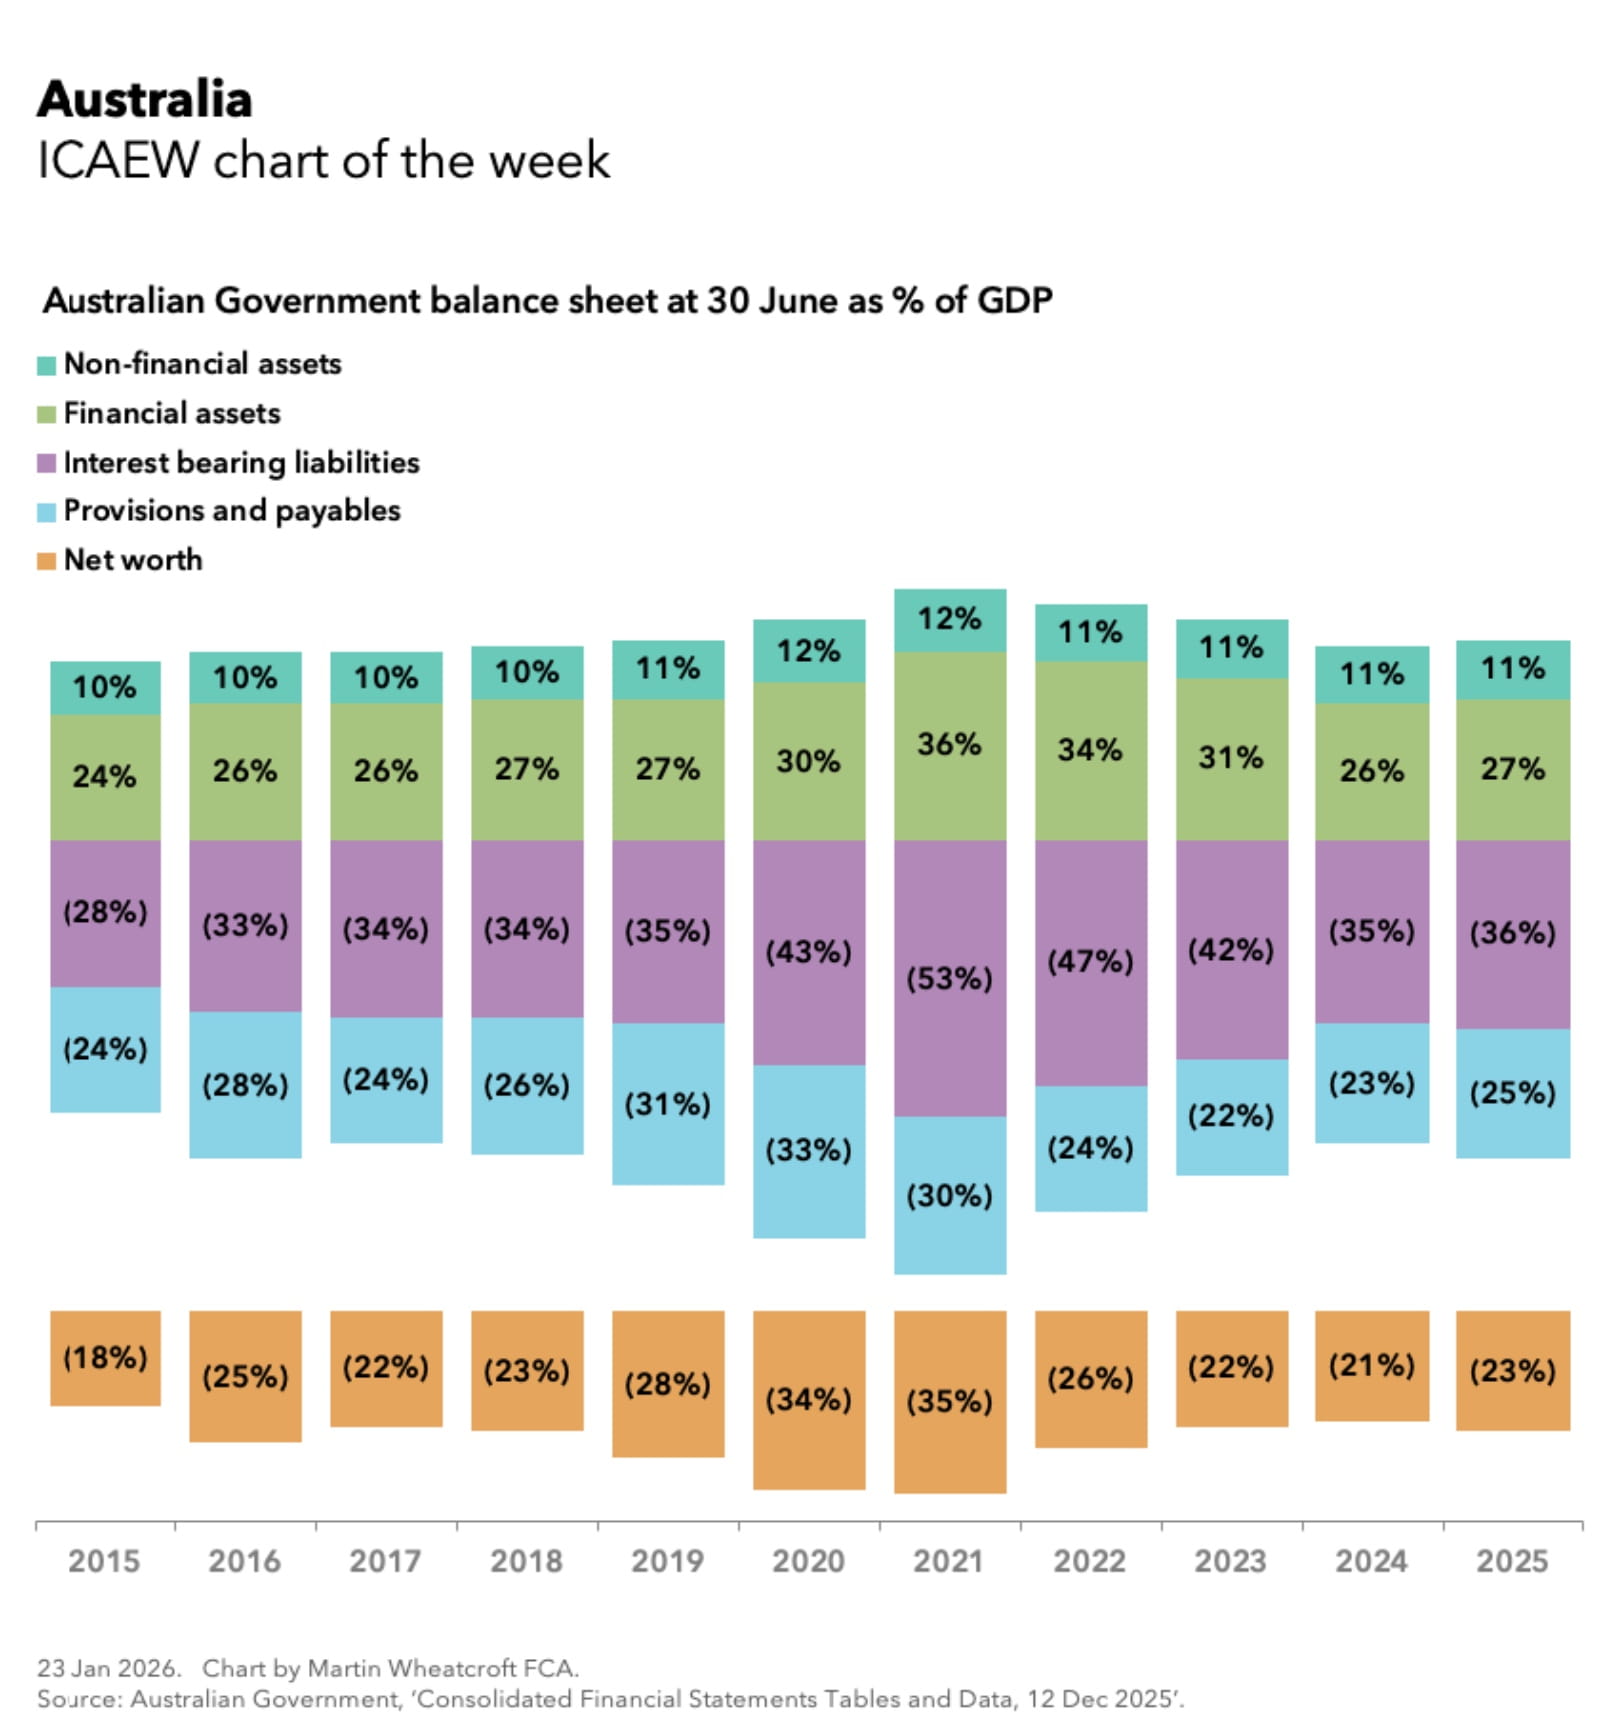
The chart shows how net worth was negative throughout the period, going from 18% of GDP on 30 June 2015 to 23% on 30 June 2025.
Other key stats from the balance sheet
- Non-financial assets going from 10% on 30 June 2015 to 11% on 30 June 2025
- Financial assets going from 24% on 30 June 2015 to 27% on 30 June 2025
- Interest bearing liabilities going from 28% on 30 June 2015 to 36% on 30 June 2025
- Provisions and payables going from 24% on 30 June 2015 to 25% on 30 June 2025
Financial assets of AU$753bn on 30 June 2025 comprised of AU$570bn in financial investments, AU$174bn in receivables and accrued revenue, and AU$9bn in cash. While non-financial assets of AU$320bn comprised of AU$94bn in military equipment, AU$96bn in other plant, equipment and infrastructure, AU$79bn in land and buildings, AU$17bn in intangibles, AU$13bn in inventories, AU$13bn in heritage and cultural assets, and AU$8bn in other non-financial assets.
Interest bearing liabilities of AU$1,009bn on 30 June 2025 comprised of AU$679bn in government securities, AU$216bn in central bank and other deposit liabilities, AU$58bn in loans, AU$33bn in leases and AU$23bn in other interest-bearing liabilities. While provisions and payables of AU$696bn comprised of AU$411bn in pension liabilities, AU$103bn Australian currency in issue, AU$50bn in payables and AU$132bn in provisions.
Net worth was -AU$632bn on 30 June 2025 and GDP in the year to 30 June 2025 was AU$2,779bn. (Australian balance sheet to GDP ratios are based on GDP for the preceding 12 months, rather the UK practice of using ‘mid-year’ GDP from 6 months before to 6 months after the balance sheet date).
Nominal GDP has increased by 70% or an average of 5.5% a year over the past decade, comprising inflation of 3.2% a year on average and average economic growth of 2.2% a year. The latter reflects average population growth of 1.5% per year and average per capita economic growth of 0.75% per year.
Not shown in the chart are revenues as a share of GDP respectively in the 10 financial years from 24% in 2015/16 to 27% in 2024/25, expenditure of 27% in 2015/16 to 29% in 2024/25, and net accounting (deficits)/surpluses as a share of GDP of (2.4%) in 2015/16 to (1.5%) to 2024/25. Net investment averaged 0.5% of GDP over the ten years.
This is of course not the full picture of the Australian public finances, as these numbers exclude approximately AU$1.7tn of positive net worth in the balance sheets of states and territory governments and local authorities across Australia.
Overall, Australia’s overall general government net debt – including states, territories and local government, but excluding illiquid financial assets, non-financial assets and non-debt liabilities – is reported to be around 32% of GDP in 2025. This compares with around 95% of GDP for the UK according to the IMF.
Apart from the pandemic years – when deficits rose and GDP fell in real terms – what is remarkable is how stable the Australian Government balance sheet has been over the last decade when compared with the size of the Australian economy.
This has been partly down to the continued growth of Australia’s sovereign wealth funds (the Australia Future Funds) and the decision to close federal defined benefit pension schemes to new members in 2005 (non-military) and 2016 (military), slowing the growth in these liabilities. It also reflects a relatively prudent fiscal stance over the last few decades by successive governments.
For the Australian Government, this is a positive financial position to be in.
Latest charts
Further resources
ICAEW Community

Public Sector Community
The go-to place for guidance on issues affecting finance professionals working in and with the public sector. With a range of dynamic services, ICAEW provides valuable tools, resources and support tailored to the public sector.
Resources

Economy explainers
ICAEW experts offer simple guides to help understand the technical, economic jargon that is discussed when talking about public finances and the economy.
Find out moreICAEW support

Training and events
Browse upcoming and on-demand ICAEW events and webinars offering support on technical areas, such as assurance, reporting and tax, as well as personal development.
Events and webinars A-Z of courses