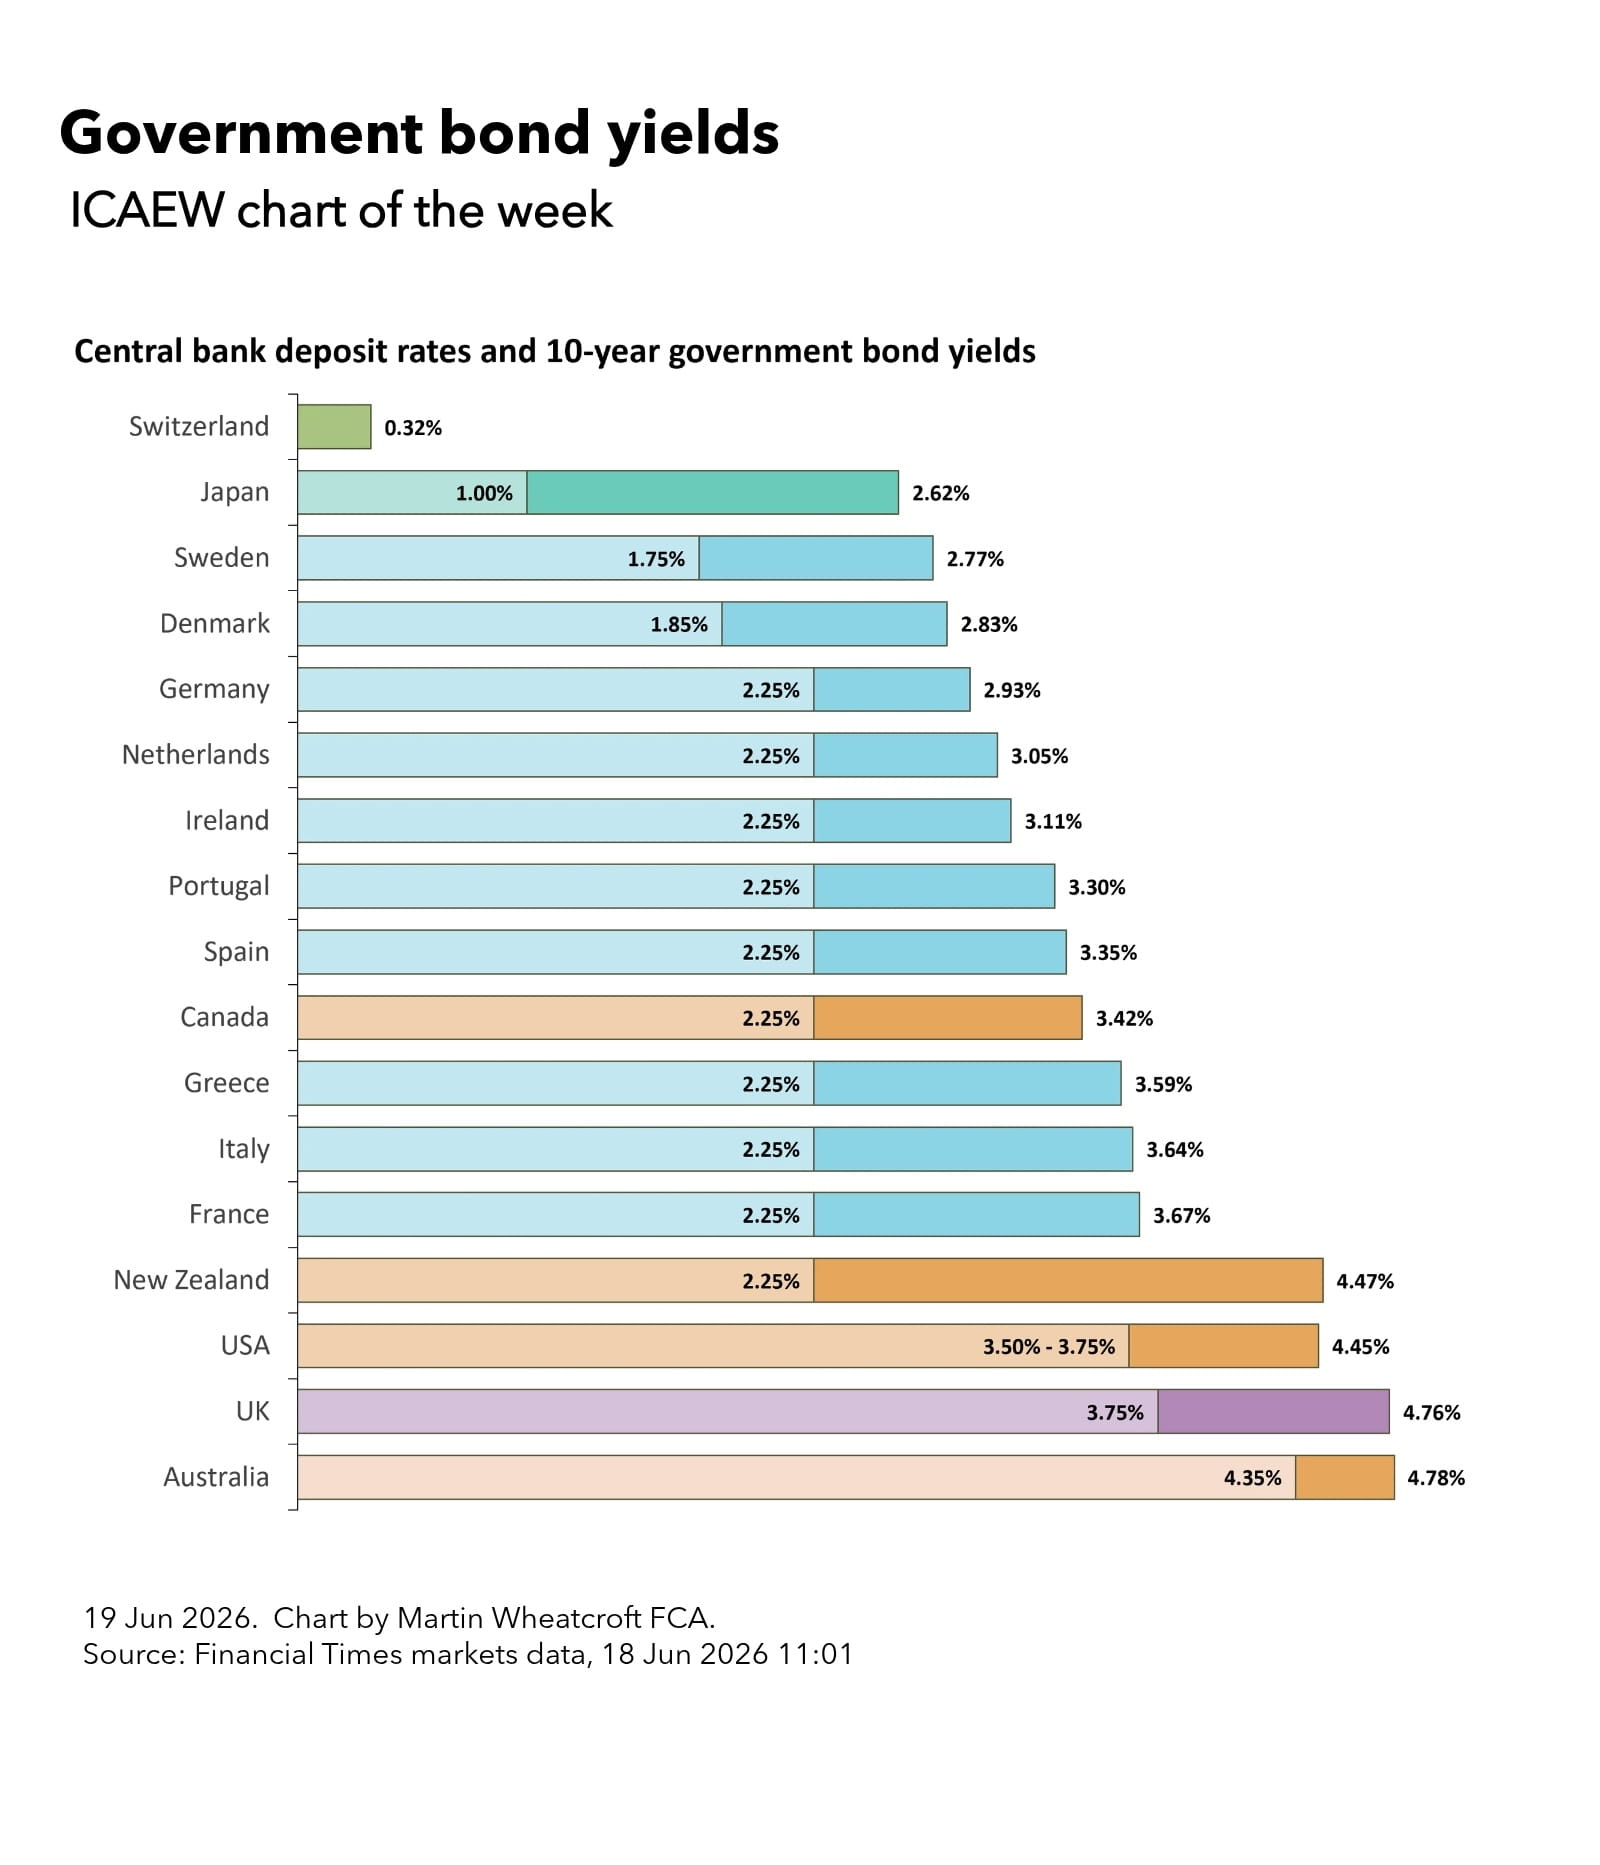
According to a snapshot taken from Financial Times market data at 11:01 BST on 18 June 2026, the yield on 10-year government bonds for 17 advanced economies ranged from 0.32% for Switzerland and 2.62% for Japan up to 4.76% for the UK and 4.78% for Australia.
By yield, we mean the expected return to investors purchasing bonds at their current market value. This is equivalent to the effective interest rate payable by the governments concerned if they were to issue fresh 10-year bonds at that point in time.
The yields on Swiss and Japan government bonds are anchored by the Swiss and Japanese central bank deposit rates of 0.0% and 1.0% respectively, which in turn are influenced by the inflation outlook in each country (consumer price inflation in April 2026 was 0.6% and 1.4% respectively). They are also influenced by debt investor perceptions of the strengths and weaknesses of their respective economies and public finances.
For example, Switzerland and Japan had general government net debt of 19% and 136% of GDP in December 2025 respectively according to the IMF, although markets also factor in the wider government balance sheets of these countries, any projected shortfalls between revenues and expenditures, and prospects for future economic growth.
Among the European Union countries shown in the chart, Sweden had the lowest yield on their 10-year bonds at 2.77%, followed by Denmark at 2.83%, but these had lower central bank interest rates of 1.75% and 1.85% than the Eurozone’s 2.25%. Denmark had general government net cash of 6%, while Sweden had general government net debt of 12% at the end of 2025.
Among countries using the Euro, Germany had the lowest yields and therefore the cheapest borrowing costs at 2.92%, followed by the Netherlands (3.04%), Ireland (3.10%), Portugal (3.28%), Spain (3.34%), Greece (3.58%), Italy (3.63%) and France (3.66%). Their respective net debt/GDP percentages were Germany 47%, Netherlands 36%, Ireland 26%, Portugal 86%, Spain 85%, Greece 146%, Italy 128% and France 109%, illustrating how government debt is not the only factor affecting national creditworthiness from a market perspective.
The current yield on 10-year government bonds issued by Canada was 3.39% (in the middle of the European pack). It had a central bank benchmark deposit rate of 2.25% and general government net debt of 10% of GDP.
This was followed by the USA on 4.45% (on a central bank deposit rate of 3.50% to 3.75% and general government net debt of 97%), New Zealand 4.47% (2.25% and net debt of 26%), the UK 4.75% (3.75% and net debt of 94%) and Australia 4.78% (4.35% and net debt of 32%).
The outlier here is New Zealand, which has probably the strongest public sector balance sheet proportionally of any advanced economy. Unfortunately, they need to pay more to attract overseas debt investors to invest in what is a relatively small economy.
The yield curve
Not shown in the chart is the yield curve across different durations of government bonds.
For the UK at 11:01 BST on 18 June 2026 this was 3.84%, 3.90% and 4.05% for one-, three- and six-month Treasury bills, and 4.18%, 4.31%, 4.76%, 5.16%, 5.39% and 5.46% for two-, five-, 10-, 15-, 20- and 30-year gilts respectively. Although in some circumstances the yield curve can invert, yields normally increase as the duration increases.
Higher debt + higher yields = higher government borrowing costs
Although recent events such as the conflict with Iran have caused yields to spike (up to a peak yield of 5.19% in May for the UK 10-year gilt) the current expectation is that interest rates should fall next year and the year after should fall in many countries across the world, including the UK.
The UK’s Debt Management Office is therefore issuing new gilts for much shorter durations than they have historically, in the hope that they can be refinanced at lower interest rates in a few years’ time. While this makes sense from the perspective of minimising long-term borrowing costs, there are risks associated with increasing the amount of debt that needs to be refinanced over the rest of the decade.
The picture presented in this week’s chart is a long way from the bond yields that we saw during the pandemic, when several countries, including Switzerland, Japan and Germany, benefited from negative yields that meant debt investors paid them rather than the other way around, and other countries, including the UK, were able to borrow at ultra-low interest rates.
The problem is that higher debt (for most of these countries) combined with higher effective interest rates means more money is going on debt interest, leaving that much less to spend on national priorities – as the UK government has discovered as it struggles to find some extra money to invest in defence.
The benefit of being a debt investor is that you can pick and choose which markets to participate in. The problem for governments is that they are pretty much stuck with the one they’ve got.
Latest charts
Further resources
ICAEW Community

Public Sector Community
The go-to place for guidance on issues affecting finance professionals working in and with the public sector. With a range of dynamic services, ICAEW provides valuable tools, resources and support tailored to the public sector.
Resources

Economy explainers
ICAEW experts offer simple guides to help understand the technical, economic jargon that is discussed when talking about public finances and the economy.
Find out moreICAEW support

Training and events
Browse upcoming and on-demand ICAEW events and webinars offering support on technical areas, such as assurance, reporting and tax, as well as personal development.
Events and webinars A-Z of courses