Presenting data clearly and concisely is an essential part of visual communication. Matthew Chang and Elaine Chung explain how to make data more understandable.
On an evening 14 years ago in New York, Amadou Diallo, a Guinean man, pulled a wallet from his pocket. Mistakenly believing it was a gun, four New York police officers shot at him – 19 of the 41 bullets they fired hit him. In this tragedy, one might ask how could all these police officers not plainly see what was in front of their eyes – a wallet doesn’t look much like a gun, after all. Yet the officers were acquitted of murder based on their perceived reality. Could it be, then, that our perception is a strong determinant of our actions and that humans can only make sense of what they can see, not what they should see?
Look at the image below. [Here, the print version of this article contains an image of a landscape, within which is embedded a distinct image of a woman's face. This image cannot be reproduced here.] The chances are you see a familiar, tranquil picture of a river with dense forests along its banks. Yet, another distinct image is embedded into this rather picturesque scene. Can you see it?
Did you notice the woman’s face? Once the embedded picture of the woman’s face has been found, it is no longer hard to spot it; it becomes easier.
There are essentially two important observations that should be made from this exercise:
- If you don’t know what to look for, you may never be able to see it.
- Even in cases where you have an idea of what you are looking for, because your eyes are drawn to familiarity, you may only see what you want to see and not what was intended for you to see.
Humans experience the world predominantly through their eyes. Visual perception transports the world to the visual cortex of our brains at very high speeds and with equal subtlety. Therefore, if the intended purpose of a presentation is to present information to people’s eyes, then it is important to understand how the eye works and of course, the real limitations that are present between seeing and fully understanding. Colin Ware of the University of New Hampshire, a renowned expert on visual perception, makes a great case for understanding visual acuity (see the quote below). Indeed, in understanding the nuances of this process, one is left to admire the power of visual images and their ability to move us emotionally and to help us develop our own cognitive abilities. A well-designed image really can speak a thousand words.
The eye and the visual cortex of the brain form a massively parallel processor that provides the highest-bandwidth channel into human cognitive centres… the visual system has its own rules. We can easily see patterns presented in certain ways, but if they are presented in other ways, they become invisible… If we can understand how perception works, our knowledge can be translated into rules for displaying information.
Visual perception and data presentation
The ‘thousand words’ adage suggests that an elaborate idea or message can be conveyed with just a single still image. It also describes the notion that large amounts of data can be taken in quickly through visualisation. That notion is strengthened by considering that training materials used by the US government cite studies indicating that the retention of information three days after a meeting is six times greater when information is presented by visual and oral means rather than through spoken word alone. These same materials also cite studies by educational researchers which suggest that approximately 83% of human learning occurs visually.
Presenting data effectively is not just a matter of merely displaying data for its own sake, but is also to develop a better understanding of the ‘rules’ of how visual perception works. Through this understanding, information can be presented in a manner that appeals to the audience’s visual perception, thus leading to further understanding of the data presented and ultimately helping them to make the best possible decision. We’ve listed some examples here.
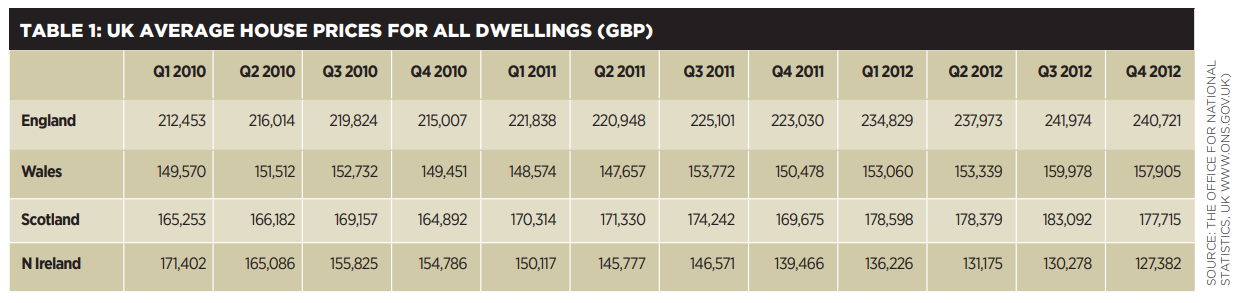
Let’s look at the information on UK house prices. The table below is functional in terms of providing precise values or perhaps as a means for individual value references. A sense-making process is required in order for us to understand the trend in housing prices.
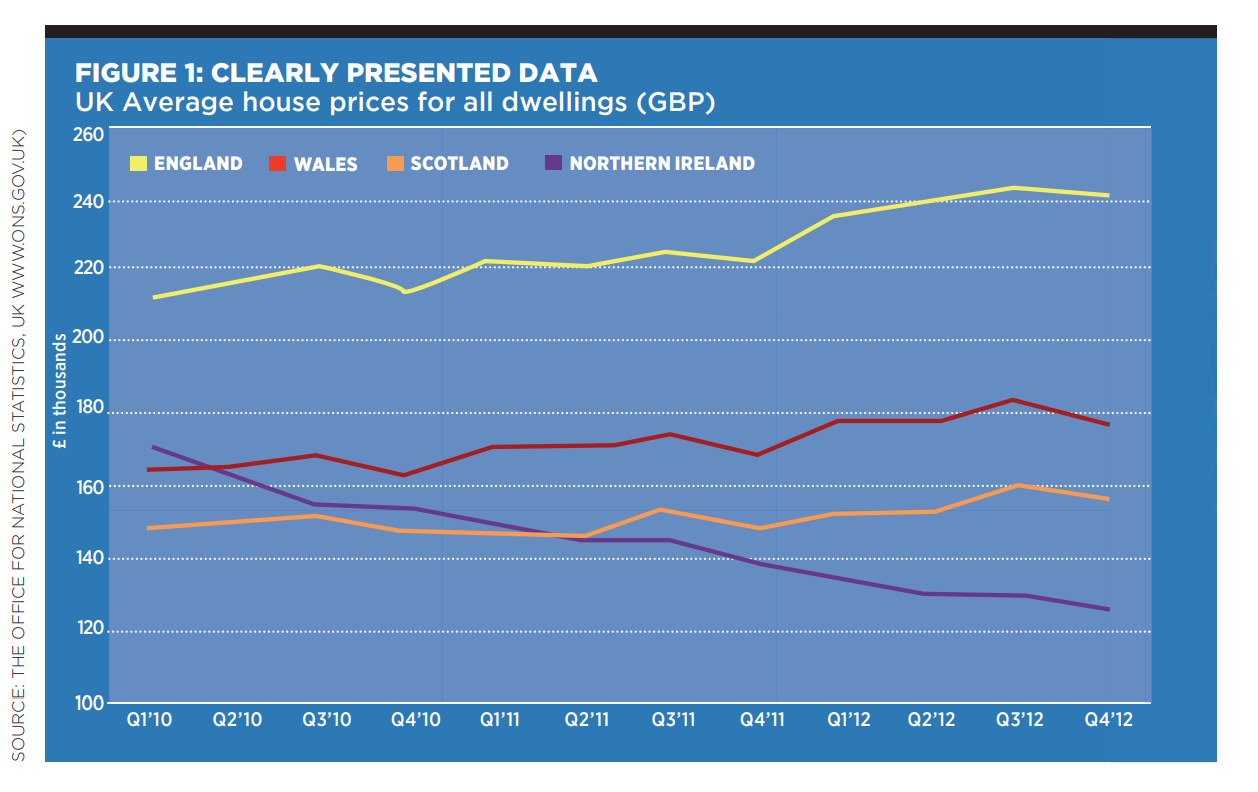
Most data analysis involves examining and making sense of relationships in the data presented to us by comparing several values at a time. For us to derive trends, patterns and exceptions, a visual representation provides an easier window of discerning the information than what would have been difficult or even impossible to derive from the same data presented textually. The graph instantly brings to bear several facts that weren’t obvious in the table of the same data, including:
- Northern Ireland’s average house prices have been on a declining trend in the three years up to Q4 of 2012.
- England, Wales and Scotland’s average house prices have generally moved in tandem in the three years.
- It can be seen that average house prices register a small decline towards the end of each of the years in question.
Given the enormous amount of data and information available to corporations across the globe, one of the key challenges for company executives is to have available to them a proverbial window of clarity and insight into business trends for decision-making.
In his book, Visual Explanations: Images and Quantities, Evidence and Narrative, Professor Edward R Tufte suggests that data presentation can have life-saving and, indeed, life-threatening consequences. But how? In 1854, during the deadly cholera epidemic which killed more than 600 people in a month, Dr John Snow, one of Queen Victoria’s physicians, created a system that enhanced his visual perception and later, his ability to solve the problem of the cholera outbreak. In creating a map of the area related to the cholera outbreaks, Dr Snow was able to effectively analyse the epidemic. In fact, the data showed that the victims were clustered near a well pump – this was found to be the undoubted cause of the epidemic.
Also as devastating was the 1986 Space Shuttle Challenger disaster. The shuttle disintegrated a mere 73 seconds into its flight. Later investigations revealed that the disaster could be blamed on the failure of a small part that failed as a result of low air temperature. Engineers missed the risk partly thanks to the poor presentation of data and a lack of thorough visual explanations that failed to account for the real facts relating to the temperature.
Certainly, the presentation of data matters. As such, those presenting must ensure the content should increase the reader’s ability to perceive ideas that are encoded in the data. Without this, the data is nothing more than a set of irrelevant information seeking to distort numbers and their relationship with communication.
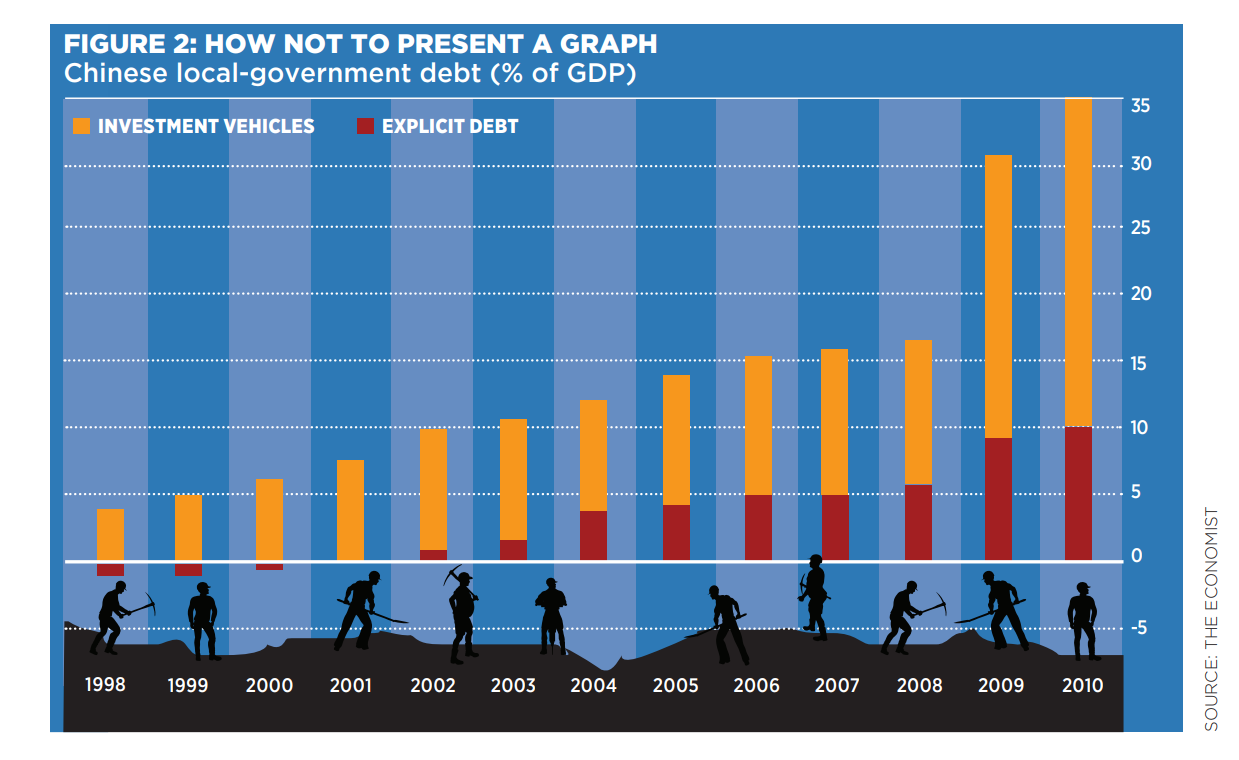
The presentation in figure 2, below – a chart replicated from a design featured in The Economist – is an example of how not to present information. The focus is no longer on the data but on the obscure imagery surrounding the numbers and represents an instance of discord between the presentation and the intended communication; it is clear that the presenters are not in tune with the needs of the audience. In fact, in his article, Common Mistakes in Data Presentation, Stephen Few argues that too often data presentations are more concerned with impressing rather than expressing, with entertaining rather than explaining and with obscuring rather than communicating. Similarly, Professor Tufte refers to egregious unnecessary visual elements in data presentation as “chart junk”. He explains that they offer little information and as such, they are distractions and are often misleading.
Data presentation and communication
Any presentation of data that is to be prepared – whether in the form of tables or graphs – is only successful to the extent that it communicates to the target audience. Anything else and the data presentation would have failed to do what it intended to do – stir action. Undoubtedly, the choice of how to present data rests solely on the essence of what needs to be communicated. The question must be asked: What do I want to communicate to my audience? If the targeted audience must look hard to see, then your presentation would have failed in its objective. Understanding visual perception helps you to understand how to influence the audience to see what you want them to see. Your data should not be hidden among a dense cloud of information; it should be embedded in the vicissitude of clarity.
Any presentation of data that is to be prepared – whether tables or graphs – is only successful to the extent that it communicates to the target audience.
A wise communicator, Antoine de St Exupery, once wrote that “in anything at all, perfection is finally attained not when there is no longer anything to add, but when there is no longer anything to take away”. When designing data for presentation, more should not be equated with excellence unless more information is needed to make the presentation more meaningful. In fact, when you are seeking to design a graph or chart, you should create something that sends a clear message through visual perception.
If you understand how humans perceive and interpret visual stimuli, then you would have understood the foundation to communicating effectively through graph design. Knowing which colours to use and how to make data stand out have been answered by scientists who have dedicated their lives to providing solid information about visual perception and its link with communication. You do not have to become a scientist to understand these concepts, but rather you must have the willingness to want to know how these concepts can be used effectively.
About the authors
Matthew Chang is a consultant. Elaine Chung is managing director at the Institute of Business Analytics, Singapore.
Download PDF version:
Related resources
The ICAEW Library & Information Service provides access to leading business, finance and management journals, as well as eBooks.
Further reading on data presentation and communication is available through the resources below.
You are permitted to access, download, copy, or print out content from eBooks for your own research or study only, subject to the terms of use set by our suppliers and any restrictions imposed by individual publishers. Please see individual supplier pages for full terms of use.
More support on business
Read our articles, eBooks, reports and guides on Financial management
Financial management hubFinancial management eBooksCan't find what you're looking for?
The ICAEW Library can give you the right information from trustworthy, professional sources that aren't freely available online. Contact us for expert help with your enquiries and research.
-
Update History
- 10 Jun 2013 (12: 00 AM BST)
- First published
- 07 Nov 2022 (12: 00 AM GMT)
- Page updated with Related resources section, adding further reading on data presentation and communication. These additional resources provide fresh insights, case studies and perspectives on this topic. Please note that the original article from 2013 has not undergone any review or updates.
