
In part 1, we looked at how to use Power Query to solve the sampling problem set out by David Lyford-Smith in part 1 of a 3-part series on creating an audit sampling template.
David has set out the problem to be solved in his three posts:
- Excel Tip of the Week #353 - Audit sampling templates: Dynamic arrays
- Excel Tip of the Week #356 - Audit sampling templates: Traditional formulas
- Excel Tip of the Week #359 - Audit sampling templates: VBA
Part 1 followed the same approach as the original article, but this method certainly has potential issues with scalability creating, as it does, potentially millions of table rows. In fact, just to check the scalability, I set up a test that resulted in the creation of over 50 million rows. Power Query eventually selected the sample but took about 100 minutes to do so.
The part 1 method coped with monetary unit sampling by creating a population that included a row for ever possible monetary unit in original population. Our 100 records totalled £535,329.15 so, with a monetary unit of £1, this involves creating a table with 535,329 rows. By adding a random value to each of these rows, we then sorted all 535.329 rows by the new random column so that we could select the required sample by position.
In this part, we are going to use a more elegant approach that scales better and that also supports the use of interval sampling.
The basis of the approach is to create a separate table containing the required number of random values, again based on the monetary unit, so between 0 and 535,329. We will then add a cumulative column to our population so that we can find which population items include each of the items in our table of random values. The method we used doesn't require the creation of any additional rows beyond the population items and the list of sample values. Our previous method created potentially millions of additional rows as it multiplied the number of population records by the number of monetary units within that population.
The first step is to create our table of random values. We can do this with a maximum of 4 steps. In step 1 we just create a list containing sequential numbers, with the length of the list determined by the sample size we set in cell B3 of our Sampling Template sheet. As we saw in the previous article, we can bring this single value into Power Query by allocating a Range Name and then using right-click, drilldown to turn it into a variable value named SampleSize:
= List.Numbers(1,SampleSize)
Step 2 uses the List Tools, Transform Ribbon tab, Convert group, To Table option to convert our list to a table.
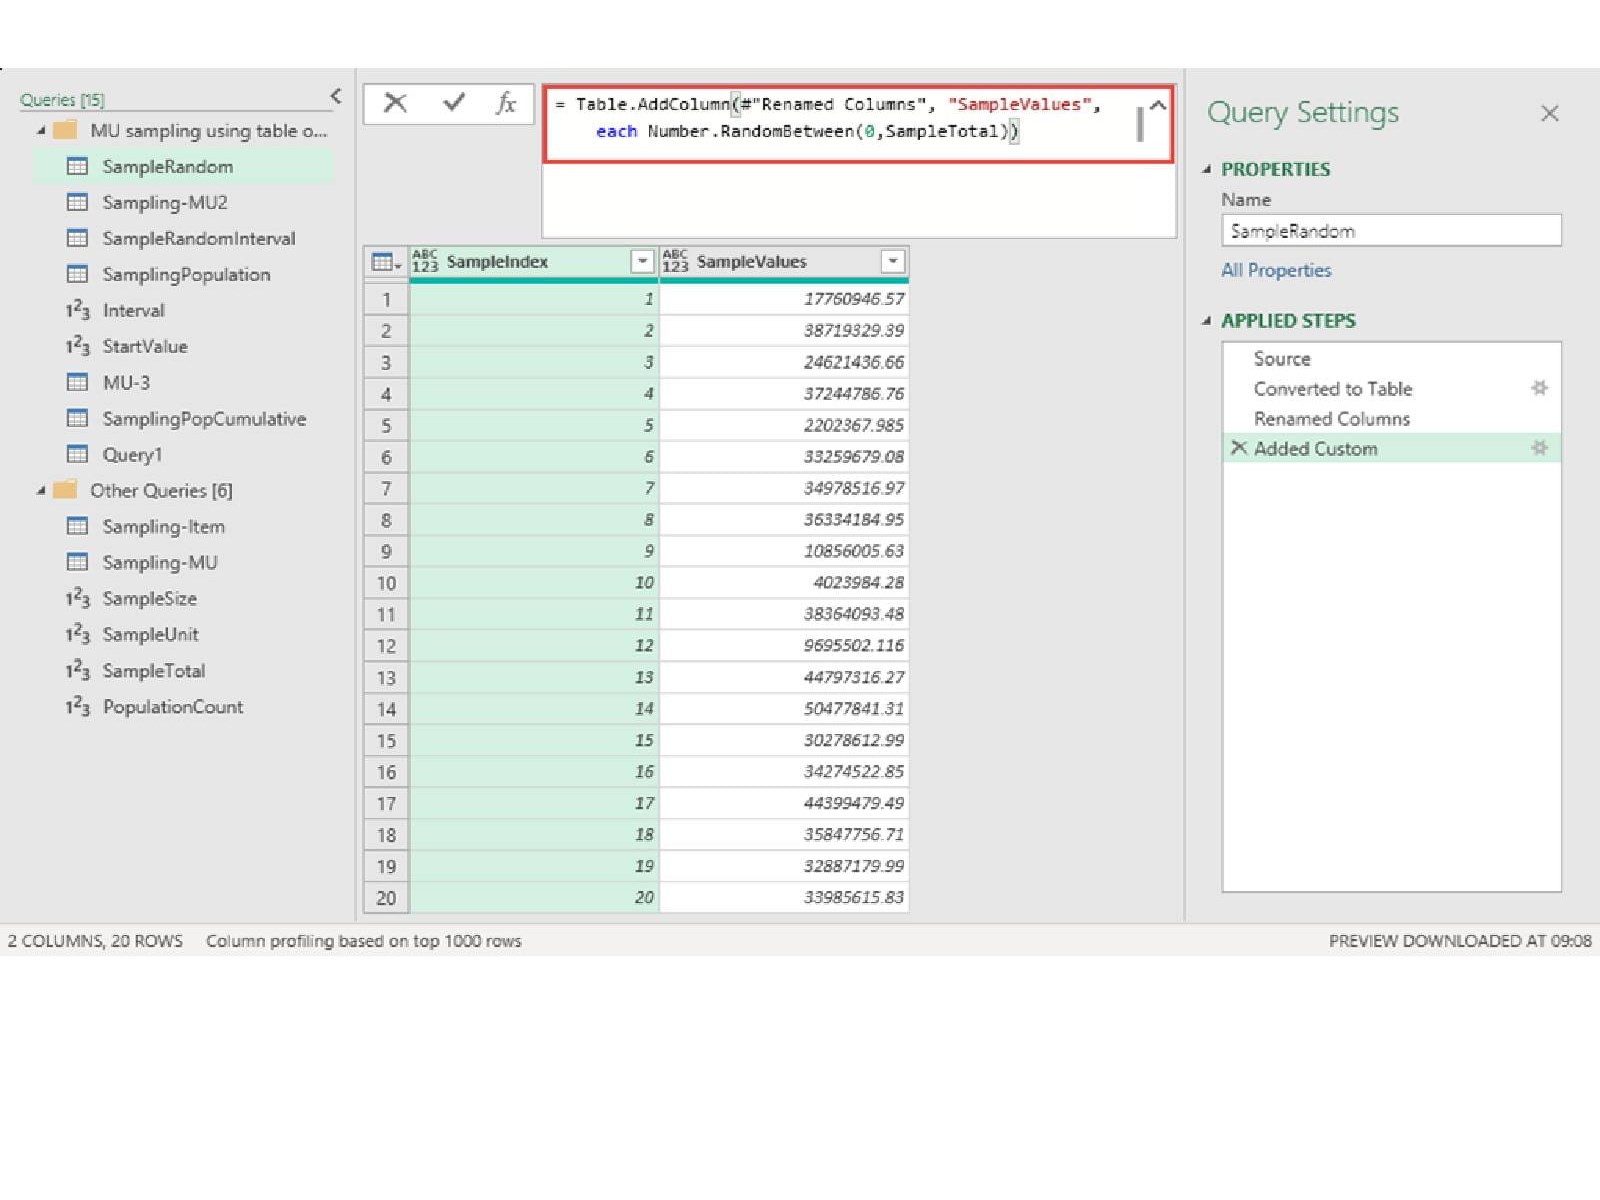
Step 3 just changes the name of our single column and Step 4 adds a column that uses Number.RandomBetween() to add random values from 0 to the sum of all our population amounts. We could create this easily enough within Power Query, but we already have a cell in our Sampling Template sheet that contains the calculation so we can just bring this in and turn it into a variable called SampleTotal in exactly the same way that we created our SampleSize variable:
Number.RandomBetween(0,SampleTotal)
If we wanted to use interval sampling, we would need to change this last step to start at a random value between 0 and our population total divided by our sample size and multiply our SampleIndex value by the same interval calculation. Our Interval value is just a blank query with the following formula, based on our existing variables, typed in:
= SampleTotal/SampleSize
The Start value is created in a similar way, but using the Number.RandBetween function in our blank query:
= Number.RandomBetween(1,Interval)
With our two variables calculated, we can change the last step to the following formula:
StartValue+([SampleIndex]*Interval)
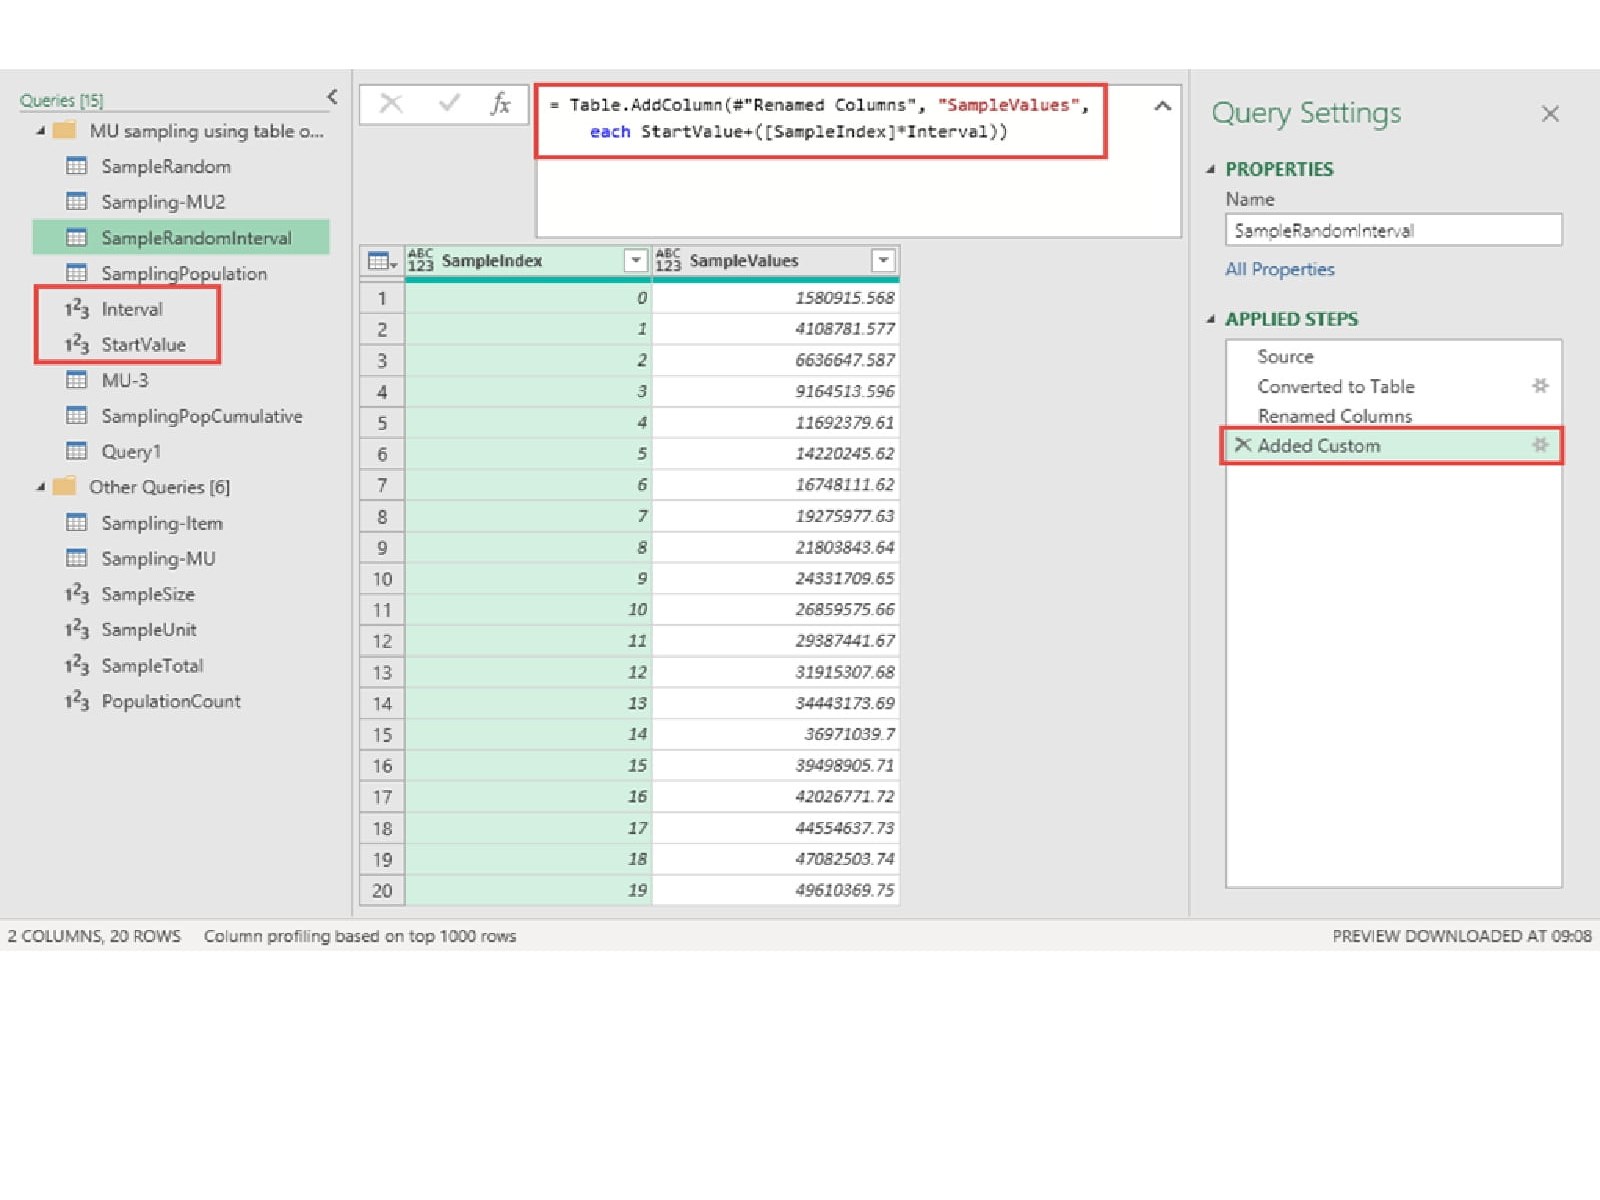
Our table is the same but with our values being evenly spaced through every monetary unit in our sample.
The key part in the next stage in the process is to calculate the cumulative values for all of our population rows so that we can see whether the values in our sample table (whether using random numbers or our intervals) fall within the range of monetary units included in each row of our population.
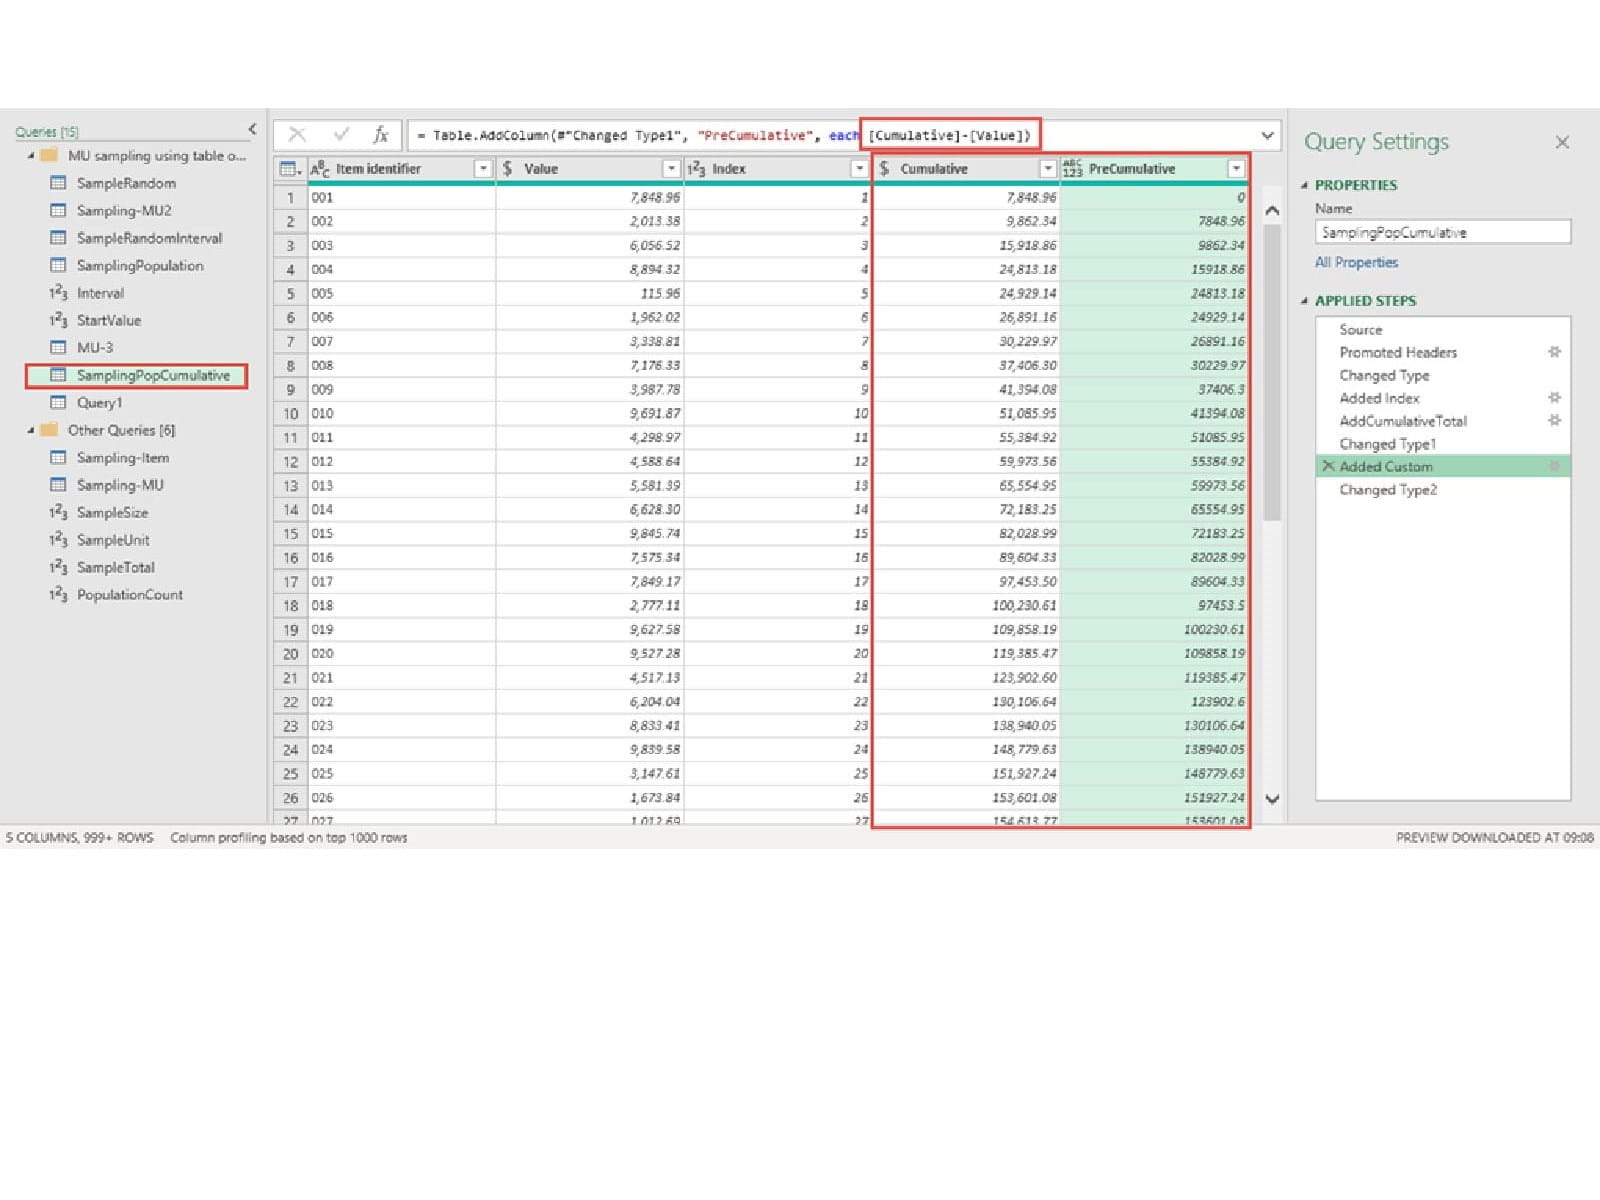
Starting with our population table, we add a simple Index Column, starting at 1, and then use this to calculate our Cumulative total for each row:
List.Sum(List.FirstN(#"Added Index"[Value],[Index]))
Again, we use List functions. This time List.FirstN() extracts all the rows from the Value column from the beginning of our table until the current row (as established by the value in the Index column – i.e. for row 5, the Index value is 5 so we use the first 5 rows). We then add a column that calculates the cumulative total excluding the current row value:
[Cumulative]-[Value]
We now have a table that contains all the items in our sampling population but with our cumulative range:
Starting by referencing our SamplingPopCumulative table above, we append our SampleRandomInterval table. Given that none of the column headings match, this will add columns to our table, with the columns in the other table for each row being null:
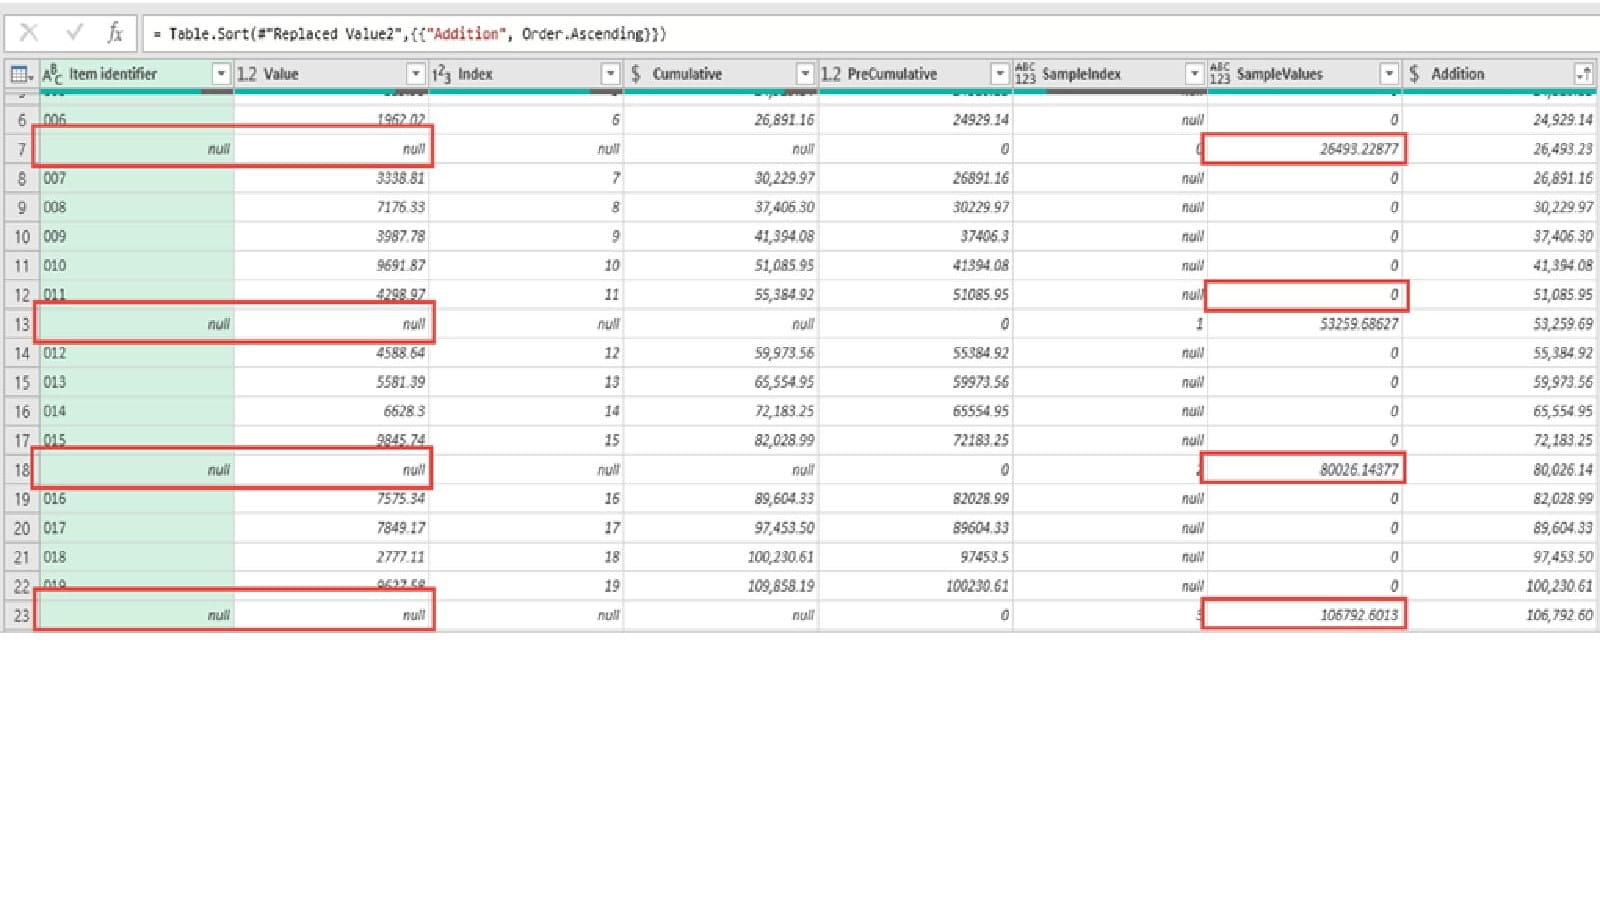
We want to add SampleValues to our PreCumulative values, so we need to replace our nulls with zeros before adding our calculation column:
= Table.AddColumn(#"Replaced Value1", "Addition", each [PreCumulative] + [SampleValues], Currency.Type)
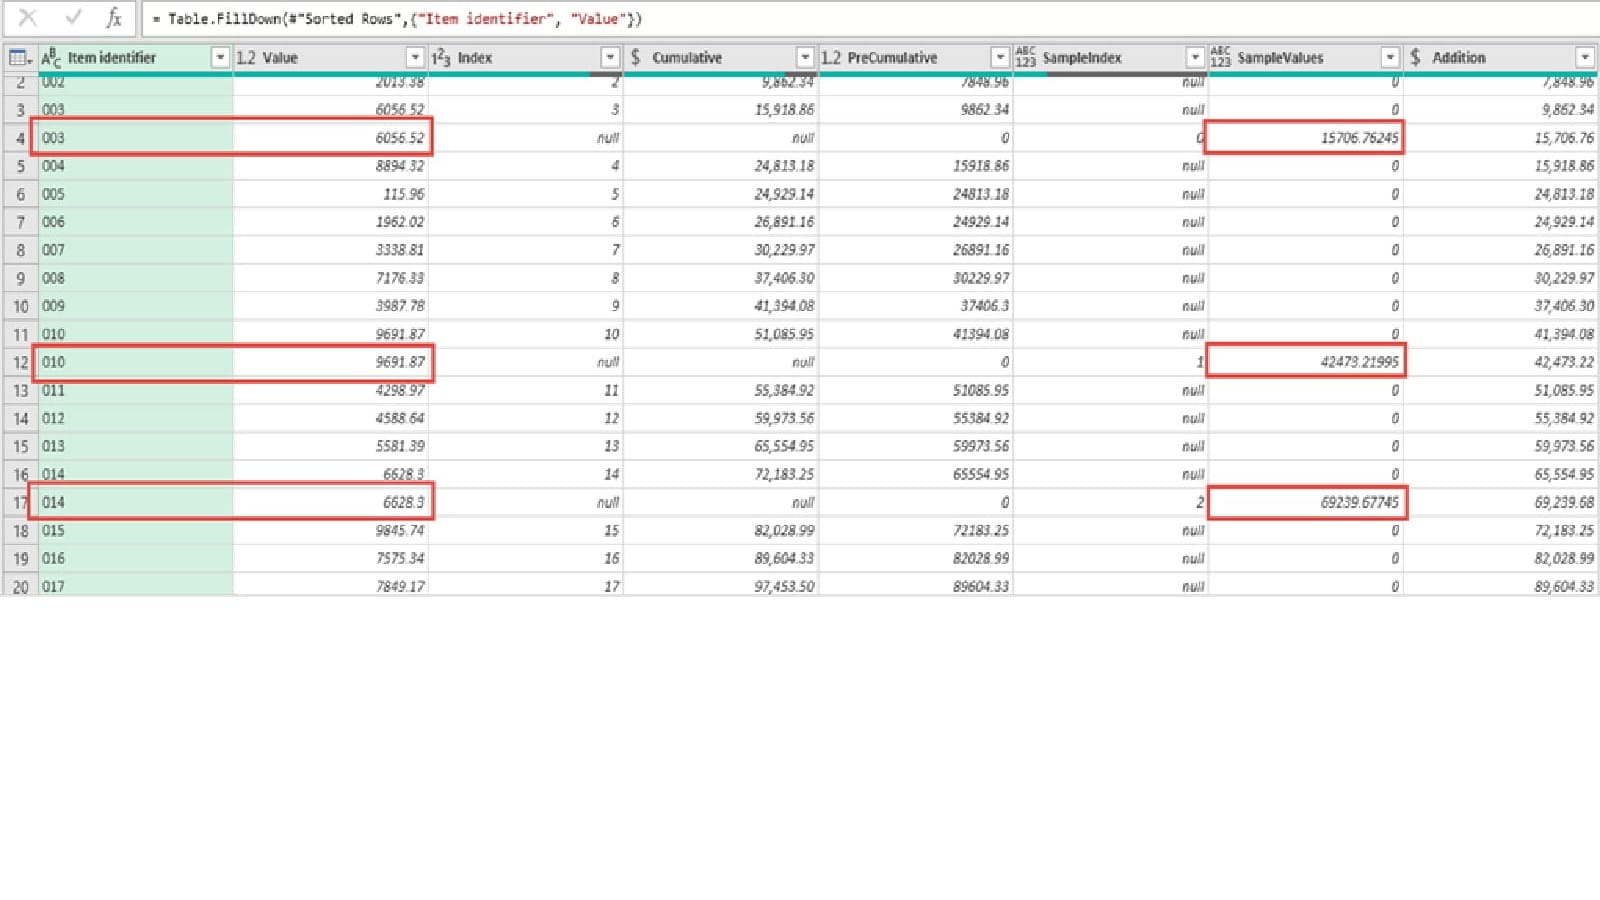
Given that for every row, we can only have either a PreCumulative or a Value entry, this gives us a single column that contains our population values and our sample values. If we sort by this column, our SampleValue rows will be slotted into our list of population rows. By using Fill, Down we can then copy our Item identifier and Value to all of our sample rows:
Before Fill, Down:
After Fill, Down:
Note that, because our SampleValues column contains random values, these are regenerated after each operation, so we end up with different sample values. We can down filter our table so that it only includes rows where we have one of our 20 sample values. Note that we could end up with a particular population item being selected more than once. For example, if using interval sampling, were a single item to be larger than our interval, two or more sample values could fall within its range. If anyone knows the correct way to deal with this, please add a comment.
As mentioned in the previous part, these examples did challenge both my knowledge of statistics and my understanding of how Power Query deals with random numbers. If you know a better way, or suspect that my method is flawed, please add a comment to let us know, preferably with information about how to correct it.
Archive and Knowledge Base
This archive of Excel Community content from the ION platform will allow you to read the content of the articles but the functionality on the pages is limited. The ION search box, tags and navigation buttons on the archived pages will not work. Pages will load more slowly than a live website. You may be able to follow links to other articles but if this does not work, please return to the archive search. You can also search our Knowledge Base for access to all articles, new and archived, organised by topic.
