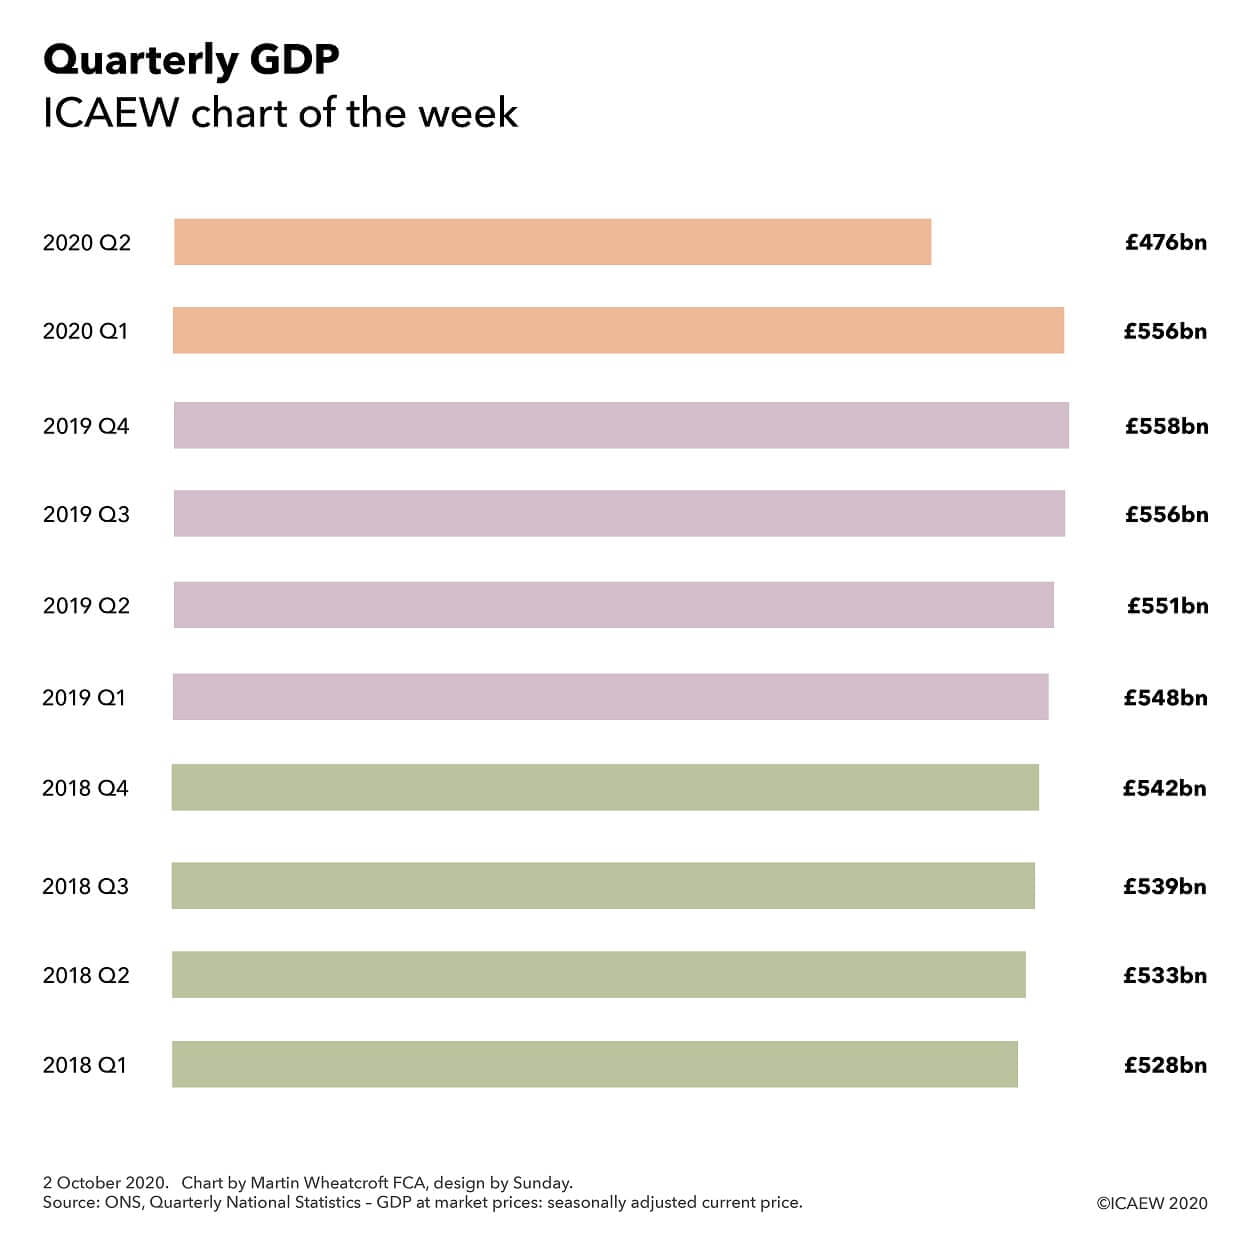
According to latest numbers from the Office for National Statistics (ONS) released on 30 September 2020, GDP for the second quarter to June 2020 fell to £476bn, a 14.5% fall in economic activity compared with the previous quarter, which in turn was 0.5% lower than the last quarter of 2019.
This week’s chart not only illustrates the damage done by the coronavirus pandemic to the economy in the first half of 2020, but also highlights how poorly the economy was performing in past couple of years, with seasonally-adjusted GDP increasing by an average of 0.8% a quarter from £528bn in the first quarter of 2018 to £558bn in the fourth quarter of 2019.
These percentage changes do not take account of the effect of inflation, with the ONS reporting a headline fall of 19.8% in real GDP in the second quarter and a 2.5% drop in the first quarter on a chained volume basis (the method used by the statisticians at the ONS to adjust for the effects of changing prices and output levels across the economy). Average quarterly real economic growth in the seven quarters to Q4 2019 was just 0.3% and around half that on a per capita basis.
The two pieces of good news are that the decline in GDP in the second quarter was less steep than originally feared, while we also know that the economy has recovered to a significant extent in the third quarter to 30 September, although we won’t know by how much until the statistics are published in November. Unfortunately, with local lockdowns across the country, the likelihood is that it will be sometime before our lives return to normal.